Services on Demand
Journal
Article
Indicators
-
 Cited by SciELO
 -
 Access statistics
Related links
-
 Cited by Google
 -
 Similars in
SciELO
 -
 Similars in Google
Share
Revista Facultad de Ingeniería Universidad de Antioquia
Print version ISSN 0120-6230
Rev.fac.ing.univ. Antioquia no.76 Medellín July/Sept. 2015
https://doi.org/10.17533/udea.redin.n76a04
ARTÍCULO ORIGINAL
DOI: 10.17533/udea.redin.n76a04
Acoustic and mechanic characterization of materials used in manufacturing the soundboard of the spanish guitar: influence in the sonority
Caracterización acústica y mecánica del material utilizado en la fabricación de la tapa de la guitarra española: influencia en la sonoridad
Ennio Hugo Idrobo-Ávila, Rubiel Vargas-Cañas*
Departamento de Física, Universidad del Cauca. Carrera 2A n.o 3N-111, Sector Tulcán. C. P. 190002. Popayán, Colombia.
*Corresponding author: Rubiel Vargas Cañas, e-mail: rubiel@unicauca.edu.co
DOI: 10.17533/udea.redin.n76a04
(Received November 7, 2014; accepted June 24, 2015)
ABSTRACT
This paper presents a study relating the most commonly used materials in manufacturing the top plate of the Spanish guitar and some sound characteristics such as timbre, volume, and duration. Theoretically, the wood influences the quality of the sound and the vibrations of the membranes. Based upon these facts, an acoustic and vibrational study was carried out in order to establish the relationship between the physical properties of the wood and the resulting sound quality. To do this, digital signal processing techniques were implemented. It was found that volume and sound duration were higher in guitars with German spruce soundboard, whereas guitars with Canadian cedar soundboard presented more homogeneous sounds.
Keywords: Timbre, volume, duration, digital signal processing, physical properties, soundboard
RESUMEN
En el presente trabajo se muestra un estudio realizado con los materiales más utilizados en la construcción de la tapa armónica de la guitarra y su relación con algunas características del sonido tales como timbre, volumen y duración. Para ello se utiliza como soporte teórico la física del sonido y de las vibraciones en membranas, y el procesamiento digital de señales. Con esta base se desarrolla un análisis acústico y vibracional. Finalmente, se encuentran algunas relaciones entre las propiedades físicas de los materiales, las vibraciones y las características del sonido antes mencionadas.
palabras clave: Timbre, volumen, duración, procesamiento digital de señales, propiedades físicas, tapa armónica
1. Introduction
Guitar is an instrument, which has evolved adapting to musical needs. However, in the late nineteenth century, the standard criteria of the classical guitars were established [1]: the body was elongated, a marked low neck was kept, lighter materials and thinner boxes were used, a system of measurements and proportions based on a geometric logic was established empirically; moreover, a bracing system, also known as brace bars or harmonic system, was implemented and standardized. Since then, Guitar has not had considerable evolution, which has avoided it to successfully be adapted to the demands of the present time [1]. Nowadays, due to the increased size of the venues where guitar concerts are performed, as well as the pieces where guitar is the solo instrument, performers and spectators require guitars with more powerful sound (volume), longer duration of the sound, homogeneity among low, middle and high registers, and a warm and pure timbre. Therefore, the acoustics of different musical instruments have been studied recently. For the particular case of the guitar, studies have been focused on mathematical models that describe the acoustic behaviour [2], simulation using the finite-element method [3, 4] and analysis by holography [5].
Modelling studies have yielded good results that have helped to understand the guitar sound behaviour; but they have been insufficient in terms of materials used in the construction and their influence on the sound. On the other hand, the study by holography has permitted to visualize, directly, vibration modes of the soundboard of the instrument and to measure vibration with high accuracy. However, this technique has as a disadvantage the requirement of very sophisticated lab equipment, with high precision and isolated from external perturbations, which may affect the system. Simulation by the Finite Element Method has focused on reproducing experimental results, achieving a good approximation among "real" behaviour and the simulated one.
In this paper, three physical properties of two of the most used materials in manufacturing soundboards of the Spanish Guitar, i.e., Canadian cedar and German spruce, are analysed and their influence on sound quality (homogeneity among registers, sound power and timbre) correlated. To achieve these goals, first, acoustic characteristics of guitars with soundboard of German spruce and Canadian cedar are determined using techniques of digital signal processing, then, vibration modes of the guitar soundboard and their vibration amplitude is related to the material used in its fabrication, and finally the influence of the physical properties of wood in some of the sonorous qualities of the guitar is established.
2. Experimental procedure
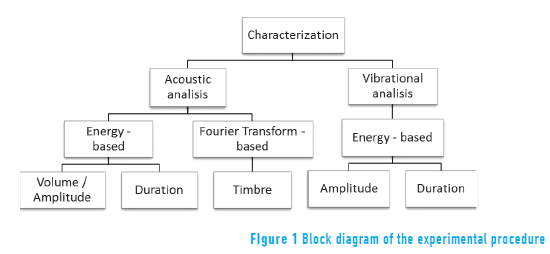
To characterize the material used in the guitar soundboard, two types of analysis were performed, one acoustic and other vibrational. In the former, sound signals were acquired and analysed to determine the volume and sound duration of the instrument. To do this, the concept of signal energy and the Fourier transform were used, respectively. In the latter, vibration signals of the top plate were acquired and processed to determine the amplitude and duration of vibration, and to correlate with its energy. Finally, the data obtained in the two previous analyses were correlated with the physical properties of the material used in the soundboard. A scheme of the experimental procedure is illustrated in the Figure 1.
2.1. Acoustic analysis
Determination of the sound power
To determine the sound power of the guitar, the amplitude of the sound was associated with the energy of each signal. The energy of a continuous-time signal is defined as the area below the square of the magnitude of the signal [6]. Analogously, the energy of a discrete-time signal is defined as the sum of the square of the magnitude of each sample, as shown in Eq. (1) [7]:

Where x[n] is the signal value at time n and Ex is proportional to the actual physical energy of the signal.
Determination of the sound duration
In order to establish the duration of the sound, it was associated with the time where 95% of the total energy of the signals is consumed; this, in order to minimize the influence of background noise; assuming that the sound is sustained until the percentage of the total energy of the signal is completed, from which the remaining 5% is composed of noise.
Determination of sound timbre
The timbre was associated with the frequency content of the signal. Fast Fourier Transform - FFT was used to obtain the frequency spectrum. Then, it was considered that signals with greater number of harmonics correspond to sounds with better timbre feature.
2.2. Vibrational analysis
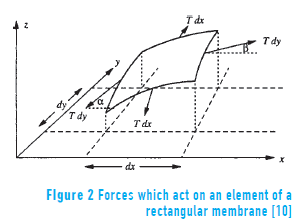
A body vibrates when it experiences alternative changes, so that its particles oscillate synchronously around their equilibrium positions, without them switching place [8]. When an object, such as a string or a plate, vibrates, standing waves are generated in it caused by incident and reflected waves at its borders or edges; these standing waves produce some natural vibration patterns, called normal modes of vibration, in which there is a vibration frequency for each of them [9]. The lower frequency of vibration is known as fundamental. Thus, in a rectangular membrane with dimensions Lx and Ly, fixed edges, and constant superficial tension T at each point (see Figure 2), its simple harmonic motion, or free vibration mode is given by Eq. (2) [10]:

The wave equation describing this system is given by Eq. (3) [10]:

Where c= √(T/σ ) is the velocity of the transverse wave, σ is the area density, and T is the superficial tension. Solving Eq. (3) and taking into account the above mentioned conditions, the modal frequencies are given by Eq. (4):

The vibrational analysis consisted into find the vibration modes of the guitar soundboard. In this case, average vibration was calculated as the average amplitude of vibration at all measured points over the soundboard for each instant of time.
2.3. Influence of material in the loudness
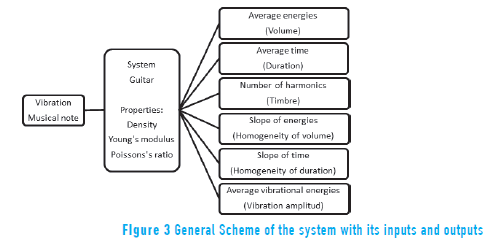
To determine the influence of the material on the sound quality of the instrument, a mechanical system described by physical characteristics was assumed, where its input is a particular musical note, and its output is composed of an acoustic response, which can be decomposed into vectors of average energies (volume), average time (duration), number of harmonics (timbre), slope of energies (homogeneity of volume), slope of time (homogeneity of duration), and average vibrational energies (vibration amplitude), as shown in Figure 3.
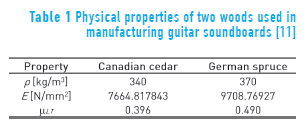
In this study, three physical properties were taken into account: density (ρ), Young's modulus (E) and Poisson's ratio (µ), which provide information about the nature of the studied materials. Density is a property that indicates the relation between mass and volume of a body. Young's modulus is a property that measures the resistance of a solid to change its length; it measures the resistance of a solid to elongate under load. Finally, Poisson's ratio is a parameter which provides a measure of the narrowing in section of a material prism when stretched longitudinally and thinned perpendicular to the stretching direction. Values of these physical properties for wood studied are given in Table 1.
The relation between average vibration, sound intensity, cumulative sums of the energies of their respective signals and the physical properties of the wood are determined by using the linear correlation coefficient, Eq. (5), which expresses the degree of the relation between two features (discrete variables X and Y) of numeric type [12]:

In (5), xm and ym represent the average value of each variable, while xi and yi represent each value. Thus, ρxy takes values between +1 and -1, where +1 signifies 100% of correlation, while -1 means 100% of correlation in phase opposition. A zero value means no correlation and therefore the two variables are considered independent.
3. Results
3.1. Data Collection
In order to acquire sound and vibration data, an acquisition system composed of a microphone WM-582d Pro.2, a set of accelerometers, a data acquisition card, and a graphical interface was developed. In order to control pulsation and synchronization, with the data acquisition algorithms, a servo motor with a plectrum on its axis was used. A blocks diagram of the experimental setup for the signal acquisition system is shown in Figure 4.
The experimental analysis was performed on two groups of guitars, where all aspects that influence the sound were kept as constant as possible, so only influence of material soundboard was considered. The first group was composed of three guitars, built by Luthier Jorge Noguera, two with Canadian cedar (C1 and C2) and one with German spruce (GS) soundboards. The second group was composed of three commercial guitars: Alhambra 1C guitar with German spruce soundboard, Alvaro 55 and Yamaha CG171C guitar with cedar soundboards. New strings (D'Addario EJ27N) were used throughout the experiments.
3.2. Acoustic analysis
Determination of sound power
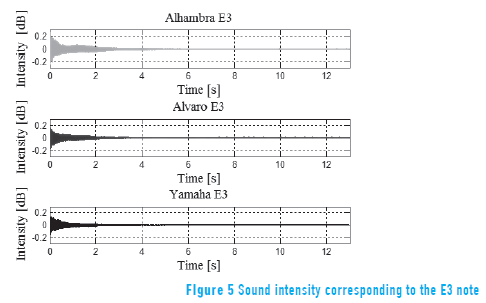
In order to quantify sound power, total energy of each signal was calculated and then associated to the amplitude of the sound; sound signals of three guitars used in this analysis corresponding to the E3 note ("E" of the sixth string) are shown in Figure 5. The fundamental frequency of the E3 note is 82.41 Hz. In our experiments each note was recorded eight times during 13 seconds, where the first six seconds were considered to calculate the sound power, because most of the energy of the signal was located in this section.
The sound (volume) of Alhambra guitar is the highest among this sample as it can be seen from Figure 5. The total energy and average of these sound samples have been placed in Table 2. It is observed that GS, in the first group, and Alhambra, in the second group, have higher average energy values.
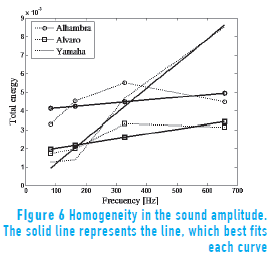
From the data on Table 2, a graph of Total Energy vs. Frequency was plotted and each curve linearized. The slopes values are used to determine how homogeneous in their registers every guitar in terms of amplitude sound was; where curves with slopes closer to zero represent more homogeneity. For the second group of guitars, the graph of Average Total Energy vs. Frequency is shown in Figure 6.
Figure 6 shows that the Alhambra and Alvaro guitars have greater homogeneity in the sound volume.
Determination of the sound duration
As earlier mentioned, to find the sound duration, it was associated with the time where the 95% of the total energy of the signals was consumed; the duration in seconds and its averages, for all sound samples, have been placed in the Table 3 where it is observed that GS and Alhambra guitars have the longest duration, which is expressed in average time values.
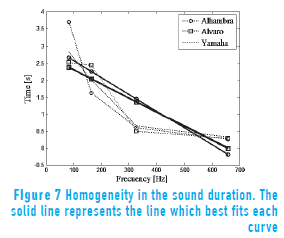
From the data on Table 3, a graph of Duration vs. Frequency was plotted and, as in the previous case, each curve linearized and the slopes values were used to determine how homogeneous in their registers every guitar in terms of duration sound was; and again, curves with slopes closer to zero show greater homogeneity. The graph of Duration vs. Frequency, for the second group of guitars, is shown in Figure 7.
From Figure 7, it can be seen that the Yamaha guitar has the smallest slope, so this guitar has the greatest homogeneity in the sound duration. To this end, it has to be mentioned that the slopes of the Alvaro and Yamaha guitars are similar.
Determination of sound timbre
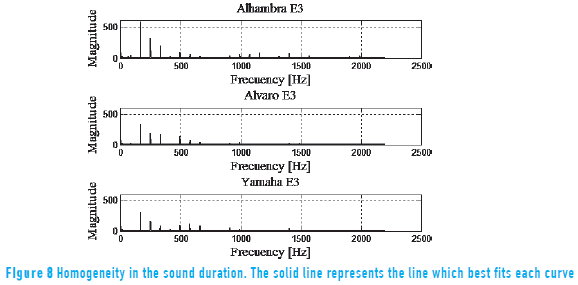
Timbre was associated with the frequency content of the signal; it was considered that the signals with a greater number of harmonics correspond to sounds with better timbre features. This analysis was performed using the Fast Fourier Transform (FFT) and each corresponding frequency spectrum, a window between 82 and 2155 Hz was considered, where the presence of sound harmonics was established by finding peaks at fixed intervals (periodic) according to the fundamental tone, thus, in this analysis, presence of sound harmonics was considered but not its magnitude. Furthermore, the spectral analysis was measured in linear scale. The harmonics in the frequency spectrum of the E3 note, for second group of guitars, are shown in Figure 8 and information about the amount of harmonics present in all analysed notes, for each guitar, is summarised on Table 4.
Table 4 shows that in the first group, C2 has the largest timbre richness, however it is observed that all guitars have a similar frequency spectrum; in this respect, it is important to highlight the fact that all guitars in this group are made for the same manufacturer. On the other hand, in the second group, Alhambra has the greatest timbre richness. It is also noticeable the closeness in the amount of harmonics between of Alvaro and Yamaha guitars which have a common material in their soundboard.
According to the acoustic analysis results, it was observed that in general guitars with German spruce soundboard have larger volume and duration of sound, and guitars with Canadian cedar soundboard have more homogeneous sound.
3.3. Vibrational analysis
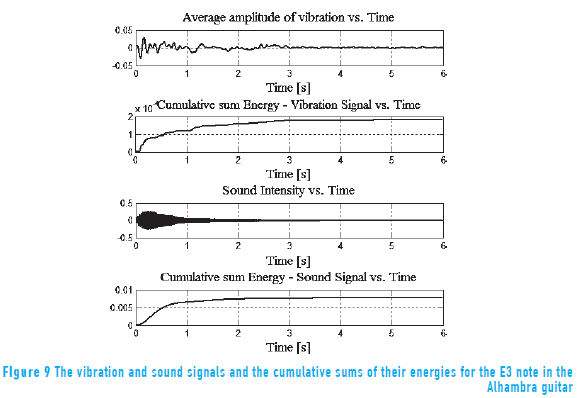
In the vibrational analysis, the average vibration and the cumulative sums of the energies of their respective signals were calculated for each soundboard, and related, using the correlation coefficients, to the sound characteristics. The average vibration was calculated as the average amplitude of vibration in all measured points on the soundboard for each time instant, considering only the first six seconds of each signal in order to minimize the effect of noise. The average amplitude of vibration, the sound signal and the cumulative sum of the energy of the vibration and sound signals in time, for the E3 note in the Alhambra guitar, are shown in Figure 9.
Information about the correlation coefficients, for all notes of each guitar of first and second group, is summarized in Table 5.
From Table 5 it can be said that there is a high degree of correlation between vibration and sound for all guitars, with correlation coefficients ranging from 0.8177 to 0.9976. Thus, as expected, considerable similarity was found between the cumulative sum of the energies and the energy signals of sound confirming the dependency between sound and vibration.
3.4. Influence in loudness
To find the relation between material and sound quality, correlation coefficients relating physical properties and sound characteristics were calculated. There were used, as inputs, vectors of density, Young's modulus and Poisson's ratio corresponding to the physical properties of the system, and as outputs, the obtained responses in terms of average energy (volume), average time (duration), number of harmonics (timbre), slopes of energies (homogeneity volume), slopes of time (homogeneity duration) and average energies of vibration (amplitude vibration), as illustrated in Table 6. The correlation coefficients between them are reported in Table 7.
As a result of this analysis, it was observed that there is high correlation between the physical properties of the wood and the volume, duration, and homogeneity in the sound duration as well as in the vibration amplitude.
4. Conclusions
It was found that the German spruce guitars, used for these experiments, have more volume and sound duration, whereas Canadian cedar guitars are more homogeneous in terms of sound and sound duration. Regarding timbre, changes in material were inconclusive, since similar frequency content can be seen in all the guitars of the first group and differences in the second one are not representative. Therefore, it can be assumed that timbre is related to the geometry of the guitars of this experiment or to the manufacturing process.
To establish a relation between density, Young's modulus, Poisson's ratio and sound, it was used the correlation coefficient as a measure and it was found that volume, sound duration, and vibration amplitude are correlated to the density, the Young's modulus and Poisson's ratio; thus, the denser the wood, the louder and longer the sound, and more amplitude of vibration. The same is observed with the Young's modulus and Poisson's ratio. Similarly to the acoustic analysis, the guitars of test that are made with German spruce have more volume and sound duration than the guitars which are made with Canadian cedar, thus emphasizing the fact that the magnitudes of the German spruce properties are bigger than Canadian cedar properties.
Finally, an experimental explanation is displayed about why many musicians and luthiers prefer guitars with German spruce soundboard and ratifies this material as one of the most suitable for the construction of this important guitar piece. Hence, this invites to return to the old tradition of experimenting with different materials in search of a better sound for the instrument. However, in order to provide more statistical relevance and hence make the results more solid, further research is needed including more guitars, all being from the same brand so aspects such as shape and brace bars are kept constant.
5. Acknowledgment
The authors want to express their gratitude to: the Optics and Laser group at University of Cauca, in whose laboratory this work was done; the radio station at University of Cauca, where the sound tests were performed; Luthier Jorge Noguera, who facilitated his guitars and his workshop to take samples; Camilo and Sebastian Torres Hernandez who lent their guitars (Alvaro and Yamaha) for this study.
6. References
1. C. Seguret. El mundo de las guitarras. 1st ed. Ed. Iberlibro. Barcelona, Spain. 1997. pp. 9-25. [ Links ]
2. E. Bécache, A. Chaigne, G. Derveaux, P. Joly. "Numerical simulation of a guitar". Computers & Structures. Vol. 83. 2005. pp. 107-126. [ Links ]
3. M. Elejabarrieta, C. Santamaría, A. Ezcurra. "Estudio de la tapa armónica de la guitarra por el método de elementos finitos". Formula. Cuadernos de Ciencias Físico-Químicas y Matemáticas. n.o 5. 1999. pp. 7-37. [ Links ]
4. M. Vázquez, E. López. El método de los elementos finitos aplicado al análisis estructural. 1st ed. Ed. Noela. Madrid, Spain. 2001. pp. 1-500. [ Links ]
5. J. Torres. "Análisis modal de la tapa armónica de una guitarra clásica mediante la aplicación de Ansys". Revista electrónica en ingeniería mecánica: ITQu@ntum. Vol. 1. 2003. pp. 11-23. [ Links ]
6. S. Karris. Signals and Systems with MATLAB Applications. 2nd ed. Ed. Orchard Publications Fremont, USA. 2003. pp. 1-598 [ Links ]
7. T. ElAli. Discrete Systems and Digital Signal Processing with MATLAB. 1st ed. Ed. CRC Press. Florida, USA. 2004. pp. 1-667 [ Links ]
8. R. Serway, J. Jewett. Physics for Scientists and Engineers with Modern Physics. 7th ed. Ed. Thomson Learning. Belmont, USA. 2008. pp. 418-426. [ Links ]
9. T. Rossing. The Science of String Instruments. 1st ed. Ed. Springer. New York, USA. 2010. pp. 1-470. [ Links ]
10. T. Rossing, N. Fletcher. The physics of musical instruments. 2nd ed. Ed. Springer-Verlag. New York, USA. 1998. pp. 1-776. [ Links ]
11. The Wood Database. The wood database. Available on: http://www.wood-database.com. Accessed: August 18, 2014. [ Links ]
12. W. Yang, T. Chang, I. Song, Y. Cho, J. Heo, W. Jeon, J. Lee, J. Kim. Signals and Systems with MATLAB. 1st ed. Ed. Springer. Berlin, Germany. 2009. pp. 1-474. [ Links ]


