Serviços Personalizados
Journal
Artigo
Indicadores
-
 Citado por SciELO
 -
 Acessos
Links relacionados
-
 Citado por Google
 -
 Similares em
SciELO
 -
 Similares em Google
Compartilhar
Revista Facultad de Ingeniería Universidad de Antioquia
versão impressa ISSN 0120-6230
Rev.fac.ing.univ. Antioquia no.76 Medellín jul./set. 2015
https://doi.org/10.17533/udea.redin.n76a13
ARTÍCULO ORIGINAL
DOI: 10.17533/udea.redin.n76a13
Analysis of Bender Element signals during triaxial testing
Análisis de señales de Bender Elements durante el ensayo triaxial
Taesik Kim1, David Guillermo Zapata-Medina2*,Carlos Alberto Vega-Posada3
1School of Urban and Civil Engineering, Hongik University. C. P. 121-791. Seoul, South Korea.
2Departamento de Ingeniería Civil, Universidad Nacional de Colombia (sede Medellín). Calle 59 A N.° 63-20. C. P. 050034. Medellín, Colombia.
3Facultad de Ingeniería, Universidad de Antioquia. Calle 67 N.° 53-108. A. A. 1226. Medellín, Colombia.
* Corresponding author: David Guillermo Zapata Medina, e-mail: dgzapata@unal.edu.co
DOI: 10.17533/udea.redin.n76a06
ISSN 0120-6230
e-ISSN 2422-2844
(Received March 02, 2015; accepted June 03, 2015)
ABSTRACT
This paper presents and discusses three different wave propagation methods used to evaluate the shear wave velocities, Vs, computed from Bender Element (BE) analyses during triaxial testing. The peak-to-peak travel time, cross-correlation and phase-delay approaches were employed to calculate Vs and to determine the error in wave propagation velocities when time domain and frequency domain methods are implemented. The results obtained from vertical BE tests conducted on clay specimens indicates that, when the proper BE testing conditions are met, the differences in Vs calculated using the three methods were within ±2%. This error is small and indicates that the peak-to-peak method, the simplest and fastest time domain approach, can be employed as a straight forward method to determine shear wave velocities.
Keywords: Bender elements, shear wave velocity, time domain, frequency domain
RESUMEN
Este artículo presenta y discute tres métodos para evaluar la velocidad de la onda cortante, Vs, con base en el análisis de señales de "Bender Elements" (BE) tomadas durante ensayos triaxiales. Los métodos de tiempo de viaje de pico-a-pico (peak-to-peak travel time), correlación cruzada (cross-correlation) y fase retrasada (phase-delay) fueron empleados para calcular Vs, y determinar el error en la velocidad de propagación de la onda cuando se realizan los análisis en el dominio del tiempo y en el dominio de la frecuencia. Los resultados obtenidos de los ensayos Bender Element indican que cuando las condiciones apropiadas se cumplen, las diferencias entre los valores calculados de Vs usando los tres métodos varían entre ±2%. Este error es pequeño y está entre los rangos aceptables indicando que el método de tiempo de viaje pico-a-pico, el cual es el método más sencillo y rápido de aplicar, puede ser empleado como un método directo para calcular la velocidad de la onda cortante.
Palabras clave: Bender elements, velocidad de la onda a cortante, dominio del tiempo, dominio de la frecuencia
1. Introduction
Soil is an incrementally non-linear material. As such, stiffness varies widely as a function of strain and direction of loading. Furthermore, greater emphasis has been placed on soil behavior at small strains (<0.1 %) since [1] suggested that strains developed in situ under working load conditions were smaller than previously thought. Sophisticated measurement systems and devices have become an essential component of advanced laboratory testing to define soil responses at the very small-strain or "elastic" range (εsh < 0.001%), and to investigate the non-linear soil behavior exhibited by most natural soils [2]. The use of internal instrumentation such as on-specimen LVDTs allows for shear strain measurements as small as 0.002%. Dynamic measuring devices such as Bender Elements (BE) provide a simple technique to determine the elastic (very small-strain) shear stiffness. Bender elements [3], in which an elastic modulus is derived based on the wave propagation theory, enhance the capabilities of triaxial testing devices such that one can measure both "dynamic" and "static" parameters of soils subjected to axisymmetric stress conditions. Because the BEs induce very small strains which keep the specimen intact during loading, synchronous measurement of elastic and elastic-plastic responses during "static" loading is possible [4-6].
Bender elements are thin piezoceramic electro-mechanical transducers capable of transmitting and receiving signals, and thus can measure wave velocities in a sample when supplied on both sides. BEs consist of two piezoceramic plates bonded together in series or parallel with a brass electrode plate in between [7]. They convert electrical energy into mechanical movement and vice versa. BEs are typically mounted in the base pedestal and top cap of a triaxial cell. When excited by an input voltage, the source element bends, emitting a horizontally polarized wave that travels through the soil sample. The wave motion causes the receiver element to mechanically vibrate, inducing a voltage signal that is captured by an oscilloscope or high-speed digital data acquisition system. The shear wave velocity, Vs , is calculated by determining the travel distance, d, and the travel time, tBE. The travel length has been traditionally standardized as the tip-to-tip distance between BE source and receiver and its determination is straightforward. Changes in the specimen's length and diameter are easily tracked during triaxial testing via internal dynamic actuator displacement gauges and on-specimen radial LVDTs, respectively. On the other hand, the determination of the travel time is troublesome and has been a subject of great controversy [8-16].
This paper presents typical results obtained from vertical BE tests conducted on Bootlegger Cove Formation clay specimens under triaxial testing conditions to calculate their respective shear wave propagation velocities. Two time domain methods (peak-to-peak travel time and cross-correlation) and a frequency domain approach (phase-delay) are presented and fully discussed to show that the error in determining propagation velocity using a frequency domain approach is smaller than those associated with time domain methods. However, when the proper BE testing conditions are met, the differences in shear wave velocity calculated using the three different methods were within ±2%, indicating that one could employ a straight forward method such as peak-to-peak to determine shear wave velocities.
2. Laboratory equipment, soil samples and testing procedures
An electromechanical dynamic triaxial testing system manufactured by GDS Instruments Ltd was combined with internal instrumentation to conduct the experiments. It included a submersible load cell and three subminiature LVDTs to measure responses at very small strains (< 0.1%).
It also minimizes the effects of complicated boundary responses and eliminates errors caused by apparatus compliance, sample seating and sample tilting. In addition to internal instrumentation, Bender Elements (BEs) fixed to the bottom pedestal and top cap were used to measure travel times, determine propagation velocities and estimate shear stiffness at very small strains during the experiments. Bender elements were connected to an external control box that supplies the transducer power, performs the signal conditioning, amplifies the source signal, and switches between circuits (i.e. P and S wave testing). The digital-to-analogue conversion of the source signal and the analogue-to-digital conversion of the receiver signal are carried out by the high-speed data acquisition system. The BEs and corresponding data acquisition system (high-speed, 16-bit resolution and 200 kHz sampling rate) were manufactured by GDS Instruments Ltd. BEs are made of piezoelectric ceramic bimorphs bounded into a titanium insert which reduces their total weight. The BEs were 11-mm-wide, 1-mm-thick and extended about 1 mm into the soil specimens. Detailed specifications of the employed triaxial apparatus, internal instrumentation and bender element equipment are provided by [17-20].
Thin-walled Shelby tube samples of Bootlegger Cove Formation (BCF) clay were extracted from the Port of Anchorage, Alaska. According to the Unified Soil Classification System, this soil is classified as a low to medium plasticity (CL) clay with medium to stiff consistency. It presents a Plastic Limit, PL, of about 20%, a liquid limit, LL, between 35% and 50% and natural water contents averaging 30%. Oedometer test results indicated a maximum past pressure, σ'p , of approximately 525 kPa and that the material is heavily overconsolidated.
Soil samples were removed from Shelby tubes by making two longitudinal cuts located 180º apart over the entire length of the 30-in.-long tubes and separating the split tube. After sample extraction, specimens were hand trimmed to approximately 70 mm in diameter and 150 mm in length, the internal instrumentation was installed and the specimens mounted on the triaxial cell. For each specimen, the residual effective stress, p'r, was measured and saturation under a constant confinement stress equal to p'r performed. Subsequently, specimens were reconsolidated to their in situ effective stress state under Ko conditions, subjected to a drained creep period and sheared in different modes and stress path directions. BE tests were conducted synchronously throughout the entire testing sequence. A detailed description of the employed BCF clay and testing procedures can be found in [20-23].
3. Bender Elements and methods of analyses
3.1. Background
The bender element method, as any other wave propagation method, are based on several simplifying assumptions, including: (i) the soil behaves as an ideal linear elastic continuum (i.e., the strains induced in the soil by the source are very small); (ii) the body waves imposed by the source to the soil are plane shear waves (i.e., only transverse motion travels with the velocity of the shear wave); and (iii) the soil sample acts as an infinite medium (i.e., all the waves reflected from the boundaries of the sample arrive later at the receiver than the direct wave originating from the transmitter).
There is little evidence to support that the soil behaves as an ideal linear elastic continuum during BE testing since it is virtually impossible to measure the actual strain at the contact between the soil and the bender element. In addition, waves generated by a point source are in reality spherical rather than planar (as assumed) and exhibit a very complex propagation and polarization pattern making theoretically impossible the separation of the body wave into shear and compression components. [24, 25] showed how different estimates of travel time that should be equal under the plane wave assumption may differ by up to 50% of their average value. This is equivalent to a 100% uncertainty in modulus determination. Finally, laboratory specimens have finite dimensions and are far from being an infinite medium. Closed form analytical solutions based on infinite medium assumption are not applicable due to the complex boundary conditions of a triaxial sample equipped with BEs.
However, non-linearity during BE testing does not seem to be important as strain levels, measured via laser interferometry techniques with resolutions as small as 0.0008 µm [26, 27], are likely less than 10–5 and suggest no accumulation of strains due to the induced dynamic loading. It leaves the dispersion-inducing phenomena as the biggest source of uncertainty during BE testing. [28-30] among others have theoretically and empirically approached this problem. They found that the intrinsic attenuation of seismic waves separates the near-field coupled compression and shear waves from the far-field pure shear waves, and recommended values of d/λs > 2, where λs is the wavelength of the input signal, to avoid overestimation of the shear wave velocities due to near-field effects. In addition, the development of finite element methods allows the evaluation of wave propagation and reflection phenomena during BE testing. By using a full 3D model of a triaxial specimen with BEs, [31] found by comparing contours of strain at distinct time instants that the direct shear wave reaches the receiver first and there are not reflections from the sides of the mesh. In general, bender elements should perform adequately and yield reliable results provided that the controllable conditions discussed above are met.
3.2. Bender Element input and output signals
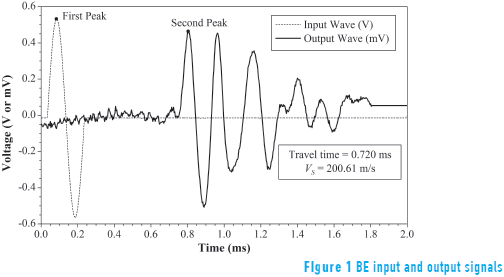
BE tests were conducted by inducing a single-pulse sinusoidal input signal with an amplitude of 14 Volts and a frequency of 5 kHz meeting the requirements of d/λs > 2. A minimum of 10 output signals were stacked for each BE test and then averaged to minimize electrical noise. Figure 1 shows the BE input and obtained averaged output signals for a typical BE test conducted at the end of the reconsolidation stage of a BCF clay specimen. At the moment of BE testing, the travel distance, d, calculated as the tip-to-tip distant between BE source and receiver was estimated to be 144.44 mm.
3.3. Peak-to-peak approach
The peak-to-peak approach is the simplest and fastest time domain method to calculate wave travel times. It simply identifies the time span between the major first peaks of the input and output waveforms. Typical input and output signals obtained from single pulse sinusoidal bender element tests are presented in Figure 1, as well as the identified first and second picks necessary to calculate the wave travel times.
When using time domain methods, the sampling frequency must be high enough to overcome the problems resulting from low time resolution. Herein, BE input and output signals were recorded at a sampling frequency of 300 kHz. It corresponds to a time resolution of 0.0033 ms. With this time resolution, the propagation velocity can be resolved to approximately ±0.7 m/s, which corresponds to approximately ±0.7 MPa in the determination of maximum shear moduli for the average dimensions and properties of the tested specimens. As explained by [17, 32], the signals contain noise and the waveforms peaks can shift back and forth for different BE shots conducted at the same sample conditions, implying that the propagation velocity and maximum shear modulus determination are vulnerable to noise and resulting errors can be greater than ±0.7 m/s and ±0.7 MPa, respectively.
3.4. Cross-correlation approach
Cross-correlation is an alternative signal processing method applied to BE soil testing [16] that eliminates subjective "picking" of travel times. The cross-correlation function CCxy(t) is a measure of the degree of correlation or similarity of two signals X(T) and Y(T) as a function of a time-lag applied to one of them. It is defined as (Eq. 1):

where Tr is the time record, X(T) is the signal at the receiver, Y(T) is the driving signal, and t is the time shift between the signals.
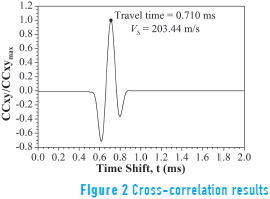
The basic assumption in the cross-correlation method is that the travel time is equal to the time shift tcc corresponding to the maximum value of Eq. (1). Thus, tcc represents the travel time between the BE source and receiver. Figure 2 shows the cross-correlation of the signals presented in Figure 1 normalized with respect to the maximum absolute value, CCxymax, and gives the cross-correlation travel times.
The cross-correlation approach is also sensitive to error. [33] recommended the use of this method only if near-field effects are not pronounced and the two receivers possess very similar transfer functions. When the two signals have different frequencies, the cross-correlation function CCxy(t) might have several maximum absolute values and the identification of the time shift or travel time is confused. Additionally, the cross-correlation is also a time domain approach and the limitations with regard to the maximum BE sampling frequency and time resolution discussed for the peak-to-peak method also affect the final results.
3.5. Phase-delay approach
The phase-delay analysis of continuous signals has long been used to estimate shear wave velocities in different mediums and applications [34, 35]. The application of this method to the analysis of BE tests was first introduced by [16] to avoid the determination of wave travel times using only subjective visual inspection of the BE input and output signals.
The phase-delay method calculates the wave propagation velocity, V(f), based on the phase of the cross-power spectrum Φ(f) [16, 34] as (Eq. 2):

where λ is the wavelength and the cross-power spectrum is given by (Eq. 3):

In Eq. (3), Lx(f) is the linear spectrum of X(T) calculated via the Fast Fourier Transform, Lx(f) = FFT[X(T)], and L*y(f) is the complex conjugate of the linear spectrum of Y(T) .
The shear wave propagation velocities based on the phase-delay approach are computed by:
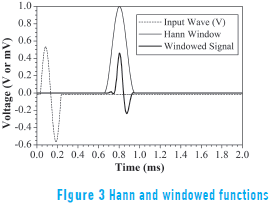
1. Using a Hann window function [36], the unnecessary peaks were removed. The window function was centered on the first received peak of the raw data and an appropriate width selected to remove unnecessary peaks in the signal (see Figure 3).
2. The frequency resolution of the window functions obtained in step 1 was enhanced by applying "zero-padding." This enhancement adds zeroes at the signal tail to increase the number of data points in the time domain. The frequency resolution is determined as (Eq. 4):

where N and Δt are the number of data points and sampling interval, respectively. For the signals analyzed herein, the total sampling time and Δt were 2 ms and 1/300 ms, respectively. This procedure yields 600 data points and Δf = 500 Hz for vertically propagating waves. In this analysis, the frequency resolution of the window functions was enhanced to 0.1 Hz by increasing the number of data points to 3 x 10⁶.
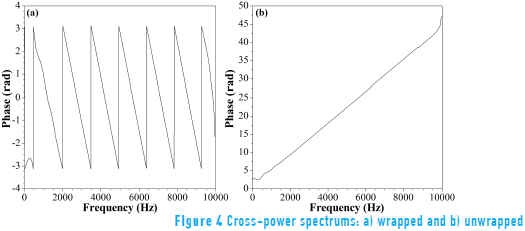
3. The enhanced frequency window functions obtained in step 2 were changed from the time domain to the frequency domain via FFT and the cross-power spectrums calculated using Eq. (3). Additionally, the cross-power spectrums were unwrapped. The unwrapping algorithm added appropriate multiples of period to each phase input to reconstruct the signal's original phase values. Figure 4 shows the wrapped and unwrapped cross-power spectrums for the BE signals shown on Figure 1.
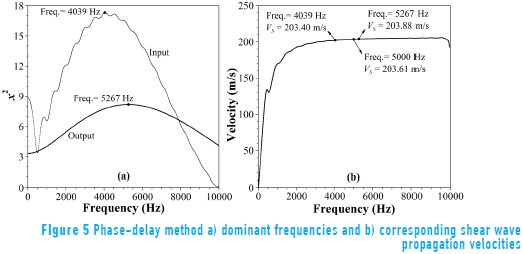
4. The propagation velocities were calculated as a function of frequency using Eq. (2). Figure 5b presents the velocity dispersion curve. Also included in Figure 5 are the dominant frequencies of the input and output BE signals and their corresponding propagation velocity values.
The phase-delay method was developed for the analysis of continuous signals. However, the waves in a BE tests are transient and dispersive in nature. The application of the phase-delay method to BEs assumes that the system is partially dispersive and that the cross-power spectrum can be approximated by a straight line [16, 37, 38]. The results presented in Figure 4, suggest that the low dispersion assumption is valid over the range of frequencies for the BE signals analyzed herein.
Another consequence of the transient and dispersive nature of the BE signals is that their dominant frequency changes from the time to the frequency domains (see Figure 5). Hence, a single propagation velocity cannot be determined using the phase-delay method. Only a range of propagation velocities corresponding to the interest range of frequencies can be obtained. However, when using a frequency domain approach, the analysis is less sensitive to noise and near-field effects than for manual travel time picks, it was noted that the possible induced error in the determination of shear wave propagation velocities via the phase-delay method (approximately ±0.5 m/s) is just a little less than the error induced by using the peak-to-peak approach (±0.7 m/s). Additionally, differences in propagation velocities determined by the three methods discussed herein are within ±2%. It indicates that as long as the proper BE testing conditions are met, one could employ a straight forward method such as peak-to-peak to determine shear wave velocities.
4. Summary and conclusions
This paper presented two time domain methods (peak-to-peak travel time and cross-correlation) and a frequency domain approach (phase-delay) to estimate shear wave propagation velocities based on Bender Elements tests performed under triaxial testing conditions. The analysis procedures for each method were presented and their advantages and limitations discussed. From the information presented herein, the following can be concluded:
1. In general, bender elements should perform adequately and yield reliable results provided that d/λs > 2, to avoid overestimation of the shear wave velocities due to near-field effects. In the case of using time domain approaches, the sampling frequency must be high enough to overcome the problems resulting from low time resolution.
2. A single propagation velocity cannot be determined using the phase-delay method. Only a range of propagation velocities corresponding to the interest range of frequencies can be obtained. However, the error in determining propagation velocity using a frequency domain approach is smaller than those associated with time domain methods as the subjective "picking" of travel times is eliminated.
3. When the proper BE testing conditions are met, the differences in shear wave velocity calculated using the three different methods were within ±2%, indicating that one could employ a straight forward method such as peak-to-peak to determine shear wave velocities.
5. Acknowledgments
This research was carried out at Northwestern University while the authors were graduate research assistants in the Department of Civil and Environmental Engineering. The authors wish to thank Dr. Richard Finno, professor at Northwestern University, for his valuable comments and encouragement.
6. References
1. J. Burland, "Ninth Laurits Bjerrum Memorial Lecture: 'Small is beautiful'-the stiffness of soils at small strains". Canadian Geotechnical Journal. Vol. 26. 1989. pp. 499-516. [ Links ]
2. F. Tatsuoka, S. Shibuya, R. Kuwano. Advanced laboratory stress-strain testing of geomaterials. Ed. Taylor & Francis. 2001. pp. 1-340. [ Links ]
3. D. Shirley, L. Hampton. "Shear-wave measurements in laboratory sediments". Journal of the Acoustical Society of America. Vol. 63. 1978. pp. 607-613. [ Links ]
4. L. Callisto, G. Calabresi. "Mechanical behaviour of a natural soft clay". Géotechnique. Vol. 48. 1998. pp. 495-513. [ Links ]
5. L. Callisto, S. Rampello. "Shear strength and small-strain stiffness of a natural clay under general stress conditions". Géotechnique. Vol. 52. 2002. pp. 547-560. [ Links ]
6. R. Kuwano, R. Jardine. "On the applicability of cross-anisotropic elasticity to granular materials at very small strains". Géotechnique. Vol. 52. 2002. pp. 727-749. [ Links ]
7. R. Dyvik, C. Madshus. Laboratory measurements of Gmax using bender elements. Proceedings of the ASCE Annual Convention: Advances in the Art of Testing Soils under Cyclic Conditions. Detroit, USA. 1985. pp. 186-196. [ Links ]
8. C. Abbiss. "Shear-wave measurements of the elasticity of the ground". Géotechnique. Vol. 31. 1981. pp. 91-104. [ Links ]
9. G. Alvarado, M. Coop. "On the performance of bender elements in triaxial tests". Géotechnique. Vol. 62. 2012. pp. 1-17. [ Links ]
10. J. Blewett, I. Blewett, P. Woodward. "Measurement of shear-wave velocity using phase-sensitive detection techniques". Canadian Geotechnical Journal. Vol. 36. 1999. pp. 934-939. [ Links ]
11. J. Bonal, S. Donohue, C. McNally. "Wavelet analysis of bender element signals". Géotechnique. Vol. 62. 2012. pp. 243-252. [ Links ]
12. M. Fam, C. Santamarina. "Study of geoprocesses with complementary mechanical and electromagnetic-wave measurements in an oedometer". Geotechnical Testing Journal. Vol. 18. 1995. pp. 307-314. [ Links ]
13. V. Jovicic, M. Coop, M. Simic. "Objective criteria for determining Gmax from bender element tests". Géotechnique. Vol. 46. 1996. pp. 357-362. [ Links ]
14. J. Lee, J. Santamarina. "Bender Elements: Performance and Signal Interpretation". Journal of Geotechnical and Geoenvironmental Engineering. Vol. 131. 2005. pp. 1063-1070. [ Links ]
15. E. Leong, S. Yeo, H. Rahardjo. "Measuring shear wave velocity using bender elements". Geotechnical Testing Journal. Vol. 28. 2005. pp. 488-498. [ Links ]
16. G. Viggiani, J. Atkinson. "Interpretation of bender element tests". Geotechnique. Vol. 45. 1995. pp. 149-154. [ Links ]
17. T. Kim. Incrementally nonlinear responses of soft Chicago glacial clays. PhD Thesis, Northwestern University. Evanston, USA. 2011. pp. 1-194. [ Links ]
18. C. Vega. Evaluation of liquefaction susceptibility of clean sands after blast densification. PhD Thesis, Northwestern University. Evanston, USA. 2012. pp. 1-210. [ Links ]
19. C. Vega, R. Finno, D. Zapata. "Effect of gas on the mechanical behavior of medium-dense sands". Journal of Geotechnical and Geoenvironmental Engineering. Vol. 140. 2014. pp. 1-10. [ Links ]
20. D. Zapata. Evaluation of dynamic soil parameter changes due to construction–induced stresses. PhD Thesis, Northwestern University. Evanston, USA. 2012. pp. 1-260. [ Links ]
21. R. Finno, D. Zapata. "Effects of construction-induced stresses on dynamic soil parameters of Bootlegger Cove clays". Journal of Geotechnical and Geoenvironmental Engineering. Vol. 140. 2014. pp. 1-12. [ Links ]
22. D. Zapata, R. Finno. "Defining Y2 yielding from cyclic triaxial tests". Geotechnical Testing Journal. Vol. 36. 2013. pp. 660-669. [ Links ]
23. D. Zapata, R. Finno, C. Vega. "Stress history and sampling disturbance effects on monotonic and cyclic responses of overconsolidated Bootlegger Cove clays". Canadian Geotechnical Journal. Vol. 51. 2014. pp. 599-609. [ Links ]
24. M. Arroyo, P. Greening, D. Muir. "An estimate of uncertainty in current laboratory pulse test practice". Rivista Italiana di Geotecnica. Vol. 37. 2003. pp. 33–51. [ Links ]
25. M. Arroyo, D. Muir, P. Greening. "Source near-field effects and pulse tests in soil samples". Géotechnique. Vol. 53. 2003. pp. 337-345. [ Links ]
26. G. Heymann, C. Clayton, G. Reed. "Laser interferometry to evaluate the performance of local displacement transducers". Géotechnique. Vol. 47. 1997. pp. 399-405. [ Links ]
27. G. Heymann, C. Clayton, G. Reed. "Triaxial ultra-small strain measurements using laser interferometry". Geotechnical Testing Journal. Vol. 28. 2005. pp. 544-552. [ Links ]
28. E. Brignoli, M. Gotti, K. Stokoe. "Measurement of shear waves in laboratory specimens by means of piezoelectric transducers". Geotechnical Testing Journal. Vol. 19. 1996. pp. 384-397. [ Links ]
29. I. Sánchez, J. Roesset, K. Stokoe. Analytical studies of body wave propagation and attenuation. Geotechnical Engineering Rep. GR86-15, The University of Texas at Austin. Austin, USA. 1986. pp. 1-272. [ Links ]
30. G. Viggiani. Small strain stiffness of fine grained soils. PhD Thesis, City University London. London, UK. 1992. pp. 1-288. [ Links ]
31. V. Jovicic. The measurement and interpretation of small strain stiffness of soils. PhD Thesis, City University London. London, UK. 1997. pp. 1-276. [ Links ]
32. T. Kim, R. Finno. "Anisotropy evolution and irrecoverable deformation in triaxial stress probes". Journal of Geotechnical and Geoenvironmental Engineering. Vol. 138. 2012. pp. 155-165. [ Links ]
33. Y. Wang, K. Lo, W. Yan, X. Dong. "Measurement biases in the bender element test". Journal of Geotechnical and Geoenvironmental Engineering. Vol. 133. 2007. pp. 564-574. [ Links ]
34. E. Kaarsberg. "Elastic-wave velocity-measurements in rocks and other materials by phase-delay methods". Geophysics. Vol. 40. 1975. pp. 955-960. [ Links ]
35. W. Sachse, Y. Pao. "On the determination of phase and group velocities of dispersive waves in solids". Journal of Applied Physics. Vol. 49. 1978. pp. 4320-4327. [ Links ]
36. R. Blackman, J. Tukey. The measurement of power spectra from the point of view of communications engineering. 1st ed. Ed. Dover Publications. New York, USA. 1959. pp. 1-190. [ Links ]
37. M. Arroyo, P. Greening. "Phase and amplitude responses associated with the measurement of shear-wave velocity in sand by bender elements: Discussion". Canadian Geotechnical Journal. Vol. 39. 2002. pp. 483-484. [ Links ]
38. P. Greening, D. Nash. "Frequency domain determination of Go using bender elements". Geotechnical Testing Journal. Vol. 27. 2004. pp. 288-294. [ Links ]


