Serviços Personalizados
Journal
Artigo
Indicadores
-
 Citado por SciELO
 -
 Acessos
Links relacionados
-
 Citado por Google
 -
 Similares em
SciELO
 -
 Similares em Google
Compartilhar
Revista Facultad de Ingeniería Universidad de Antioquia
versão impressa ISSN 0120-6230
Rev.fac.ing.univ. Antioquia no.76 Medellín jul./set. 2015
https://doi.org/10.17533/udea.redin.n76a14
ARTÍCULO ORIGINAL
DOI: 10.17533/udea.redin.n76a14
Prony's method implementation for slow wave identification of electroenterogram signals
Aplicación del método Prony para la identificación de la onda lenta en señales del Electroenterograma
José de Jesús Moreno-Vázquez*, Aldo Rafael Sartorius-Castellanos, Raúl Antonio-Ortiz, Marcia Lorena Hernández-Nieto, Antonia Zamudio-Radilla
Departamento de Ingeniería Electrónica, Instituto Tecnológico de Minatitlán. Blvd. Institutos Tecnológicos s/n Col. Buena Vista Norte. C. P. 96848. Minatitlán, México.
* Corresponding author: José de Jesús Moreno Vázquez, e-mail: jjmv@itmina.edu.mx
DOI: 10.17533/udea.redin.n76a06
ISSN 0120-6230
e-ISSN 2422-2844
(Received December 04, 2014; accepted June 03, 2015)
ABSTRACT
The aim of the present paper is to identify the slow wave (SW) of the bioelectric activity of the small bowel recorded at the abdominal surface (electroenterogram) to detect which internal record is detected at the abdominal surface. Prony's method was used in this study. Internal and external recordings were acquired simultaneously from five beagle dogs (in 10 recording sessions). Akaike's Information Criterion (AIC) was used to obtain the optimal order of Prony's method, and was calculated for each minute of abdominal and internal myoelectric signal. The optimal order was of p = 29 and q = 1, with a frequency resolution of ∆f = 0.06 Hz. The maximum frequency peak on the signal spectrum was found around 0.3 Hz. Prony's method analysis showed that the slow wave can be detected on the abdominal recordings of the intestinal myoelectrical activity without breathing interference and statistically can determine the internal record that corresponds to the record at the abdominal surface.
Keywords: Prony's method, small bowel, electroenterogram, myoelectrical activity, slow wave
RESUMEN
El objetivo del presente trabajo es identificar la onda lenta (OL) de la actividad bioeléctrica del intestino delgado registrada en la superficie abdominal (electroenterograma), para detectar que registro interno se detecta en la superficie abdominal. En este estudio se utilizó el método de Prony. Los registros internos y externos fueron adquiridos de manera simultánea de cinco perros Beagle (de 10 sesiones de registro). El Criterio de Información de Akaike (CIA) fue utilizado para la obtención de los órdenes óptimos del método de Prony, y se aplicó a cada minuto de longitud de señal mioeléctrica tanto abdominal como interna. El orden óptimo encontrado fue de p = 29 y q = 1, con una resolución de frecuencia ∆f = 0.06 Hz. La frecuencia de los picos máximos de la señal del espectro se encontró en torno a 0.3 Hz. El Análisis del método de Prony muestra que la OL puede detectarse en los registros abdominales de la actividad mioeléctrica intestinal sin interferencias respiratorias y estadísticamente puede determinarse el registro interno que se corresponde con el registro en la superficie abdominal.
Palabras clave: Método de Prony, intestino delgado, electroenterograma, actividad mioeléctrica, onda lenta
1. Introduction
The study of intestinal motility is an important field in gastroenterology, since abnormal motility patterns are related to several intestinal pathologies [1], such as intestinal ischemia, irritable bowel syndrome, mechanical obstruction, bacterial overgrowth, and paralytic ileus. Therefore, identifying the bowel segment affected by any disease would help shorten observation periods and make more accurate and less subjective medical diagnosis. Most methods of studying bowel motility are invasive. Only manometric techniques are used in clinical diagnosis. However, this method entails several technical and physiological drawbacks [2]. As the relationship between bowel pressure and myoelectric signal of bowel smooth muscle has been demonstrated and is widely accepted [3], myoelectric techniques can be an alternative to the problem of monitoring intestinal motility; in the case of the small bowel the technique is known as electroenterogram (EEnG). However, the application of internal myoelectric techniques for clinical diagnostic purposes is restrained because surgery is required for the implantation of the electrodes. Surface EEnG recording could be a noninvasive alternative for monitoring intestinal motility [4-6]. Nowadays, noninvasive techniques based on intestinal ultrasounds, bioelectromagnetism, and myoelectric recordings are being developed [7]. None of these methods can yet be used in clinical diagnosis, either because they require high-cost equipment, or because they are still in the experimental stage. The identification of bowel slow wave (SW) activity at the abdominal surface has been accomplished by other authors [4, 6, 8]. In dogs, it has been proven that the dominant frequency of the external myoelectrical intestinal signal coincides with the repetition rate of the internal intestinal SW both in physiological conditions [4] and in pathological conditions [8]. Nevertheless, the clinical application of surface EEnG recording still poses a series of difficulties: Surface-recorded myoelectrical signals are very weak [5, 8], due to spatial filtering and the insulating effects of the abdominal layers [8]. In addition, external EEnG recording is contaminated by strong physiological interferences: cardiac activity, respiration, very low-frequency components, and movement artifacts. The main sources of interference in the SW range are respiration and very low frequency components [9].
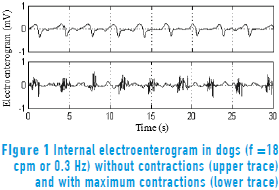
Figure 1 shows the EEnG recorded with bipolar electrodes implanted in the small bowel serous layer. The EEnG is the result of SW (upper trace) and sporadic spike bursts (SB: lower trace). The SW is always present and does not represent intestinal motility. The SW frequency (SWf) of the intestinal signal is around 18 cycles per minute (cpm) in dogs. SBs are generated only when the smooth muscle cells contract and locate at the SW plateau.
To obtain the SWf of the external EEnG signal, some researchers have used nonparametric spectral estimation techniques [4, 5]. These studies have showed the utility of these techniques for the identification of the intestinal SW activity on the abdominal surface, and it has been determined that the energy associated with the intestinal SW is concentrated between 0.15 and 2 Hz in the animal model [4]. Nevertheless, these techniques present some disadvantages: the selection of the window length to be used in the analysis has an important repercussion on the frequency resolution and on the stationarity of the signal. The limited frequency resolution of nonparametric techniques can be partially overcome by parametric spectral analysis. Parametric techniques based on autoregressive models [8, 10, 11] or on autoregressive moving average models [12, 13] have also been used to obtain the SWf of the external signal. The advantage of these techniques with respect to the nonparametric techniques is that they enable determination of the dominant frequency of the signal with better frequency resolution, even with a shorter window of analysis. The application of Prony's method usually applies to power systems [14, 15]. However, only a few studies have been performed in the biomedical area using the Prony's method, but not in the gastrointestinal area [16, 17]. Prony's analysis can be an alternative to identifying the SWf on the abdominal surface EEnG recording. Prony's analysis is a viable technique to model a linear sum of complex exponentials to signals that are uniformly sampled [18]. Spectrum Prony's estimator has better resolution than the nonparametric models when using the same amount of data [19]. Therefore, Prony's method can be very attractive to processing signals from various areas, such as electrogastrogram (EGG), electroencephalogram (EEG), and, of course, electroenterogram (EEnG).
The aim of the present study is to identify the slow wave on internal and external EEnG recordings using Prony's method, in order to determine what is the internal recording point of the small bowel that produces this signal at the abdominal surface. Then, identifying the bowel segment affected by any disease would help shorten observation periods and make medical diagnosis more accurate and less subjective with a noninvasive method.
2. Material and methods
Five beagle dogs were studied in 10 recording sessions. Six internal bipolar electrodes were implanted along the small bowel, at the following points: duodenum, Treitz angle, jejunum (located at a distance of 45 cm, 90 cm, and 135 cm from the Treitz angle), and ileum level. One monopolar contact electrode was placed at the abdominal surface for external EEnG recording. Recording sessions were carried out with animals in a fasting state of more than 16 hours. Each session implied the recording of more than 95 minutes of combined signal (external and internal) with a total number of 1565 minutes per analyzed point of measurement. Signals were amplified and bandpass filtered between 0.05 Hz and 30 Hz. The bioelectric recording in this study was obtained with a sampling frequency fm = 100 Hz. Each signal minute was simultaneously recorded with both surface and internal EEnG. Signals were digitally filtered with a low pass filter: Butterworth with cutoff frequency of 2 Hz, in order to analyze the signal in the frequency range of the slow wave energy and reduce the effect of "aliasing" and decimated by 25; i.e., the sampling frequency was 4 Hz.
One of the most important features of a spectral estimator is its frequency resolution. The resolution of the Prony (p, q) method was obtained by means of the generation of a signal composed of two sine signals with different frequencies (w1, w2) and the addition of white noise. Frequency resolution (Df = 0.06 Hz) was calculated as the minimum detectable difference between w1 and w2. The selection of the orders is important; the response of the model depends on it. The fact that a criterion provides a minimum error based on the chosen orders does not indicate that the ideal order has been obtained. AIC minimum error was calculated for each of the minutes from different recording points. Different orders were obtained for each of the analyzed minutes. This means that, depending on the morphology of the analyzed signal, it will be the resulting order. The best choice of Prony's model order is not usually known, so it is necessary to estimate several model orders. If the order chosen is too low, some spectral components are not estimated, while an order that is too high introduces extra components not present in the original signal. Thus, model order selection is a trade-off between increased resolution and decreased variance in the estimated spectrum [20].
Therefore, it was necessary to study the performance of order selection criteria to obtain the optimal order of Prony's method to represent the electroenterogram signal. This study was carried out obtaining the appropriated model order given by the Akaike's Information Criterion (AIC) for electroenterogram signal from different recording points. The model order of selection criteria is based on the concepts of mathematical statistics. The order of p and q for the Prony model was calculated by Eq. (1).

where s 2p is the estimated variance of the prediction error for the p and q orders, and N is the number of sample data on 1 minute of electroenterogram recording. The order p and q is the model order, and the one for which the AIC is minimum.
The Prony's function implements the Prony analysis for time-domain design of IIR filters [21]. Prony's method is a technique for modeling sampled data as a linear combination of exponentials. The parameters of the exponentials are determined by a least squares fit to the data.
Let Eq. (2) be a transfer function of discrete time system H(z).

where H(z) is the z-transform of h[n], q is the number of zeroes, and p is the number of poles. Performing cross-multiplication with the output of the denominator of the transfer function, we can rewrite Eq. (2) and obtain Eq. (3).

Eq. (3) is the z-transform of the discrete-time convolution, and it can be written as a matrix multiplication, considering h[n] = x[n] for n = 0,1 ... N. The matrix is given by Eq. (4) [21].

The ap and bq coefficients are obtained by the partition into two parts of the matrix Eq. (4) such that taking only the lower partition of the matrix, Eq. (5) is given by:

Expanding Eq. (5), this can be written as Eq. (6).

where Eq. (7) can be obtained from Eq. (6).
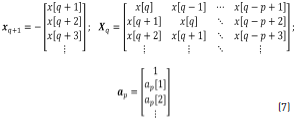
Solutions for the coefficients vector ap at the denominator are obtained through Eq. (8), taking the pseudo-inverse of Xq to solve for ap:

Once ap is determined, it can be substituted back into the top partition of Eq. (4), shown below (Eq. 9), to find the numerator coefficients, bq:

where Eq. (10) can be obtained from Eq. (9).
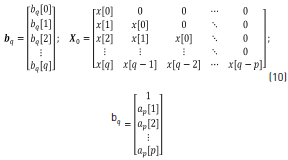
Solving for bp, Eq. (9), the numerator coefficient vectors are obtained through Eq. (11).

Using z = ej2pf in Eq. (2) and substituting values of Eqs. (8) and (11), the Prony spectrum estimation method is given by Eq. (12). Every minute was analyzed with Prony model using order p and q, respectively.

On the other hand, the global order p parameter was calculated at each recording point (OGpPRmax), obtained from the average orders of the maximum value (Pmaxi) of each session for each recording point by using Eq. (13), where s=10, which corresponds to session numbers evaluated.

Furthermore, the global order total p of the maximum values (OGpTmax) of all recording points was calculated using Eq. (14).

where OGpTmax is the global total average of all the OGpPRmax calculated at each recording point and PR=7, which corresponds to the recording point number of each of the sessions. In addition, the global minimum order p value of each recording point (OGpPRmin) was obtained using Eq. (15).

where OGpPRmin is the average value of the orders of the minimum value (Pmini) at each session for each recording point and the total global order p of the minimum values (OGpTmin) is given by Eq. (16).

where OGpTmin is the global total average of all the OGpPRmin calculated at each recording point.
The order q parameters were calculated in similar form, only replacing p with q in Eqs. (13) to (16).
3. Results and discussion
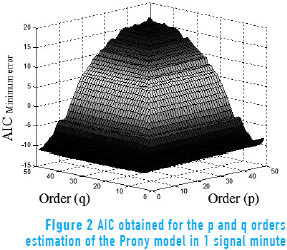
Figure 2 shows the evaluation of AIC for the order estimation of the Prony model on 1 minute of electroenterogram recording, with p and q order values from 1 to 50. The plots were obtained for every analyzed minute of the 10 sessions to observe the relationship between the orders and the minimum error that produces the criteria; in this case, an order of p = 30 and q = 1 was obtained.
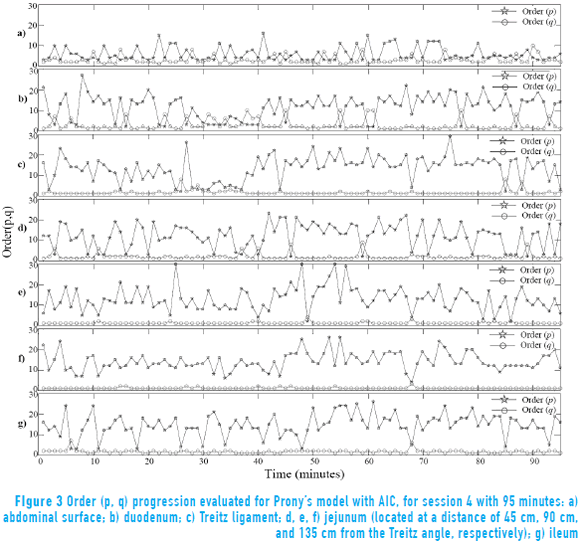
Figure 3 shows order progression obtained in each of the analyzed minutes with the AIC in recording session 4 (this was carried out for all recording sessions). The results show that the order estimation changes for each of 95 minutes in all the points of measurement in external and internal signals. Moreover, it is observed that the order q does not present changes and remains around 1. However, the order p exhibits changes between 1 and 30 while the measurement point at the abdominal surface exhibits few variations in the order value.
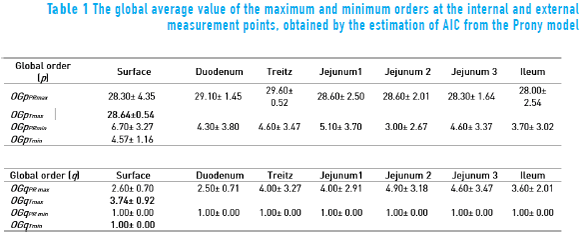
The global evaluation of all sessions of the maximum and minimum orders p and q is shown in Table 1. It is possible to see the total global order p and q of maximum values (OGpTmax) and (OGqTmax), respectively, are p ≈ 29 and q ≈ 4, while the total global order p and q of minimum (OGpTmin) and (OGqTmin), respectively, are around p ≈ 5 and q ≈ 1. The selection of the criterion was carried out based on which presented the maximum order in all the points of measurement, resulting in the AIC. Thus, in the Prony method analysis, the order used was p = 29 and q = 1 to estimate the power spectrum of the serosal signal with a better resolution.
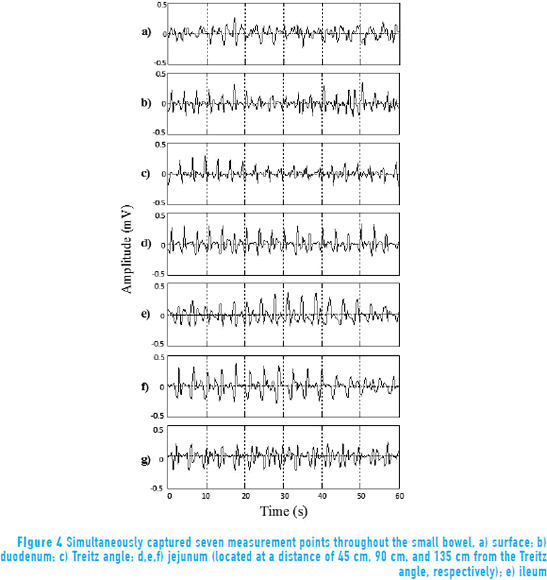
Figure 4 shows the signal captured simultaneously from internal and external points of measurement. The Prony (29,1) model was used to evaluate every minute of each session, considering only 1-minute lengths in analyzing the performance of the SW. The frequency of the maximum peaks on the spectrum of the signal can be found near 0.3 Hz.
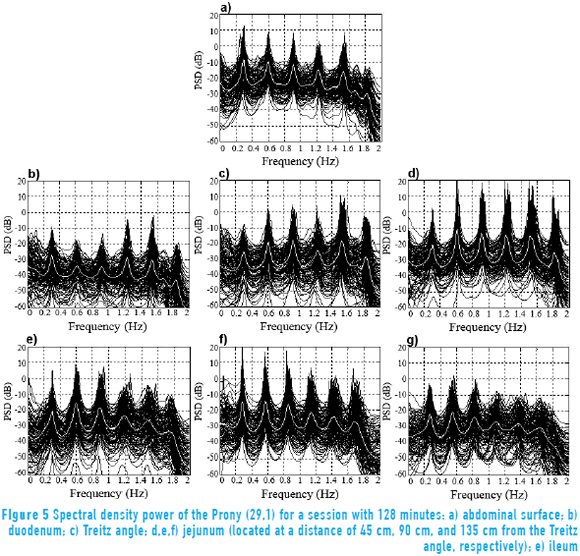
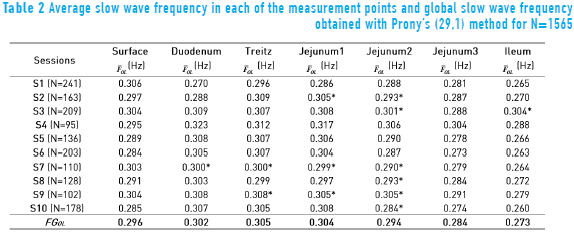
Figure 5 shows the response of the Prony's model for each of the 128 minutes in a session at the abdominal surface and each of the internal measurement points. All the minutes are overlapped (black trace) with the purpose of observing the performance of the SW in each of the points of record of the small bowel. Average power spectral density (PSD) of all session minutes is also observed (white trace) for each recording point. Table 2 shows the average slow wave frequency ( ) obtained in each of the points of record, as well as global frequency (FGOL) for all sessions. Furthermore, recordings that do not present statistically significant differences among the records of surface and internal recording are marked with an asterisk (*). It is observed that most of the measured point record values of jejunum 2 do not show statistically significant differences with the
  recording point values of the abdominal surface. However, there are other measurement points where the
  values do not show statistically significant differences with the surface record. The frequencies for which the closest relation was observed between the external and internal signal PSD corresponded to the SW of the electroenterogram, making it possible to observe that the SW was largely reflected in the abdominal surface recording.
The frequency domain representation provides knowledge about the frequency components that influence EEnG signals, so most experimental studies for the identification of the component of SW signal from EEnG in animals and humans have used spectral analysis techniques [4, 5, 22, 23]. However, the nonparametric technique provides a real energy spectrum to analyze energy distribution. This technique has the disadvantage that due to window length, cause spectral spreading effect, and to provide high resolution, demands a large amount of data that can affect the stationary of the signal. Furthermore, using short data segments, the spectral resolution would be low [24]. The parametric techniques can determine the SWf with better frequency resolution with short data recordings [8, 10, 25, 26], but the energy spectrum obtained is not true. Therefore, it would not be possible to study the energy distribution. In this work, a Prony's spectral estimator was chosen, as it is used to identify the SWf component of the associated spectral peak. The average power spectral density (PSD) overlapping in each session showed frequency components around 0.3 Hz (18 cpm); this frequency is the SW that has been reported by other authors in internal [3, 27] and external records [4, 8, 28]. Furthermore, the results showed that Prony's method detected the most energy around the slow wave frequency (0.3 Hz) and the first harmonic (0.6 Hz), which could also be used to indicate the presence of the SW, mainly at the abdominal surface, having the advantage of being far from the frequency components that might cause interference. The Power Spectral Densities that were obtained for internal EEnG and at the abdominal surface showed that besides the harmonics of the SWf, there were also spectral peaks under the frequency of 0.15 Hz. In this frequency range, the existing components can be due to modulation of the amplitude of the SW [29], as well as residual frequency possibly remaining due to high pass filter (fc = 0.05 Hz). Even this could also be due to antral contractions [30]. Therefore, to lessen the effect of this low frequency, it was determined that the range of the study was above 0.15 Hz. This value is similar to that used by other authors who have used 0.12 Hz [31] and 0.13 Hz [9] or 0.16 Hz [4, 8]. The noninvasive detection of SWf has already been achieved under normal conditions in humans [5, 23, 32] and normal and pathological conditions in animals [8, 33]. This could have an important diagnostic value. Most authors have determined that the slow wave that is produced somewhere in the bowel can be present at the abdominal surface, but the internal recording point of the small bowel that produces this signal has not been determined. The statistical results for this study show that signals recorded at the abdominal surface correspond to jejunum 2 (located at a distance of 90 cm from the Treitz angle), because it is the internal recording point that does not present statistically significantly differences from the abdominal surface records in most sessions.
4. Conclusion
In this paper, the Prony model was studied for the spectral analysis of electroenterogram. The Akaike's Information Criterion (AIC) for the selection of the order of Prony model was analyzed, and the order used in the model was p = 29 and q = 1. The present study shows that it is possible to detect the SW component of the electroenterogram at the abdominal surface around 0.3 Hz, which is the pacemaker of the intestinal activity, through abdominal surface recording. Furthermore, Prony analysis shows that there is no breath interference, and statistical results show that signals recorded at the abdominal surface correspond to the jejunum 2 segment (located at a distance of 90 cm from the Treitz angle). Sixty percent of the recording sessions in jejunum 2 showed that the signals do not present significant differences from those in the abdominal surface recording. Abdominal recording of the EEnG could be a useful noninvasive tool to assess the small bowel activity. Slow wave energy of the EEnG, which is omnipresent in internal signal, is strongly reflected in abdominal surface recordings. Furthermore, identifying the bowel segment affected by any disease would help shorten observation periods and make medical diagnosis more accurate and less subjective.
5. Acknowledgment
Surgical and recording sessions were carried out in the Veterinarian Unit Research Centre of "La Fe" University Hospital in Valencia (Spain), assisted by C.Vila, PhD.
6. References
1. M. Camilleri, W. Hasler, H. Parkman, E. Quigley, E. Soffer. "Measurement of gastrointestinal motility in the gi laboratory". Gastroenterology. Vol. 115. 1998. pp. 747-762. [ Links ]
2. E. Quigley, J. Donovan, M. Lane, T. Gallagher. "Antroduodenal manometry: usefulness and limitations as an outpatient study". Dig. Dis. Sci. Vol. 37. 1992. pp. 20-28. [ Links ]
3. J. Mart, J. Ponce. "Noninvasive measurement and analysis of intestinal myoelectrical, activity using surface electrodes". IEEE Transactions on Biomedical Engineering. Vol. 52. 2005. pp. 983-991. [ Links ]
5. J. Chen, S. Schirmer, R. Mccallum. "Measurement of electric activity of the human small intestine using surface electrodes". IEEE Transactions on Biomedical Engineering. Vol. 40. 1993. pp. 598-602. [ Links ]
6. J. García, V. Zena, G. Prats, Y. Ye. "Enhancement of non-invasive recording of electroenterogram by means of a flexible array of concentric ring electrodes". Ann Biomed Eng. Vol. 42. 2014. pp. 651-660. [ Links ]
7. J. Moreno, A. Sartorius, M. Hernández, A. Zamudio. "El EEnG como método alternativo no invasivo en el registro de la actividad intestinal". Epistemus. n.o 16. 2014. pp. 55-63. [ Links ]
8. L. Bradshaw, S. Allos, J. Wikswo, W. Richards. "Correlation and comparison of magnetic and electric detection of small intestinal electrical activity". Am. J. Physiol. Vol. 272. 1997. pp. 1159-1167. [ Links ]
9. Z. Lin, Z. Chen, J. De. "Time-frequency representation of the electrogastrogram – application of the exponential distribution". IEEE Transaction on Biomedical Engineering. Vol. 41. 1994. pp. 267-275. [ Links ]
10. J. Moreno, J. Martínez, J. García, J. Ponce. Autoregressive spectral analysis of electroenterogram (EEnG) for basic electric rhythm identification. Proceedings of the 25th Annual International Conference of the IEEE Engineering in Medicine and Biology Society. Cancún, Mexico. 2003. pp. 2539-2542. [ Links ]
11. S. Seidel, L. Bradshaw, J. Ladipo, J. Wikswo, W. Richards. "Noninvasive detection of ischemic bowel". J. Vasc. Surg. Vol. 30. 1999. pp. 309-319. [ Links ]
12. J. Levy, J. Harris, J. Chen, D. Sapoznikov, B. Riley, W. Nuez, A. Khaskelberg. "Electrogastrographic norms in children: toward the development of standard methods, reproducible results, and reliable normative data". J. Pediatr.Gastroenterol. Nutr. Vol. 33. 2001. pp. 455-461. [ Links ]
13. J. Chen, J. Vandewalle, W. Sansen, G. Vantrappen, J. Janssens. "Adaptive spectral-analysis of cutaneous electrogastric signals using autoregressive moving average modeling". Med. Biol. Eng Comput. Vol. 28. 1990. pp. 531-536. [ Links ]
14. M. Reza, M. Ciobotaru, V. Agelidis. Power quality analysis using piecewise adaptive Prony's Method. Proceedings of the IEEE International Conference on Industrial Technology (ICIT). Athens, Greece. 2012. pp. 926-931. [ Links ]
15. S. Nam, S. Kang, L. Jing, S. Kang, S. Min. A novel method based on Prony analysis for fundamental frequency estimation in power systems. Proceedings of the IEEE TENCON Spring Conference. Sydney, Australia. 2013. pp. 327-331. [ Links ]
16. V. Sajith, A. Kumar. Identification of moderate to chronic diabetic neuropathic conditions of simulated median nerve response using prony's method. Proceedings of the IEEE EMBS Conference on Biomedical Engineering and Sciences (IECBES). Langkawi, Malaysia. 2012. pp. 508-513. [ Links ]
17. M. Bani, Y. Kadah, M. Rasmy, F. El. Electrocardiogram signals identification for cardiac arrhythmias using prony's method and neural network. Proceedings of the Annual International Conference of the IEEE Engineering in Medicine and Biology Society. Minneapolis, USA. 2009. pp. 1893-1896. [ Links ]
18. M. Corinthios, "z-Domain counterpart to Prony's method for exponential-sinusoidal decomposition". IET Signal Process. Vol. 4. 2010. pp. 537-547. [ Links ]
19. E. Moraes, L. Toncon, O. Baffa, A. Oba, R. Wakai, A. Leuthold. "Adaptive, autoregressive spectral estimation for analysis of electrical signals of gastric origin". Physiological Measurement. Vol. 24. 2003. pp. 91-106. [ Links ]
20. S. Kay. Modern Spectral Estimation: Theory and Application. 1st ed. Ed. Prentice-Hall. New Jersey, USA. 1988. pp. 1-543. [ Links ]
21. T. Parks, C. Burrus. Digital Filter Design (Topics in Digital Signal Processing). 1st ed. Ed. Wiley. New York, USA. 1987. pp. 1-368. [ Links ]
22. S. Somarajan, S. Cassilly, C. Obioha, L. Bradshaw, W. Richards. "Noninvasive biomagnetic detection of isolated ischemic bowel segments". IEEE Transactions on Biomedical Engineering. Vol. 60. 2013. pp. 1677-1684. [ Links ]
23. G. Prats, J. García, J. Martínez, Y. Ye. "Active concentric ring electrode for non-invasive detection of intestinal myoelectric signals". Medical Engineering & Physics. Vol. 33. 2011. pp. 446-455. [ Links ]
24. S. Kay, S. Marple. "Spectrum analysis-A modern perspective". Proceedings of the IEEE. Vol. 69. 1981. pp. 1380-1419. [ Links ]
25. L. Bradshaw, J. Wikswo. Autoregressive and eigenfrequency spectral analysis of magnetoenterographic signals. Proceedings of the IEEE 17th Annual Conference Engineering in Medicine and Biology Society. Montreal, Canada. 1995. pp. 871-872. [ Links ]
26. J. Chen, J. Vandewalle, W. Sansen, G. Vantrappen, J. Janssens. "Adaptive spectral analysis of cutaneous electrogastric signals using autoregressive moving average modelling". Medical and Biological Engineering and Computing. Vol. 28. 1990. pp. 531-536. [ Links ]
27. J. Szurszewski. "A Migrating Electric Complex of the Canine Small Intestine". Am. J. Physiol. Vol. 217. 1969. pp. 1757-1763. [ Links ]
28. J. Martínez, F. Saiz, J. Silvestre, J. Ponce. Identification of the slow wave of small bowel myoelectrical activity by surface recording. Proceedings of the 23rd Annual International Conference of the IEEE Engineering in Medicine and Biology Society. Istanbul, Turkey. 2001. pp. 2024-2027. [ Links ]
29. R. Smallwood, D. Linkens, C. Stoddard. "Analysis and modelling of amplitude changes in human duodenal slow waves". Clinical Physics and Physiological Measurement. Vol. 1. 1980. pp. 47-58. [ Links ]
30. E. Schee, J. Grashuis. "Contraction-related, low-frequency components in canine electrogastrographic signals". Am. J. Physiol. Vol. 245. 1983. pp. 470-475. [ Links ]
31. C. Pfister, J. Hamilton, N. Nagel, P. Bass, J. Webster, W. Tompkins. "Use of spectral analysis in the detection of frequency differences in the electrogastrograms of normal and diabetic subjects". IEEE Transactions on Biomedical Engineering. Vol. 35. 1988. pp. 935-941. [ Links ]
32. J. García, Y. Ye, E. Avalos, V. Zena, G. Prats. Identification of intestinal pacemaker frequency through time-frequency ridge analysis of surface EEnG. Proceedings of the 36th Annual International Conference of the IEEE Engineering in Medicine and Biology Society. Chicago, USA. 2014. pp. 2334-2337. [ Links ]
33. J. Erickson, C. Obioha, A. Goodale, L. Bradshaw, W. Richards. "Detection of small bowel slow-wave frequencies from noninvasive biomagnetic measurements". IEEE Transactions on Biomedical Engineering. Vol. 56. 2009. pp. 2181-2189. [ Links ]


