Serviços Personalizados
Journal
Artigo
Indicadores
-
 Citado por SciELO
 -
 Acessos
Links relacionados
-
 Citado por Google
 -
 Similares em
SciELO
 -
 Similares em Google
Compartilhar
Revista Facultad de Ingeniería Universidad de Antioquia
versão impressa ISSN 0120-6230
Rev.fac.ing.univ. Antioquia no.79 Medellín abr./jun. 2016
https://doi.org/10.17533/udea.redin.n79a12
ARTÍCULO ORIGINAL
DOI: 10.17533/udea.redin.n79a12
Determination of accident-prone road sections using quantile regression
Determinación de tramos críticos a accidentes usando regresión cuantil
Thomas Edison Guerrero-Barbosa1*, Shirley Yaritza Santiago-Palacio
Departamento de Ingeniería Civil, Universidad Francisco de Paula Santander Ocaña. Vía Acolsure Sede el Algodonal. C. P. 546552 Ocaña, Colombia.
* Corresponding author: Thomas Edison Guerrero Barbosa, e-mail: teguerrerob@ufpso.edu.co
DOI: 10.17533/udea.redin.n79a12
(Received September 10, 2015; accepted February 24, 2016)
ABSTRACT
The accurate identification of dangerous areas with high accident rates allowing governmental agencies responsible for improving road safety to properly allocate investment in critically accident prone road sections. Given this immediate need, this study aims to determine which segments are prone to accidents as well as the development of a hazard ranking of the accident prone road sections located within the city limits of Ocaña, Colombia, through the use of quantile regression. Based on the estimated model corresponding to quantile 95, it was possible to establish causal relationships between the frequency of accidents and characteristics such as length of the road section, width of the roadway, number of lanes, number of intersections, average daily traffic and average speed. The results indicate a total of seven accident prone road sections, for which a hazard ranking was established.
Keywords: Quantile regression, accident prone location, hazard ranking, accidents, road safety
RESUMEN
La identificación acertada de sitios peligrosos a accidentalidad permite a las entidades gubernamentales, encargadas de realizar mejoras a la seguridad vial, una adecuada destinación de las inversiones a los tramos viales verdaderamente críticos; dada esta necesidad inmediata, la presente investigación se enfoca en determinar los tramos propensos a accidentes y la posterior elaboración de un ranking de peligrosidad efectuado a los tramos críticos encontrados en el perímetro urbano de Ocaña (Colombia), utilizando Regresión Cuantil (RC). A partir del modelo estimado correspondiente al cuantil 95 fue posible establecer relaciones de causalidad entre características como longitud del tramo vial, ancho de calzada, número de carriles, número de intersecciones, tránsito promedio diario y velocidad media con la frecuencia de accidentes, determinándose un total de 7 tramos críticos a los cuales se les estableció un ranking de peligrosidad.
Palabras clave: Regresión cuantil, tramo crítico, ranking de peligrosidad, accidentes, seguridad vial
1. Introduction
The World Health Organization (WHO) confirms the growing epidemic of traffic accidents in most regions around the world and expresses concern with regard to the fact that globally this phenomenon results in the death of 1.2 million people between the ages of 20-50, in addition to non-fatal injuries [1]. Colombia is no stranger to this situation. According to statistics reported by the National Institute for Legal Medicine and Forensic Sciences (INMLCF, Spanish acronym), in Colombia, a traffic accident occurs every 2.5 minutes, somebody is injured every 10 minutes and someone dies every 69 minutes. This means that each day, 20 people die and 144 are injured as a result of poor road safety [2]. These statistics demonstrate the public health problem faced by Colombia, which is represented through a high economic impact. In fact, research has shown that injuries resulting from traffic accidents have an approximate cost of USD $11,370 million per year [3].
In view of these alarming statistics, in recent years, the Colombian government has declared road safety to be a part of State policy, which has facilitated the implementation of a series of measures with regard to institutions, budget, regulations and research, in order to decrease the effects of traffic accidents on the population. Furthermore, the Department of Transportation took measures to strengthen public policy regarding road safety through the creation of the National Road Safety Observatory, the National Road Safety Agency, and an investment of USD $10 million over four years through CONPES 3764 [4].
Despite government investment through budgets allotted exclusively to road safety, rates of traffic accidents remain high. However, it is important to keep in mind that road sections may present false positives (i.e., when a relatively safe area has a high rate of accidents) as well as false negatives (i.e., when an accident prone or dangerous area does not have a high rate of accidents), which result in a decrease in opportunities for efficient road safety investment [5]. For this reason, it is necessary that investment is made in road sections that are truly accident prone in terms of the rate of traffic accidents. Therefore, this study aims to determine the segments that are most prone to accidents and which have the lowest proportion of false negatives and false positives, in order to subsequently establish a hazard ranking of the accident prone road sections located within the city limits of the city of Ocaña, Colombia, through the use of Quantile Regression (QR).
This document has five sections. Background information regarding QR is described in Section 2. Section 3 describes the methodological approach used, the characteristics of the data and the variable taken into account. Section 4 contains an analysis of the interpretation of the results and in Section 5 the conclusions of the study are presented.
2. Background information
The QR model is used in different areas of expertise, such as ecology, economics, computer science, epidemiology, statistics, environmental science, among others, especially when the data tends to have asymmetric distributions and presents significant heterogeneity [6]. QR is a regression that aims to reproduce the highest amount of variations within a population, based on the set of covariables taken into account in the model, as evidenced by the accident count. QR adequately controls the effect of the excessive presence of outliers, guaranteeing better alignment and robustness, as well as the possibility of estimating any quantile, making it possible to assess extreme values in a population.
The concept of QR was first introduced by [7], in which they pose solutions to a simple minimization of the weights of the sum of absolute residuals. The approach poses an optimization problem based on the solution through linear programming [8, 9].
Unlike other regression methods, such as, for example, ordinary least squares and general linear models, among others, QR aims to estimate both conditional means and other quantiles of the response variable, making it possible to assess extreme values in a population, as QR is closely related to the statistical technique of absolute minimum error [6, 10].
QR is not widely used to determine accident-prone road sections (also known as hotspots, blackspots, sites with promise, high risk locations, and accident prone locations). [6] states that this approach is favorable as compared to other traditional methods of regression, as it does not imply any distribution assumption with regard to error and is less sensitive to violations of distribution assumptions. In addition, QR can provide estimations for different levels of quantiles, and is capable of capturing the heterogeneity in the data and offering a more accurate description of the tendencies.
Recently, the results reported by [11] identify the effects of the covariables on the different quantiles and identify the possible accident prone areas of road sections, crossings, crosswalks, ramps, among others, instead of the population mean as used by the majority of methods in practice. [12] present the QR method as a an alternative approach to address the difficulties that exist with respect to the heterogeneity of the data in the determination of the accident prone road sections, given that combining data from different locations and in different time periods causes the estimations of the parameters to be unstable and less efficient. The findings provide information with regard to the effects of variables such as traffic volumes, geometric and operational characteristics and traffic control on the occurrence of accidents, demonstrating how estimations of conditional quantiles are more informative than the conditional mean. Such is a characteristic of conditional quantiles, as they are equivariant with respect to non-decreasing transformations of the dependent variable. The conditional mean, however, does not possess such a characteristic [7].
In another study done by [13], the importance of models assessed using QR with a semiparametric approach is demonstrated, as the accident count allows researchers to relax the restrictions with regard to the distribution function of the frequency of accidents, which results in a more robust estimation and more details on the marginal effects through the conditional distribution of the response variable and provides more solid and precise predictions with regard to the accident count. However, the methodology is questionable as [14, 15] pointed out that the QR for count is more appropriate for modeling crash frequency because crash count is a non-negative integer.
3. Materials and Methods
3.1. Methodological approach
The definition of quantile affirms that given a p ∈ (0,1) belonging to a random variable, X, with a cumulative distribution function of the form F(x) = P(X ≤ x), the pth quantile is defined by Eq. (1).

The 50th percentile is the most well known and corresponds to the median of the distribution, which represents the value of the central position variable in a set of ordered data [7].
If there is a sample of random and independent observations of a variable {x1,x2,…xi,…,xn}, it is possible to estimate the distribution function that compares the number of observations that are less than or equal to the value of the interest and the total number of the observations through empirical distribution of the sample. The quantile Q(p) may be solved by minimizing the weighted average of the sample whose values are greater than or equal to Q(p) and less than Q(p). This minimization problem follows the model presented in Eq. (2) [8]:

The term Q(p) corresponds to the pth quantile and may be expressed as a linear function of the parameters of interest by using Eq. (3).

Where p takes a value between 0 and 1, representing the percentiles of interest; Q(p) is the dependent variable and corresponds to the expected number of accidents for the percentile p; β is a vector of the dimension k of the unknown parameters of the covariables Xi,which represents the specific characteristics of the study segments (length, traffic volume, speed, among others); subscript i corresponds to the identification of each of the study segments; the term εi covers all other aspects not taken into account in the modeling as well as any measurement errors. By minimizing the sum of absolute weighted residuals, the β regression parameters are estimated by solving the optimization problem presented in Eq. (4). This expression may be solved as a linear programming problem through various optimization methods [16].

3.2. Data and variables used
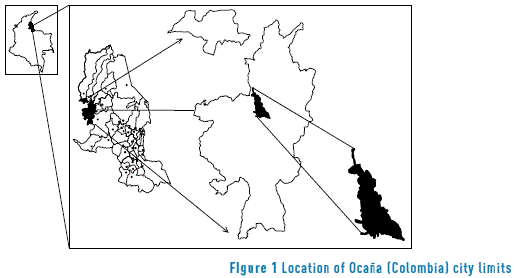
A database of accident records was created, which contains records of a total of 1,913 accidents that occurred on the roads of the city limits of the city of Ocaña, Colombia (see Figure 1) between January 1, 2007 and January 31, 2014. In addition, this database has a road inventory which contains geometric and operating characteristics of each of the completed segments. In the particular case of this study, 163 road sections were analyzed.
Unlike other studies that use accident records submitted by a public roads administration [13, 17], in this study, accident records were obtained from the National Police of Colombia and other entities such as the Volunteer Firefighters' Corps and/or Civil Defense, Ocaña Branch which, given the way the information is collected, may entail some disadvantages [18, 19]. Accident records must be requested through these entities, as at the time in which an accident occurs, the National Police of Colombia is responsible for tracing the events in order to determine the legal and criminal liabilities arising from such an event, while entities such as the Volunteer Firefighters' Corps and/or Civil Defense, Ocaña Branch, besides registering the accident, they are responsible for providing assistance and medical attention to the victims, who are taken to the city´s network of clinics and hospitals.
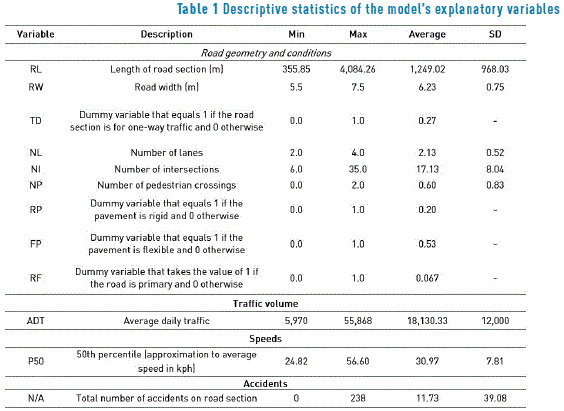
The dependent variable corresponds to the total number of accidents that occur within the segment i, while the explanatory variables are divided into three groups: the first group contains the factors associated with road geometry and conditions, the second group corresponds to the traffic volumes and lastly, the third group includes the speeds. There is evidence that supports the use of QR with variables associated with road geometry and conditions and traffic volume [6, 11-13, 20], in the case of speeds, refer to [21]. The statistical summary of the variables and its description can be seen in Table 1.
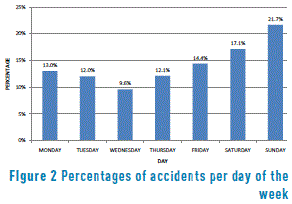
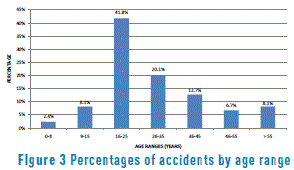
Between the years 2007 and 2011, there was a 78% increase in the number of accidents in the city, with less than an 8% variation between the years 2012 and 2013. The period with the highest number of accidents during the day is from 6:00 PM to 9:00 PM. The days in which the highest numbers of accidents are recorded are Fridays, Saturdays, and Sundays, which may possibly be associated with an increase in the consumption of alcoholic beverages, while the lowest number of accidents takes place on Wednesdays (see Figure 2). The population most affected by accidents is persons between the ages of 16 and 25 years old (see Figure 3).
4. Results
4.1. Estimation and analysis of the model
After evaluating a variety of models by combining the variables for different quantiles in the STATA software, the estimated coefficients are shown in Table 2, which corresponds to the 95th percentile. Additionally, the Standard Error (SE) and the Confidence Interval (CI) for the 95th percentile and the t value as a statistical measurement are shown for the variables that make up the model.
For the presented model, all the variables were significant (with the exception of the Intercept), given that the t values (in absolute value) greater than or equal to 1.96 indicate that the coefficient is significantly different from zero for a confidence level of 95%.
Among the group of variables associated with road geometry and conditions, RL had the greatest statistical significance with a t value equal to 33.72. As expected, as the RL parameter was positive, this indicates an increase in the number of accidents as this variable increases, which is consistent with the reports by [13, 22, 23]. Similar behavior indicates the RW variable, i.e., the wider the roadway, the more interaction there is between the vehicles, which increases the probability of collisions; such a result is consistent with [24, 25].
The variable associated with traffic volume ADT had the greatest significance among the variables that make up the model, confirming the hypothesis that the increase in the rates of motorization has a high impact on the occurrence of accidents, which has been widely proven in other studies [6, 12, 13]. However, its effect is minimal, given the high value of the mean and the maximum peaks associated with this variable (mean of 18,130.33 and a maximum of 55,868).
The variables NL and NI were negative in the estimation, especially NL. This suggests that the addition of a lane to sections with higher a higher frequency of accidents will result in improvements in terms of road safety, decreasing the number of accidents. Curiously, the NL variable had the greatest weight in the model, which may possibly be linked to the low variability of this parameter within the dataset (SD=0.52), as such are typical values for the urban road network [13]. The negative effect on the frequency of accidents associated with the NI variable may be due to the fact that in countries such as a Colombia where cars drive on the right-hand side (i.e., the steering wheel is on the left), drivers usually do not stop in the outer lane (right) in order to make right turns that involve a change in direction at intersections; such a situation does not imply a risk of collision with oncoming vehicles. The opposite effect was reported by [26], as in Malaysia cars drive in the left lane, which causes more conflict between vehicles, since drivers usually stop in the outer lane (i.e., the lane that is closest to oncoming traffic) when they intend to make a right turn in an entry lane in the opposite direction. Therefore, they are more likely to be in a collision with a vehicle driving the in the oncoming lane.
In addition, the statistical significance of the P50 estimator for the accident occurrence model is evident. However, the negative parameter indicates that an increase in the average speed of the study sections will result in a decrease in accidents, which is not a common result, even though it is consistent with the results reported by [22, 27]. One of the possible causes of this result is that the SD of the average speed of the road sections is very low, therefore the speed range of those sections is also low. In the case study, the SD value for the P50 variable is 7.81 kph, which is consistent with the evidence reported by [22] which shows SD variations for the speed parameter of 13.83 kph, 7.00 kph and 6.42 kph for the years 2007, 2008 and 2009, respectively. The rest of the variables shown in Table 1 were not taken into account in the model shown in Table 2, has they have no statistical significance.
4.2. Determination of accident prone road sections and a hazard ranking
The criteria to determine if a section is accident-prone is based on the proposition of [6], which consists of a comparison between the values of the observed accidents and the values of the modeled accidents. Sections were classified as accident prone if the number of observed accidents was greater than the number of modeled accidents. The number of modeled accidents is obtained from the model of accident frequencies assessed using QR for each i road section.
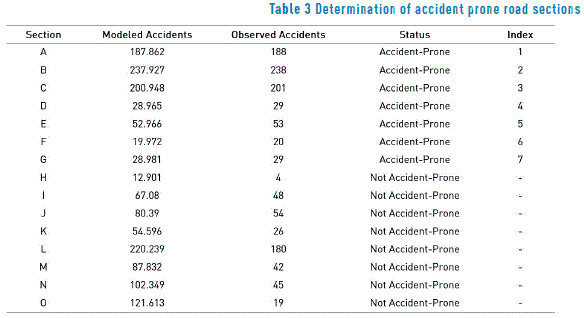
The developing of hazard ranking was conducted to study the 163 sections, however, for practical reasons Table 3 shows the results for the first 15 sections established by ranking danger; this classification sections based on the difference of quantiles, ie, the difference in value of the observed accidents and accidents modeled value [6]. The index is arranged from greatest to lowest amount of difference.
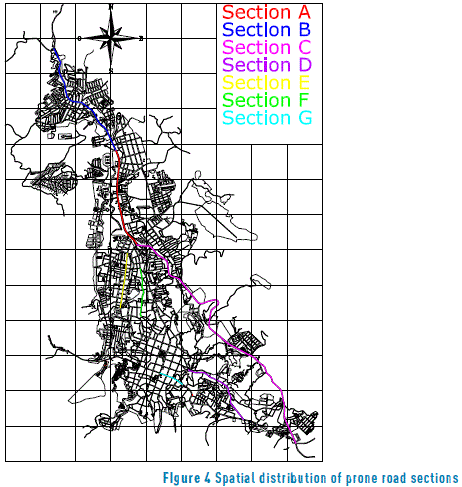
The results of the determination of the accident prone road sections and the hazard ranking are shown in Table 3, which indicates a total of 7 of the 163 study sections as accident prone (4.29%). The distribution of the sections declared to be accident prone within the road network can be seen in Figure 4. It should be noted that one of the working hypotheses has been confirmed based on the results obtained. For example, the sections identified by the letters D, E, F and G, although they indicate an apparent low accident frequency, were accident prone, while section L, although it appears to have a high number of accidents (180 total) was not accident prone. This serves as additional proof where the QR method is able to provide a more specific and discriminatory selection of the sections, as it identifies sections classified as false negatives or false positives, which stand in the way of a more efficient investment of the funds allocated to road safety.
5. Conclusions
The methodological QR approach applied to the occurrence of accidents within Ocaña´s road network provides coherent and accurate results, confirming that this methodological approximation contributes and is pertinent to studies on accident rates, specifically in the identification of accident prone sections.
Causal relationships for the model corresponding to the 95th percentile were established between accident frequency and characteristics such as length of the road section, width of the roadway, number of lanes, number of intersections, average daily traffic and average speed. Such variables had a significant effect and directly influenced the accident frequency, which is consistent with the evidence reported in previous studies.
The estimated model shows that the ADT variable has a greater statistical significance within the accident frequency. Based on this, it is evident that an increase in traffic volume increases the number of accidents. The effect produced by the P50 variable was contrary to what was initially expected. However, this result was consistent with the literature reviewed in the background. The effect of variables such as NL suggests that the addition of a lane to sections with higher a higher frequency of accidents will result in improvements in terms of road safety, decreasing the number of accidents. This effect is similar for the NI variable, while the characteristics associated with the road geometry and conditions (i.e. RL and RW) show notable improvement as the length and width of the roads is decreased.
In addition, seven accident prone sections were identified out of a total of 163 studied. This result corresponds to 4.29% of the sections, which is consistent with other research reports in which it was around 5% [6] and 2.5%, 5% and 10% depending on the quantile applied [11]. Likewise, based on the determination of the accident prone sections, the truth (still unknown) regarding the undeniably accident prone sections in the municipality of Ocaña may be understood as a priori, thus minimizing the identification of false positives and false negatives which alter the results of the research and hinder adequate investment of resources in the road sections in which such is not necessary.
Once the accident prone sections were identified, a hazard ranking was established, which serves as a decision-making tool for governmental entities whose objective is to improve road safety. In this way, it is possible to establish investment priorities for the sections based on their hazard ranking, as well as to implement preventative and/or corrective policies that allow for the maximization of the benefits associated with road safety.
Future research may incorporate other variables into the database records such as those associated with the physical and/or mental state of the driver (i.e. use of alcohol/drugs, age, fatigue), climatic conditions, characteristics of the vehicles involved and severity of the accidents, in order to develop models that allow for an improved understanding of the various factors and their effects. In addition, the assessment of multivariate models shall be explored, such as the Random Effect Negative Binomial model, the Truncated Poisson Distribution, the Truncated Negative Binomial model, the Zero-Inflated Poisson Regression, the Zero-Inflated Negative Binomial, the Bayesian Empirical Likelihood, and the Full Bayesian, among others. Likewise, a greater number of sections may be studied, covering the entire urban road network of the city.
6. References
1. World Health Organization (WHO), Global status report on road safety 2013: supporting a decade of action, 1st. Geneva, Switzerland: WHO, 2013. [ Links ]
2. Instituto Nacional de Medicina Legal y Ciencias Forenses, Forensis 2012 Datos para la vida: Herramienta para la interpretación, intervención y prevención de lesiones de causa externa en Colombia, 1st ed. Bogotá, Colombia: Instituto Nacional de Medicina Legal y Ciencias Forenses, 2012. [ Links ]
3. K. Bhalla. The Cost of road injuries in Latin America 2013. Washington D.C., USA: Inter-American Development Bank, 2013. [ Links ]
4. Consejo Nacional de Política Económica y Social. ''Documento CONPES 3764'', Bogotá, Colombia, Aug. 30, 2013. [ Links ]
5. W. Cheng and S. Washington, ''Experimental evaluation of hotspot identification methods'', Accident Analysis and Prevention, vol. 37, no. 5, pp. 870-881, 2005. [ Links ]
6. X. Qin, M. Ng and P. Reyes, ''Identifying crash-prone locations with quantile regression'', Accident Analysis and Prevention, vol. 42, no. 6, pp. 1531-1537, 2010. [ Links ]
7. R. Koenker and G. Basset, ''Regression quantiles'', Econometrica, vol. 46, no. 1, pp. 33-50, 1978. [ Links ]
8. R. Koenker, Quantile Regression, 1st ed. New York, USA: Cambridge University Press, 2005. [ Links ]
9. R. Koenker and K. Hallock, ''Quantile regression'', Journal of Economic Perspectives, vol. 15, no. 4, pp. 143-156, 2001. [ Links ]
10. I. Martínez, ''Regresión Cuantil basada en Modelos Aditivos. Aplicaciones en Pediatría (USC)'', M.S. thesis, University of Santiago de Compostela, University of A Coruña and University of Vigo, Santiago de Compostela, Spain, 2010. [ Links ]
11. S. Washington, M. Haqueb, J. Oh and D. Lee, ''Applying quantile regression for modeling equivalent property damage only crashes to identify accident blackspots'', Accident Analysis and Prevention, vol. 66, pp. 136–146, 2014. [ Links ]
12. X. Qin and P. Reyes, ''Conditional Quantile Analysis for Crash Count Data'', Journal of Transportation Engineering, vol. 137, no. 9, pp. 601-607, 2011. [ Links ]
13. H. Wu, L. Gao and Z. Zhang, ''Analysis of Crash Data Using Quantile Regression for Counts'', Journal of Transportation Engineering, vol. 140, no. 4, 2014. [ Links ]
14. J. Machado and J. Santos, ''Quantiles for Counts'', Journal of the American Statistical Association, vol. 100, no. 472, pp. 1226-1237, 2005. [ Links ]
15. X. Qin, ''Quantile Effects of Causal Factors on Crash Distributions'', Transportation Research Record Journal of the Transportation Research Board, vol. 2279, pp. 40-46, 2012. [ Links ]
16. C. Chen, ''An Introduction to Quantile Regression and the QUANTREG Procedure'', in SUGI 30 Proceedings, Philadelphia, USA, 2005, pp. 1-24. [ Links ]
17. E. Ayati and E. Abbasi, ''Investigation on the role of traffic volume in accidents on urban highways'', Journal of Safety Research, vol. 42, no. 3, pp. 209-214, 2011. [ Links ]
18. J. Also and J. Langley, ''Under reporting of motor vehicle traffic crash victims in New Zealand'', Accident Analysis and Prevention, vol. 33, pp. 353-359, 2001. [ Links ]
19. T. Brenac and N. Clabaux, ''The indirect involvement of buses in traffic accident processes'', Safety Science, vol. 43, no. 10, pp. 835-843, 2005. [ Links ]
20. X. Liu, M. Saat, X. Qin and C. Barkan, ''Analysis of U.S. freight-train derailment severity using zero-truncated negative binomial regression and quantile regression'', Accident Analysis and Prevention, vol. 59, pp. 87–93, 2013. [ Links ]
21. P. Hewson, ''Quantile regression provides a fuller analysis of speed data'', Accident Analysis and Prevention, vol. 40, no. 2, pp. 502-510, 2008. [ Links ]
22. T. Rangel, J. Vassallo and I. Herraiz, ''The influence of economic incentives linked to road safety indicators on accidents: The case of toll concessions in Spain'', Accident Analysis and Prevention, vol. 59, pp. 529-536, 2013. [ Links ]
23. C. Wang, M. Quddus and S. Ison, ''Predicting accident frequency at their severity levels and its application in site ranking using a two-stage mixed multivariate model'', Accident Analysis and Prevention, vol. 43, no. 6, pp. 1979-1990, 2011. [ Links ]
24. L. Chang, ''Analysis of freeway accident frequencies: negative binomial regression versus artificial neural network'', Safety Science, vol. 43, no. 8, pp. 541-557, 2005. [ Links ]
25. R. Noland and L. Oh, ''The effect of infrastructure and demographic change on traffic-related fatalities and crashes: a case study of Illinois county-level data'', Accident Analysis and Prevention, vol. 36, no. 4, pp. 525-532, 2004. [ Links ]
26. M. Hosseinpour, A. Shukri and A. Farhan, ''Exploring the effects of roadway characteristics on the frequency and severity of head-on crashes. Case studies from Malaysian Federal Roads'', Accident Analysis and Prevention, vol. 62, pp. 209-222, 2014. [ Links ]
27. D. Navon, ''The paradox of driving speed: two adverse effects on highway accident rate'', Accident Analysis and Prevention, vol. 35, no. 3, pp. 361-367, 2003. [ Links ]


