Serviços Personalizados
Journal
Artigo
Indicadores
-
 Citado por SciELO
 -
 Acessos
Links relacionados
-
 Citado por Google
 -
 Similares em
SciELO
 -
 Similares em Google
Compartilhar
Revista Facultad de Ingeniería Universidad de Antioquia
versão impressa ISSN 0120-6230
Rev.fac.ing.univ. Antioquia no.79 Medellín abr./jun. 2016
https://doi.org/10.17533/udea.redin.n79a18
ARTÍCULO ORIGINAL
DOI: 10.17533/udea.redin.n79a18
Contrast enhancement by searching discriminant color projections in dermoscopy images
Mejoramiento del contraste aplicando la búsqueda discriminante a proyecciones de color en imágenes dermatoscópicas
Cristian Felipe Ocampo-Blandón1, Elisabeth Restrepo-Parra1*, Juan Carlos Riaño-Rojas1, Pedro Felipe Jaramillo-Ayerbe2
1Grupo PCM Computational Applications, Facultad de Ciencias Exactas y Naturales, Universidad Nacional de Colombia. Cra. 27 # 64-60. A. A. 127. Manizales, Colombia.
2Grupo Telesalud, Facultad de Ciencias de la Salud, Universidad de Caldas. Calle 65 # 26-10. A. A. 275. Manizales, Colombia.
* Corresponding author: Elisabeth Restrepo Parra, e-mail: erestrepopa@unal.edu.co
DOI: 10.17533/udea.redin.n79a18
ISSN 0120-6230
e-ISSN 2422-2844
(Received March 04, 2015; accepted February 05, 2016)
ABSTRACT
The use of color as a strategy for enhancing the contrast is useful for conducting feature extraction procedures in images with high illumination disorders; hence, in order to correct contrast problems in images that were erroneously acquired, a method that automatically searches the discriminant projections of the color map depending on the original data dispersion is proposed. This method is based on techniques such as Fisher discriminant analysis (FDA) and principal component analysis (PCA). Because this is an unsupervised method, it can be used in images that were captured without taking into account the acquisition protocol and with non-uniform illumination. The method was tested using a set of 40 dermoscopy images, and a performance greater than 82% was obtained.
Keywords: Components, contrast enhancement, color, projection PCA, projection FDA, dermoscopy images
RESUMEN
El uso del color como una estrategia de incremento del contraste para procedimientos de extracción de características en imágenes con altos desórdenes de iluminación es de gran utilidad; por lo tanto, con el fin de corregir los problemas de contraste en imágenes que fueron adquiridas erróneamente, se propone un método que busca automáticamente proyecciones discriminantes del mapa de color dependiendo de la dispersión los datos originales. Este método se basa en técnicas tales como análisis discriminante de Fisher (FDA) y análisis de componentes principales (PCA). Debido a que este es un método no supervisado, puede ser empleado en imágenes que fueron capturadas sin tomar en cuenta el protocolo de adquisición y con iluminación no uniforme. El método fue empleado en un conjunto de 40 imágenes dermatoscópicas, obteniéndose un desempeño superior al 82%.
Palabras clave: Componentes, mejoramiento del contraste, color, proyección PCA, proyección FDA, imágenes dermatoscópicas
1. Introduction
Automatic diagnosis systems for detecting health illnesses that employ image processing have been widely accepted in recent years, because they offer support for decisions made by specialists. These methods reduce the subjectivity associated with the traditional diagnosis. In addition, these systems are capable of enhancing important details in the images based on color transformations that simplify the classification stage and provide the clarity needed to identify object structures more easily. Feature extraction as a fundamental processing stage is very important, considering its strong influence on a successful diagnosis. For instance, the standard approach in dermoscopic images analyzed usually has three stages: (i) image segmentation, (ii) feature extraction and feature selection, (iii) lesion classification [1]. The first step is one of the most important because the accuracy of the next steps strongly depends on the image segmentation performance.
In the literature, several reports can be found presenting processing of dermoscopic images. For instance, a review of different methods used for segmenting skin lesions in dermoscopic images is given in [2]. In this survey, the pre-processing, segmentation, and post-processing applied to each method are described. A work regarding to thresholding method is presented in [3]. In this paper, the proposed method involves four popular thresholding algorithms, because there are a variety of dermoscopic images that require different treatments. Some of these algorithms are presented in [4-7], and a multilevel thresholding algorithm reported in [8]. Moreover, other authors [9] proposed a color image segmentation technique based on region growing and merging that is compared with four widely reported segmentation methods. It was observed that this algorithm exhibited the best segmentation results. Other region-based segmentation method can be found in [10], where the flooding variant of the watershed algorithm was implemented for segmenting dermoscopic images. Usually, region-based methods present difficulties when the pigmented skin lesions show a great variety of colors or textures that entail to over segmentation [9]. An example of an edge-based method can be found in [11]. In this work, the skin lesion was segmented either by the geodesic active contours model or the geodesic edge tracing approach. The deformable active contours, also named snakes, are one of the most frequently used approaches for segmenting objects, especially in the case of medical images. In [12], author used the gradient vector flow (GVF) snakes method for determining the border of skin lesions in dermoscopic images. In [13] also used an improved snake model for segmenting a pigmented skin lesion. They incorporate a mean shift field term within the standard GVF objective function. The experimental results show this algorithm has a better segmentation performance than the classical GVF algorithm. On the other hand, clustering approaches are commonly used and reported [14-17] for the segmentation of dermoscopic images. In [18] a modified version of the fuzzy c-means clustering technique for segmenting a skin lesion taking into account the cluster orientation is applied. In [15] a contrast enhancement method based on independent histogram pursuit (IHP) is proposed. This algorithm generates a linear multispectral color space transformation for enhancing the contrast between the lesion and the rest of skin. In [19] a comparison between clustering algorithms such as fuzzy and c-means is developed. Recently, in [20] an approach for the detection of border irregularities, as one of the major parameters in a widely used diagnostic algorithm, the ABCD rule of Dermoscopy, is presented. In [21] a novel adaptive segmentation framework based on multi-classification model for dermoscopy images is proposed, based on five patterns of images according to the factors influencing segmentation. Experiments show that the proposed method delivers better accuracy and more robust segmentation results compared with the other seven state-of-the-art methods. In [22] an evaluation of six methods for segmenting dermoscopic image is performed, including supervised and unsupervised methods, as adaptive thresholding, gradient vector flow, adaptive snake, level set method of [23], expectation maximization level set, and the fuzzy-based split-and-merge algorithm. They concluded that the best segmentation performance were obtained by two supervised segmentation methods, more concretely by the adaptive snake and by the expectation-maximization level set methods. Recently, in [24] an effective pre-processing stage is proposed, where some undesirable parts of the image such as specular reflection, dermoscopic gel, and intrinsic cutaneous features (hair, blood vessels, skin lines, and ruler markings) were removed using different filters. In [25] a diagnostic of melanoma using machine learning algorithms is reported. This study explains the task of segmenting skin lesions in dermoscopic images based on intelligent systems such as Fuzzy and Neural Networks clustering techniques for the early diagnosis of Malignant Melanoma. The experimental results show that the Hierarchical C Means algorithm (Fuzzy) gives a better segmentation performance than others. In [26] the use of a combined Spline and B-spline in order to enhance the quality of dermoscopic images before segmentation is proposed. They proceeded to adjust image RGB values to the optimal color channel (green channel). The combined Spline and B-spline method was subsequently adopted to enhance the image before segmentation. The lesion segmentation was completed based on threshold value empirically obtained. Finally, morphological operations were utilized to merge the smaller regions with the main lesion region. In [27] proposed a novel perceptually oriented approach for transforming RGB dermoscopic image to CIE L*a*b* color space is proposed, for enhancing the contrast and detection of the region of interest; finally, an adaptive thresholding is applied to determine the optimal lesion border. In [28] presented a novel approach for segmentation of dermoscopic images based on wavelet transform where the approximation coefficients have been shown to be efficient in segmentation is presented. In [29] presented an accurate detection of the borders of skin lesions is a vital first step for computer aided diagnostic systems is presented.
In general, most of the works listed above are developed for correcting the contrast involving the histogram manipulation or intensity transformations associated with an image point (i, j) in the gray-scale; on the contrary, the method proposed here uses the color map (not only the gray spectrum) considering the RGB channels for identifying the region of interest. This fact could allow a better performance at the time of carrying out the diagnosis. On the other hand, most of the unsupervised methods work in dimensions similar to those of the original image. In the case of the method proposed here, the region of interest is stand up in a lower dimension than the original image, since the image has less colors than pixels.
In this work, a method that directly uses the color spectrum within the image is proposed; the method reduces the problem dimension from the number of pixels (Npx =n x m, where n and m are the number of rows and columns respectively) present in the image to the number of tones without repetition (N <<Npx). This method automatically searches the most discriminant color projections based on a similar Fisher discriminant analysis (FDA) criterion. It is conducted to define apparent formations that cause contrast enhancement in images in which the original contrast is not high enough for processing. The performance of the proposed method is compared with other methods reported in the literature.
This document is organized as follows: section 2 presents a description of the proposed method and gives strategies for solving the problem. Section 3 offers a discussion about the evaluation of the method. Finally, conclusions are given in section 4.
2. Materials and methods
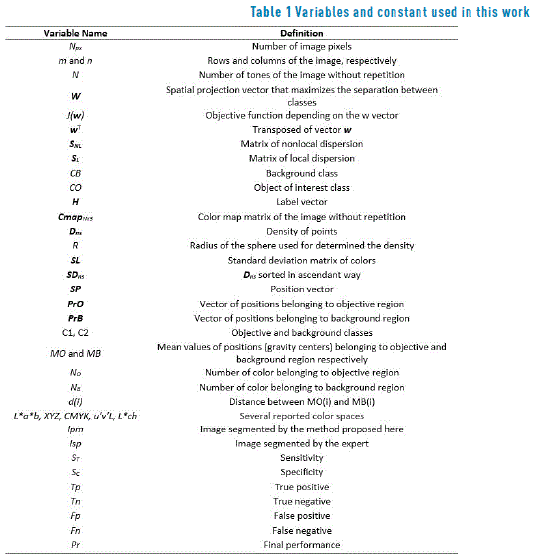
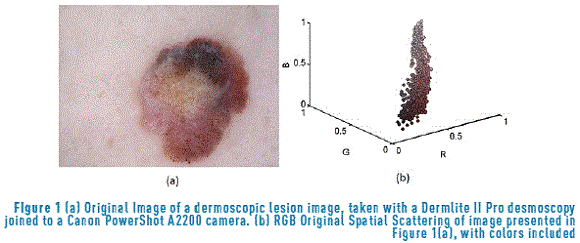
The dimensionality reduction methods are mainly used for the generation of a discriminant dataset in order to avoid redundant content. Such methods initiate from general data measurements or accurate data as the dispersion within and between classes. This research is based on measurements developed by [30], who examined global and local data dispersion. In this case, the original dermoscopic image (Figure 1(a)) is processed. This image corresponds to a dermoscopic lesson taken with a Dermlite II Pro desmoscopy joined to a Canon PowerShot A2200 camera; the image was acquired using day light, intense tones, central weighted focus and normal quality. All the variables included in this paper are listed in Table 1. The dataset corresponding to each [R G B] tone of the original image presented in Figure 1(a), without repetition is showed in Figure 1(b). This image is associated with the colormap represented in the CmapNx3 matrix of image colors, where N and 3 are the number of colors that form the image and the three color channels [R G B], respectively.
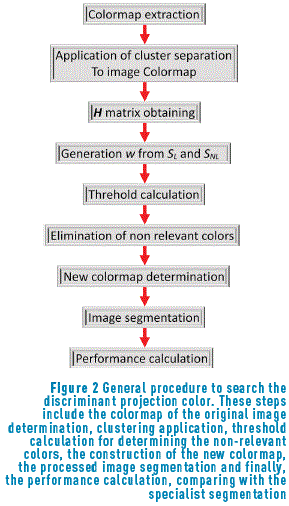
Based on the measurements developed before, the procedure involves searching the spatial projection vector w that maximizes the separation between classes and enhances the contrast when it is applied to the color. For a better understanding of this idea, the general procedure is shown in Figure 2.
As in [30], the criterion J(w) was used. This criterion represents an objective function used to increase the nonlocal dispersion (SNL) and to reduce the local dispersion (SL) matrices, when this function is maximized, similar to the Fisher criterion (FDA). Eq. (1), indicates the criterion employed.

Where the vector w is calculated by the generalized eigenvalues decomposition employing SLandSNL; wT is the transposed of the w matrix.
The local scattering SL can be characterized by the mean square of the Euclidean distance between any pair of the projected sample points belonging to the class related with background class, CB, or the object of interest class, CO, as is following described in Eq. (2).

Where i and j are two elements of the colormap. The nonlocal scatterSNLcan be characterized by the mean square of the Euclidean distance between any pair of the projected sample points belonging to the class CB, as in (3).

For clustering recognition in a colormap array, a label vector H is developed that defines the classes CO and CB as in (4)

Fisher discriminant analysis (FDA) is a supervised method because it assumes as known the labels that separate the CO and CB classes; in contrast, the method proposed by [30] employs the k-nearest neighbors' algorithm for separating the clusters. In our case, the class separation was conducted as shown in section 2.1
2.1. Separation of clusters
For calculating the density Dns, initially a matrix composed by the distance between each element of the colormap and the others is obtained with expression (5)

Then, each element of the colormap density is calculated applying the formula (6)

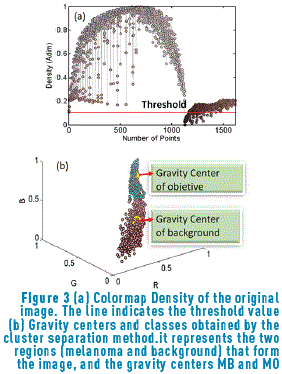
The colormap density graphic is shown Figure 3(a). Taking into account that the significant clusters are those that have a high concentration around a gravity center, a measure of density is proposed for classes having a balanced number of samples. For identifying the gravity center related to each group, it is assumed that the gravity centers will have the largest quantity of points around them. This density measures the concentration of the point with its nearest neighbors.
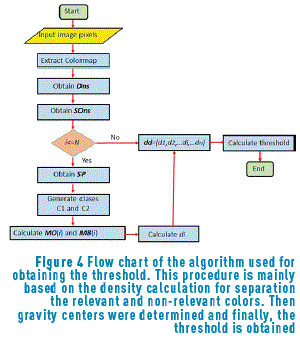
After finding the density associated with the image colors (Figure 3(a)), all the points that have a negligible intensity are eliminated; therefore, it is necessary to find the threshold that eliminates these points in order to carry out the clustering process only having into account the points of interest. The procedure for obtaining the best threshold is performed using the algorithm represented in Figure 4.
Initially, Dns is calculated for all the points belonging to the Colormap of the image, using expression (5). After that, the values of density are sorted in an ascendant way and their positions are including in the vector SDns. The algorithm runs over of the N colors belonging to the image Colormap, and for each i-th color, a vector position SP(i) is built. This SP(i) vector contains all the point positions that fulfil the condition Dns>SDns(i). The objective of this step is finding points that have higher density value than the current i-th point and keeping it in the SP(i) vector. Once the SP(i) vector was built ,the k-means method was used for calculating the gravity center associated with each group. In our case, two groups (classes) were found, C1 and C2 that represent the groups of points belonging to the objective of interest and background regions respectively. Then, vector PrO(i) and PrB(i), containing the positions of SP(i) vector corresponding to C1 and C2 respectively, are built. After that, the mean values MO(i) and MB(i), that represent the average position of C1 and C2 respectively, are calculated. They were obtained using expressions (7) and (8).


Once these average values were calculated, the distance between them, d(i), was obtained using the Eq. (9):

A vector including all the di values, 1≤ i ≤ N, was built as is expressed in Eq. (10):

Finally, the best threshold is found choosing the element of SD(i) that exhibits the highest d(i) value. This represents the most irrelevant color in the color space of the image.
After that, irrelevant colors were eliminated considered a sphere centered at threshold and with radius r that represents one third part of the average standard deviation of the image colors. This r should be larger enough to not eliminate the concentration with the smallest dispersion; then, the radius r is obtained from the local scatter data, as in Eq. (11).

Were SL3x3 is the standard deviation matrix of colors that form the image and the sub-index i=1,2 and 3 corresponds [R G B]. The SL matrix of colormap is written according to (12):

For instance, SLRR is the standard deviation of red channel with respect to the mean value of red for all the pixels belonging to the image; SLRG, represents the standard deviation of red with respect of the mean of green. For calculating r, only the elements belonging to the diagonal of the matrix were used, since they are the most representative.
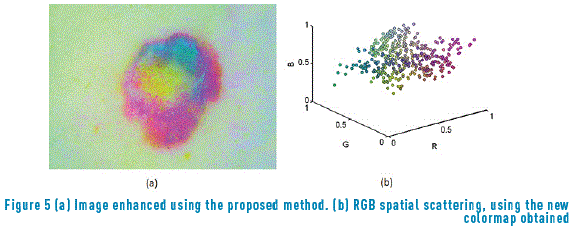
By applying the algorithm represented in Figure 4 to the image data, not only the points dispersed with respect to a specific concentration are eliminated (Figure 5(a)) but also the gravity centers belonging to principal color formations are obtained (Figure 5(b)).
Based on the general procedure shown in Figure 2, a new colormap with the remained colors was developed, and this colormap is normalized (dividing by the maximum intensity of the colormap). In this image, the regions are well separated. After that, as segmentation process was applied to the image and this segmented image is compared with the segmentation performed by the specialist [31].
3. Results and discussion
The proposed method was evaluated on a set of 40 dermoscopic images previously segmented by a specialist team in dermatology.
Different segmentation methods were used for analyzing the performance, assuming the most effcient method is associated with the color transformation that suitably enhances the region of interest, without adding noise. These methods are presented following: (1) Otsu's method [32] was employed in the segmentation by thresholding; (2) Segmentation by color [31] and (3) segmentation by thresholding of the colormap [33]. The procedure was compared with different color spaces found in the literature:  . Moreover, comparisons were also made with color transformations obtained by means of other approaches that seek the significant projection, such as PCA and (FDA).
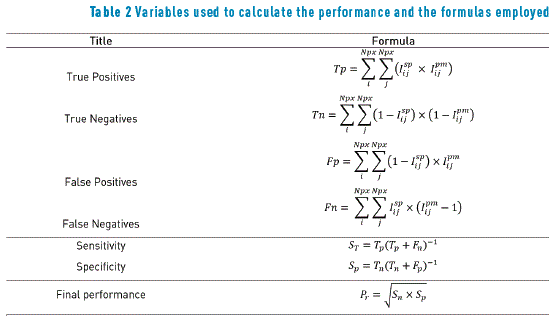
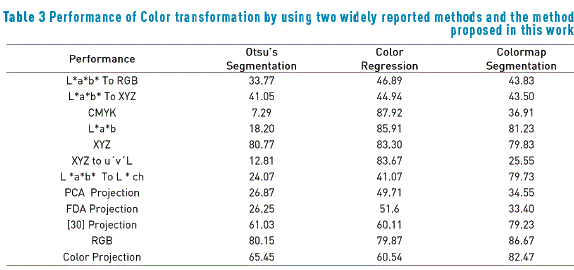
The procedure was developed assuming the existence of two main clusters that generally define the colors on dermoscopy images, darker and light colors. The variables used for measuring not only the proposed method, but also other methods reported in the literature are listed in Table 2; furthermore, Table 3 shows the performance of two no supervised standard methods reported in the literature, for being compared with the proposed method. This performance was determined by calculating the sensitivity ST and specificity SC as a function of true positive (Tp), true negative (Tn), false positive (Fp) and false negative (Fn). These elements were extracted from the segmented image after the application of the proposed process Ipm and using the image segmented by the team of specialists Isp. The final performance was measured by calculating the geometric mean of sensitivity and specificity, according to the formula included in Table 2. In Table 3, high values represent high performance, since the specificity and the sensitivity are high, while low values in the performance indicate low specificity and/or low sensitivity.
The Color segmentation method [34] was implemented by restricting the color scale to tones localized randomly in the image center because the lesion is generally placed in this region. The color thresholding segmentation searches the boundary that splits the scatter into two classes associated with the pair of [RGB] colors that are less correlated. According to results presented in Table 3, the Otsu's Method exhibits the worst performance. This behavior is due to the interest region surface after applying Color Projection accepts a wider of intensities and hence is more irregular. It is not possible to find the optimum threshold with Otsu's Method, and although the proposed method considers more colors, these tones are found exclusively in the region of interest; on the contrary, the color regression method present a better performance that Otsu's Method, and, for some color spaces, its performance is higher than it for the colormap method. Then, it is possible to conclude that the performance of a segmentation method strongly depends on the chosen color space.
4. Conclusions
In this document, a method for correcting the contrast using the most discriminant projection of the colormap is presented. The method overcomes the problems with the illumination, enhancing the relevant features with borders, a blue veil, color or dots. Moreover, working with local and nonlocal color scatter, it was demonstrated that discriminant color projection presents better results compared with those obtained when the within and between classes scatter are applied. Furthermore, the algorithm is more effcient than the projections obtained with PCA and FDA, even exceeding the performance of the color transformations most often used. Evaluating the performance of Color Projection by a classic thresholding method, it was found to be affected by the variability of parameters in the image acquisition process. In contrast, evaluation with a color segmentation method showed better behavior, because Color Projection assigns exclusives tones to the region of interest. In this case, the classification method employing the gravity centers behaves better than the k-means algorithm; hence, the procedure can be applied in classification stages and shows an outstanding level of performance.
5. Acknowledgment
The authors gratefully acknowledge the financial support of la Dirección Nacional de Investigaciones of the Universidad Nacional de Colombia - DIMA, during the course of this research.
6. References
1. P. Ferreira, T. Mendoca, P. Rocha and J. Rozeira, ''A new interface for manual segmentation of dermoscopic images'', in 3rd Eccomas Thematic Conference on Computational Vision and Medical Image Proc. (VipIMAGE), Olhão, Portugal, 2011, pp. 399-403. [ Links ]
2.M. Celebi, G. Schaefer, H. Iyatomi and W. Stoecker, ''Lesion border detection in dermoscopy images'', Computerized Medical Imaging and Graphics, vol. 33, no. 2, pp. 148-153, 2009. [ Links ]
3. M. Celebi, S. Hwang, H. Iyatomi and G. Schaefer, ''Robust border detection in dermoscopy images using threshold fusion'', in 17th IEEE International Conference on Image Processing (ICIP), Hong Kong, China, 2010, pp. 2541-2544. [ Links ]
4. J. Kapur, P. Sahoo and A. Wong, ''A new method for gray-level picture thresholding using the entropy of the histogram'', Computer Vision, Graphics, and Image Proc., vol. 29, no. 3, pp. 273-285, 1985. [ Links ]
5.J. Kittler and J. Illingworth, ''Minimum error thresholding'', Pattern Recognition, vol. 19, no. 1, pp. 41-47, 1986. [ Links ]
6. N. Otsu, ''A threshold selection method from gray-level histograms'', IEEE Trans. Sys., Man, and Cybernetics, vol. 9, no. 1, pp. 62-66, 1979. [ Links ]
7.J. Humayun, A. Malik and N. Kamel, ''Multilevel thresholding for segmentation of pigmented skin lesions'', in IEEE Inter. Conf. on Imaging Sys. Tech. (IST), Penang, Malaysia, 2011, pp. 310-314. [ Links ]
8. M. Silveira et al., ''Comparison of segmentation methods for melanoma diagnosis in dermoscopy images'', IEEE J. Selected Topics in Signal Proc., vol. 3, no. 1, pp. 35-45, 2009. [ Links ]
9. M. Celebi, Y. Aslandogan and P. Bergstresser, ''Unsupervised border detection of skin lesion images'', in Int. Conf. Inform. Technol.: Coding and Comp. (ITCC), Las Vegas, USA, 2005, pp. 123-128. [ Links ]
10. H. Wang et al., ''Watershed segmentation of dermoscopy images using a watershed technique'', Skin Res. Technol., vol. 16, no. 3, pp. 378-384, 2010. [ Links ]
11. D. Chung and G. Sapiro, ''Segmenting skin lesions with partial-differential-equations based image processing algorithms'', IEEE Trans. Med. Imaging, vol. 19, no. 7, pp. 763-767, 2000. [ Links ]
12. B. Erkol, R. Moss, R. Stanley, W. Stoecker and E. Hvatum, ''Automatic lesion boundary detection in dermoscopy images using gradient vector flow snakes'', Skin Res. Technol., vol. 11, pp. 17-26, 2005. [ Links ]
13. H. Zhou et al., ''Skin lesion segmentation using an improved snake model'', in Annual International Conference of the IEEE Eng. Med. Biol. Soc. (EMBC), Buenos Aires, Argentina, 2010, pp. 1974-1977. [ Links ]
14. R. Rodríguez, P. Castillo, V. Guerra, A. Suárez and E. Izquierdo, ''Two Robust Techniques for Segmentation of Biomedical Images'', Computación y Sistemas, vol. 9, no. 4, pp. 355-369, 2006. [ Links ]
15. D. Gómez, C. Butakoff, B. Ersboll and W. Stoecker, ''Independent histogram pursuit for segmentation of skin lesions'', IEEE Trans. Biomed. Eng., vol. 55, no. 1, pp. 157-161, 2008. [ Links ]
16. Y. Zhou, M. Smith, L. Smith and R. Warr, ''Segmentation of clinical lesion images using normalized cut'', in 10th Workshop on Image Analysis for Multimedia Interactive Services (WIAMIS), London, UK, 2009, pp. 101-104. [ Links ]
17. R. Devi, L. Suresh and K. Shunmuganathan, ''Intelligent fussy system based dermoscopic image segmentation for melanoma detection'', in Inter. Conf. Sustainable Energy and Intel. Syst., Chennai, India, 2011, pp. 739-743, 2011. [ Links ]
18. P. Schmid, ''Segmentation of digitized dermatoscopic images by two-dimensional color clustering'', IEEE Trans. Med. Imaging, vol. 18, pp. 164-171, 1999. [ Links ]
19. S. Chattopadhyay, D. Pratihar and S. Sarkar, ''A comparative study of fuzzy c-means algorithm and entropy-based fuzzy clustering algorithms'', Computing and Informatics, vol. 30, pp. 701-720, 2011. [ Links ]
20. K. Reetz, R. Rangel, T. Antoniolli, G. Chiaradia and M. Widholzer, ''Evaluation of patients' learning about the ABCD rule: a randomized study in southern Brazil'', An. Bras. Dermatol., vol. 84, no. 6, pp. 539-398, 2009. [ Links ]
21. J. Jaworek-Korjakowska, ''Novel Method for Border Irregularity Assessment in Dermoscopic Color Images'', Comp. Math. Meth. Med., vol. 2015, Article ID 496202, pp. 1-11, 2015. [ Links ]
22. F. Xie, Y. Wu, Y. Li, Z. Jiang and R. Meng, ''Adaptive segmentation based on multi-classification model for dermoscopy images'', Frontiers Comp. Sci., vol. 9, no. 5, pp. 720-728, 2015. [ Links ]
23. T. Chan, B. Sandberg and L. Vese, ''Active contours without edges for vector-valued images'', J. Visual Commun. Image Repres., vol. 11, pp. 130-141, 2000. [ Links ]
24. Q. Abbas, M. Celebi, I. García and M. Rashid, ''Lesion border detection in dermoscopy images using dynamic programming'', Skin Res. Technol., vol. 17, pp. 91-100, 2011. [ Links ]
25. L. Suresh, K. Shunmuganathan and S. Veni, ''Dermoscopic Image Segmentation using Machine Learning Algorithm'', Am. J. Appl. Sci., vol. 8, pp. 1159-1168, 2011. [ Links ]
26. A. Abbas, X. Guo, W. Tan and H. Jalab, ''Combined spline and B-spline for an improved automatic skin lesion segmentation in dermoscopic images using optimal color channel'', J. Med. Syst., vol. 38, pp. 80-87, 2014. [ Links ]
27. Q. Abbas, I. Fondón, M. Celebi, W. Ahmad and Q. Mushtaq, ''A perceptually oriented method for contrast enhancement and segmentation of dermoscopy images'', Skin Res. Technol., vol. 19, pp. 490-497, 2013. [ Links ]
28. H. Castillejos, V. Ponomaryov, L. Nino and V. Golikov, ''Wavelet Transform Fuzzy Algorithms for Dermoscopic Image Segmentation'', Comp. Math. Meth. Med., vol. 2012, Article ID 578721, pp. 1-11, 2012. [ Links ]
29. M. Zortea, S. Skrøvseth, T. Schopf, H. Kirchesch and F. Godtliebsen, ''Automatic Segmentation of Dermoscopic Images by Iterative Classification'', Int. J. Biomed. Imaging, vol. 2011, Article ID 972648, pp. 1-19, 2011. [ Links ]
30. J. Yang, D. Zhang, J. Yang and B. Niu, ''Globally maximizing, locally minimizing: Unsupervised discriminant projection with applications to face and palm biometrics'', IEEE Transactions on Pattern Analysis and Machine Intelligence, vol. 29, pp. 650-664, 2007. [ Links ]
31. Y. Yao, B. Abidi, N. Kalka, N. Schmid and M. Abidi, ''Improving long range and high magnification face recognition: Database acquisition, evaluation, and enhancement'', Comput. Vis. Image Und., vol. 111, pp. 111-125, 2008. [ Links ]
32. C. Zhang, X. Wang and H. Zhang, ''Contrast enhancement for fruit image by gray transform and wavelet neural network'', in IEEE International Conference on Networking, Sensing and Control (ICNSC), Ft. Lauderdale, USA, 2006, pp. 1064-1069. [ Links ]
33. X. Zong, A. Laine and E. Geiser, ''Speckle reduction and contrast enhancement of echocardiograms via multiscale nonlinear processing'', IEEE T. Med. Imaging, vol. 17, pp. 532-540, 1998. [ Links ]
34. Y Chen, M. Huang and S. Chen, ''Automatic Color Segmentation by Colormap and Edge Detection by Chan Vese Method for Tongue Image'', J. Appl. Sci., vol. 13, pp. 3676-3683, 2013. [ Links ]


