


 English (pdf)
 Article in xml format
 Article references
 Send this article by e-mail
 Cited by SciELO
  Cited by Google
  Similars in
SciELO
Similars in
SciELO  Similars in Google
 Permalink
1. Introduction
The field of orthopedic implants (plates, screws, prosthesis, bone pins) had an increase in research in the last years, with particular emphasis on design and development of coatings to improve the mechanical properties, the biocompatibility, the electrochemical resistance, and the physicochemical similitude to the bone tissue.
In this perspective, many techniques have been employed for performing coatings on metallic materials such as plasma spraying[1], electrophoretic deposition[2], ion implantation[3], sol-gel[4], plasma electrolytic oxidation[5], among others[6]. Plasma electrolytic oxidation (PEO) is one of the techniques for this purpose to enhance the mechanical properties, wear resistance, and the good adhesion with the substrate exhibited by the coatings. Also, PEO allows easily ions incorporation in the electrolytic plasma solution and an easy technological development of the technique[7, 8].
Different formulations for the electrolytic plasma solution have been proposed containing ions such as calcium, phosphorus, and silicon, which are known to be precursors of osteogenesis in calcium phosphates form in order to obtain osseointegrated coatings by PEO over a substrate of Ti6Al4 [7 - 9].
PEO consisted on a discharging mechanism, where a continuous gas envelope is formed around the anode. In the surrounded environment of the electrode, the number of anions increases, especially on the surface of the gas bubbles due to the high potential between anode and cathode. A localized electric field is produced between the Ti6Al4V and the negative charges, the gas inside the bubbles is ionized and the incidence is the plasma discharge. PEO attracted growing of oxides on the surface including the elements present in the electrolytic solution[10]. Additionally, it has been investigated coatings no obtained by PEO with constituent agents that help to prevent infection in implanted devices, preventing the growth of bacterial biofilms. These constituents such as chitosan and silver ions[11], even pure titanium have presented antibacterial activity[1-6].
Different techniques have been used for the evaluation of electrochemical stability in the coating as potentiodynamic curves, electrochemical impedance spectroscopy and Mott-Schottky[12]. Also, methods such as electrostatic force microscopy (EFM) have been employed to map the surface potential and the electrostatic forces present in the coatings. EFM and mapping of surface potential are nondestructive atomic force microscopy techniques for detecting electric field gradients and potential surface variations on insulating, conducting and semiconducting materials[13].
The aim of this study was to analyze the electrochemical stability and dielectric behavior of coatings obtained by plasma electrolytic oxidation on Ti6Al4V, using different compositions in the electrolytic solution to allow inclusion of ions and improve the coating properties. The ions included were PO42, Ca+2, Si+4, also Ag+1 which may affect the bioactivity of the coating and improve the resistance to bacterial attack[14]. One of the fundamental characteristics of ions inclusion in the coating is the electrochemical stability, this condition ensures a good performance against corrosion processes and allowed the identification of a bioactive behavior. The bioactivity was assessed by electrochemical impedance spectroscopy (EIS) in a simulated body fluid (SBF). EIS is a useful method to characterize many of the electrical properties of the coatings with the electrode interface, used to investigate the semiconducting dynamics[15]. This technique principally characterizes the bulk behavior respect to the SBF solution. For a better understanding of the coating electrochemical behavior, EFM was employed to characterize the surface potential, this technique allows the interface analysis starting from the surface.
2. Materials and methods
2.1 Sample preparation and plasma electrolytic oxidation (PEO)
Ti6Al4V ELI (ASTM F136) disk-shaped samples with Ø 14 mm and 2 mm thick were polished with sandpaper #240, 320, 400, 600, and 1,200. Samples were cleaned in ultrasound during 5 min in isopropyl alcohol, rinsed in distilled water and dried at room temperature. After the polished, samples were pickled in a solution 3 % HF-20 % HNO3 to remove amorphous oxides on the surface. Before PEO, an anodizing process was performed in 5 M orthophosphoric acid using a DC power supply (PAS500-1.8, KIKUSI) operated in the constant current mode, with current density 8.8 mA/ cm2 and a voltage reached of 147 V for 2 min without reaching the dielectric breakdown to growing preferential titanium oxides.
PEO was performed using a DC power supply operated in a constant current mode in two basic electrolytic solutions. Solution 1 enriched with PO4 2- and Ca+2 ions (contained 6.3 g/L calcium bis(dihydrogen phosphate)-monohydrate, 12.7 g/L calcium acetate, 44.67 g/L ethylene-diamine-tetra-acetic acid disodium) and solution 2 (contained 6.13 g/L sodium silicate and 5.6 g/L potassium hydroxide) employed in the treatment of the second set of samples, enriched with Si+4 ions. Those samples first passed by PEO treatment using Solution 1. PEO was carried out with current density 70 mA/cm2 and voltage 270 V. A 316L steel plate served as an anode and a Ti6Al4V as a cathode and the time of oxidation was 2 min for Solution 1 and 1 min for Solution 2.
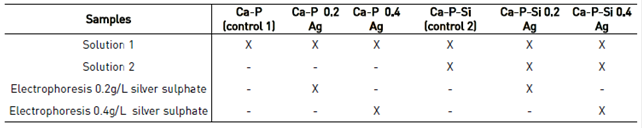
Ag+1 ions were incorporated into the coating through electrophoresis after PEO treatment, using two different concentrations of silver sulfate one low of 0.2 g/L and one high of 0.4 g/L diluted in distilled water. Electrophoresis was developed under a constant voltage of 10 V for 20 min. Different conditions of samples coated to analyze in this work were described in Table 1.
All coated samples were washed with distilled water and carried out to a thermal process to stabilize ions incorporated into the coating; the temperature employed was 450 °C during 1 h in a muffle oven and cooled to room temperature freely. The thermal process promotes the formation of crystal structures in the coating given by the oxidizing environment of this stage, causing profound influence on the microstructural changes of the alloy.
2.2. Scanning Electron Microscopy (SEM)
Morphological identification of the samples was performed with SEM (EVO MA10, Carl Zeiss) using detectors of secondary electrons and backscattering electrons. The analysis was conducted superficially and in cross sections for all the samples. Cross sections were made for all samples. Employing a micro cutter (Isomet®, Buheler) and after mirror polished, ultrasound cleaned in isopropyl alcohol for 5 min, rinsed with distilled water and drying at room temperature.
2.3. X-ray diffraction (XRD)
Compositional identification of some particular samples was performed using a diffractometer (D8 ADVANCE, Bruker) with Cu-Kα radiation as the X-ray source. Voltage 40 kV, the angle between 5 °-70 ° in 2θ, step 0.01526 °, and sampling time 0.4 s. XRD spectra were compared with the database PDF-2 Center for Diffraction Data (ICCD).
2.4. Electrochemical impedance spectroscopy (EIS) and Mott-Schottky (M-S)
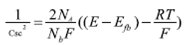
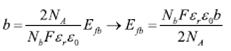
EIS measurements and M-S were carried out to determine the electrochemical properties of the coating. EIS was performed in a body simulated fluid according to Kokubo´s formulation[16] at corporal temperature 37 °C. The analysis was conducted using a potentiostat/galvanostat (1.000®, Gamry) coupled with a commercial acquisition software. A three-electrode electrochemical cell was used, the counter electrode consisted of a graphite rod of 99.99 % purity, and a saturated calomel electrode served as reference. The EIS spectra were obtained at the corrosion potential with an amplitude of 25 mV. The frequency range was from 100 kHz down to 0.01 Hz. All the data collected were simulated in the software Z View® for fitting the EIS data to an equivalent electric circuit. The quality of fitting to the equivalent circuit was established for the χ2; acceptable values were that minimum of 10-4. Each test was performed in duplicate. M-S measurements were carried out with the same solution and electrochemical cell described. A fixed frequency of 100 Hz, an amplitude of 70 mV and a potential range of -0.5 mV to 0.5 mV taking as reference the corrosion potential were employed. All results were analyzed employing M-S theory to describe the semi-conductive nature of the coating. This theory allows the determination of the carrier density (Nb) from the representation of the space charge capacitance (Csc) as a function of the applied potential as shown in Eq. (1) referred to the M-S relationship for an n-type semiconductor[17].
 (1)
(1)
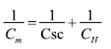
Where NA is the Avogadro´s number, F is the Faraday constant, εr the relative dielectric constant of the coating, ε0 the vacuum permittivity, R the Boltzmann constant, T the absolute temperature and Efb the flat band potential. Besides, Eq. (2) presented a relationship for the Cm capacitance obtained from the equivalent electric circuit for the coating, with Csc and CH capacitance of the electrochemical double layer.
 (2)
(2)
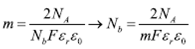
Therefore, a plot of 1/C2 SC against Efb should yield a straight line from which Efb can be determined from the intercept on the V axis named as b. The value of Nb can also be found on the slope, named as m [18]. This relationship allows establishing the Nb and Efb as shown in Eqs (3) and (4), respectively.
 (3)
(3)
 (4)
(4)
The term RT/F is considered negligible for body temperature, because mathematically the magnitude of the Faraday constant in the denominator is a high value and the result of the division is depreciable. The electrochemical determination of the carrier density and flat band potential parameters is straightforward when energy band edges are pinned at the surface, and AC response of space charge layer capacitance can be separated in the frequency range from other interfacial structures and processes, like in the case of a stationary ideally polarizable semiconductor-electrolyte interface[19].
2.5. Electrostatic force microscopy (EFM)
Electrostatic force microscopy was used to identify the phase and amplitude in all the coatings using an atomic force microscope (NX10, Park Systems). Also, scanning Kelvin probe microscopy (SKPM) was used to record the Surface potential. Scan areas of 20 x 20 µm were analyzed with a scan rate of 0.6 Hz. For EFM and SKPM first the equipment logged a height image (Surface topography) and after lifted the cantilever tip to enter into a zone influenced only by electrostatic forces. To record the signals of phase, amplitude, and potential in this zone a DC bias of 6 V was applied to the sample and AC bias of 1.5 V to the tip. A conductive tip (Multi 75E, Budget sensors) coated with Cr / Pt with a constant force of 3 N/m and a resonant frequency of 75 kHz was employed.
3. Results
3.1. SEM
Morphological analysis of the coatings was performed to identify defects on the surface that could be related to the electrochemical performance, such as structural defects as cracks or pores. Coatings obtained showed in Figure 1 presented a morphology of interconnected pores with an average size of 1 µm, and smaller pores with a mean size ranging from 428 nm to 681 nm. These different pore sizes will stimulate fluid exchange and cells signaling and will make possible the occurrence of high surface energy sites[1]. Pore sizes described are related to the spark discharges produced by the high electrolytic and dielectric breakdown voltage, which can be controlled with the corresponding variables in the electrolyte assembly[6-8].
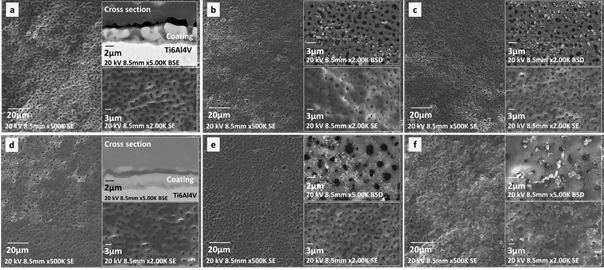
Figure 1 Coatings obtained by PEO with an electrolytic solution enriched in PO4 2-, Ca+2, Si+4 y Ag+1 ions. a) Ca-P (Control 1) , b) Ca-P-0.2 Ag, c) Ca-P-0.4 Ag, d) Ca-P-Si (Control 2), e) Ca-P-Si-0.2 Ag, f) Ca-P-0.4 Ag
The formation of pores is typically associated with PEO as a result of the discharges with posterior microchannel formation[29]. No significant differences in the coatings treated with solution 2 were observed, as showed in Figure 1(a) and Figure 1(d). Some authors have reported that addition of Si+4 ions enhanced the electrical conductivity of the electrolyte, increasing the partial voltage of the coating surface with a tendency to create local cracks[14]. It is important to emphasize that the porous morphology is the effect of coating synthesis and the surface of the pores did not show structural defects.
SEM cross sections of both control samples, as seen in Figure 1(a) and Figure 1(d), allowing the identification of a first oxide layer with a thickness of 330 nm -507 nm as a result of the anodizing process. A granular layer obtained by PEO was also identified on top of the first oxide layer, this double layer configuration has been reported in other works (21). For samples treated with solution 1 [Figure 1(a)) the coating thickness was constant between 3.5 µm - 5.2 µm, showing a granular amorphous formation. Whereas samples treated with solution 1-2, [Figure 1(d)) showed a more irregular coating with a thickness of 0.5 µm - 5.2 µm, and with smaller granular formation.
The decrease in the coating thickness and surface irregularities were regarding the second PEO process due to the sparks generated during this step. This sparks promoted coating growing, and may also lead to coating destruction[6]. Also, the coating time presented a relation with the pore size, with an increased in coating time, coatings presented higher pore size[22]. In addition, the coating thickness had a relation with the voltage reached during PEO, for 270 V similar coating thickness had been reported with a tendency to increase until 10 µm with 600 V[9]. The coating thickness increased proportionally to the electrolytic voltage[8].
Otherwise, samples with silver electrophoresis presented small agglomerations of silver particles. These agglomerations were observed with backscattered electron detector and had a bigger size for the highest silver concentration for both Ca-P and Ca-P-Si samples [Figure 1(c) and Figure 1(f)).
3.2. XRD
XRD diffraction patterns for Ca-P, Ca-P 0.4Ag, and Ca-P-Si 0.4Ag samples were presented in Figure 2. Only three coatings were analyzed with the aim of identifying silver oxide and established a relationship between silver ions with other compounds present. The formation of silver oxide affects the conductivity of the coating Ca-P-Si 0.4Ag as shown later. Analyzing the diffraction pattern semi-crystalline structures with silicon incorporation in the coatings were identified, those affect the rate of bone growth in the early stages of bone formation and increase the proliferation and gene expression of osteoblasts, exhibiting anticorrosive properties[14]. Furthermore, the formation of titanium dioxide in anatase phase was observed, this phase is the most commonly formed in titanium oxidation processes[23]. Anatase is a desirable phase for ions incorporation in the coating, due to the capacity to absorb OH- and PO4 3- groups that enhance the deposition of calcium and phosphorus[14]. This deposition of calcium and phosphorus was observed with the calcium phosphates present in the diffraction pattern. Calcium phosphates mimic the behavior of hydroxyapatite in bone regeneration, and they were formed due to the presence of these components in the electrolytic solution of PEO[9]. Also, it has exhibited excellent corrosion protection in simulated physiological solutions[20].
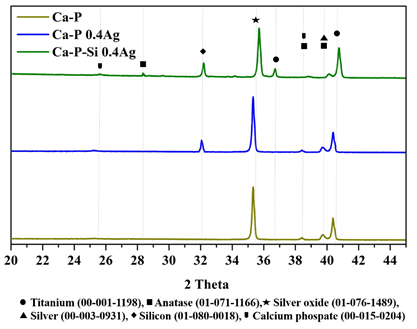
Other studies have reported the presence of titanium dioxide in rutile phase in similar coatings, this phase is desirable for its stability and corrosive propertie [23,24]. However, the samples analyzed did not present this phase possibly for the short time of heat treatment employed. For good relationship, rutile/anatase researchers have been reported heat treatments of 9 h to 13 h[25]. The signal obtained at 25 ° was indicative of an amorphous phase, which was related to the growth of amorphous oxides and other components with non-crystalline phases. Other researchers had reported this phase in samples treated with electrolytic solutions contained Na2SiO3 and SiO2[26], for the XRD diffraction pattern, this peak was higher for the sample Ca-P-Si 0.4Ag one of the samples coated with solution 2 containing Na2SiO3.
3.3. EIS y Mott-Schottky
Properties of corrosion and coating protection along the time were identified with EIS analysis. The spectra were reproducible for all coatings with light changes related to the coating composition. Bode plots were presented in Figure 3. All coatings presented in Bode diagrams a corrosion mechanism dominated by charge transference. Ca-P, Ca-P-Si 0.2Ag, and Ca-P-Si 0.4Ag presented a relaxation in low frequencies (0.1 Hz - 50 Hz) related with mass transference despite not being the dominant mechanism of corrosion. This relaxation may be linked to a dense and continued layer in contact with the substrate, identified as an inner layer for other researchers and reported as a first time constant [27]. Moreover, the mass transference occurred at low frequencies with a capacitive behavior and a small slope about the relaxation given by charge transference (50 Hz - 100 kHz) having a resistive behavior with a larger slope. It means, highly protective coatings with a tendency to increase the substrate conductivity were obtained, which may be a reflex of its bioactivity. Ca-P-Si, Ca-P 0.2Ag, and Ca-P 0.4Ag presented a charge transference mechanism, this has been reported as a second time constant of an external porous coating layer produced by the dielectric breakdown for the PEO[27] Where at high frequencies the porosity of the coating layer reduced the impedance values[28].
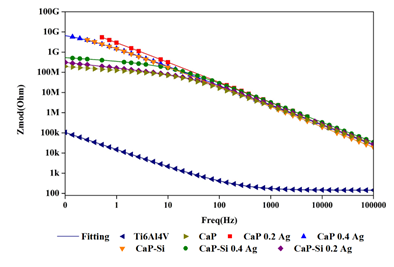
A transition zone in 50 Hz was presented between the mass transference from Ti6Al4V and the charge transference related with the substrate protected by the coating. The increased conductivity had a relationship with the coatings obtained, there was observed greater instability or higher tendency to react for those containing silicon in its structure. In coatings with silicon, the inclusion of silver is a factor that increases the instability, because the chemical bonding of the components of these coatings generated more possibilities to react by the availability of bonds of silicon. Furthermore, in coatings not containing silicon, the silver inclusion improved the stability because it is high probably that the chemical bonding of silver completes the structures. This bonding creates a protective coating with no tendency to generate new compounds. These results were similar to other researchers results about PEO treatments that had remarkably improved the corrosion resistance of Ti6Al4V compared with the naked substrate[29]. In Bode diagram, Ca-P 0.2Ag was the most stable coating exhibiting more protection, conductivity, and the smallest capacitance value according to the fitting obtained from the equivalent electric circuit proposed. In order of stability, it was followed by Ca-P 0.4Ag, Ca-P-Si, Ca-P-Si 0.4Ag, Ca-P-Si 0.2Ag and Ca-P coatings.
Figure 4 shows Nyquist diagrams associated with EIS tests. At low frequency, the behavior of the different coatings was depressed. Corroborating that the most stable coating is Ca-P 0.2Ag, followed by Ca-P 0.4Ag, Ca-P-Si, Ca-P-Si 0.4Ag, Ca-P-Si 0.2Ag and Ca-P. Ca-P presented a turning point that may be related to a process of mass transference, this process corresponds to the relation and similitude between the chemical nature and the specific interfaces with the coating. However, this was considered uniform allowing the assumption of a single model, where this process was overlapped with the process of the substrate.
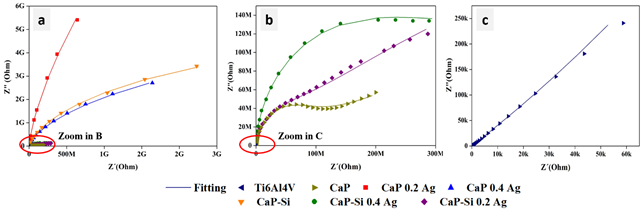
Figure 4 EIS results in coatings obtained by PEO. a) Complete diagram. b) Zoom of some samples. c) Zoom results Ti6Al4V
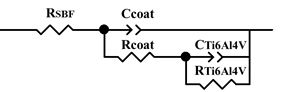
The equivalent electrical model for coatings is shown in Figure 5. It is a model composite of an oxide in a double layer, wherein the first layer corresponds to a porous outer layer or coating and the second layer to an inner barrier that represents the substrate, previously described in Bode diagrams and reported by other researchers[23][24]. For the model RSBF corresponds to the resistance of the simulated body fluid solution, Ccoat-Rcoat corresponds to the coating film and CTi6Al4V-RTi6Al4V to Ti6Al4V substrate.
The values obtained for the equivalent circuit fitted are represented in Table 2. Impedance measurements were performed for samples present in Table 1. Additionally, a third control was included, corresponding to a sample of Ti6Al4V uncoated.
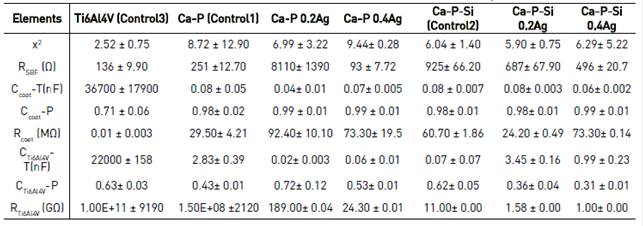
Bioactivity, coatings stability and the relation between morphology and the electrochemical behavior were analyzed from the fitting results for the equivalent electric model. For control 1, the value of Rcoat was 29.50 ± 4.21 MΩ and increased with the inclusion of silver ions on the coating. Silver ions increased the resistance in the coatings to values of 92.40 ± 10.10 MΩ and 73.30 ± 19.5 MΩ for Ca-P 0.2Ag and Ca-P 0.4Ag, respectively. For this group of samples, the resistance was greater with silver inclusion. While for samples with silicon inclusion, the behavior of the Rcoat did not present this trend. For control 2, the value was 60.70 ± 1.86 MΩ, a bigger value in comparison to the other two controls. Nonetheless, with the inclusion of silver, low concentration decreased the resistance to 24.20 ± 0.49 MΩ, and high concentration increased the value to 73.3 ± 0.14 MΩ obtaining a value close to the control. This phenomenon of growth in resistance by the presence of a coating on the substrate is an indication of the coatings stability. Because for control 3 the Rcoat value corresponds purely to the formation of amorphous oxides on the surface of Ti6Al4V, which do not exhibit stability.
Furthermore, the value of RTi6Al4V for control 3 was 1.00E+11 ± 9190 GΩ, a significant value in comparison to the coated samples for which the resistance value was 1.50E+08 ± 2120 GΩ for control 1, 11.00 ± 0.00 GΩ for control 2 and the inclusion of silver decreased the resistance inversely to the concentration. RTi6Al4V decreased because Ca-P and Ca-P-Si coatings present an ionic nature. This ionic nature increased with the metallic nature expressed by the silver, for this reason, the coatings with silver inclusion exhibit an increased conductivity and decreased RTi6Al4V. The resistance of the uncoated material was high and decreased when the coating was applied. This drop in resistance in the relative order of 105 was not a drastic change about corrosion processes, which could degrade the material faster. Also, it is an expression of the bioactive behavior of the coatings, which was validated with the data obtained for Ccoat.
Capacitance values obtained for the different coatings were smaller compared to control 3 that had a capacitance of 36700 ± 17900 nF. For Ccoat the inclusion of silver decreased capacitance values compared to controls and indicates the coatings stability. Because the flow of electrons was accumulated on these components, i.e., electronically silver was charging the capacitor, and its inclusion carries the capacitance values at lower levels. These levels turn the coating on elements less active than the uncoated substrate. It was concluded that the most bioactive coating is Ca-P 0.2Ag followed by Ca-P-Si 0.4Ag, Ca-P-Si 0.2Ag, Ca-P 0.4Ag, Ca-P-Si and Ca-P, being less bioactive those without silver presence. Additionally, for all the coatings as it had been described by other investigators, the material resistance RTi6Al4V was higher than the resistance of the porous layer of the coating Rcoat[30], which has an influence on corrosion but do not contribute significantly to the protection of the substrate[31]. I.e., bioactive coatings not necessarily have to fully protect the substrate from corrosion, because thermodynamically they would be stable in the range of physiological pH, where the degradation reactions will not have significant corrosion rates. On the contrary, they will symbolize reabsorption of the coating in the interaction with the osseous tissue.
Regarding the relationship of the morphology with the electrochemical behavior, the phase of Ccoat indicated that the pores and surface roughness of the coatings were uniform because the value for the different samples were 90 %, i.e., with the process of PEO employed the dielectric breakdown was reached to create plasma micro-discharges. Moreover, this breakdown in 270 V created a uniform porous coating on the substrate, as other investigations have been reported. After 350 V, the coating exhibited structural defects such as cracks, with the trend of an apparition in higher voltages up to reach 600 V[9]. This coating uniformity was observed in SEM images [Figure 1]and promoted the flow of current in the sample, because point defects in the structure would prevent and decrease the reaction rate of the interface SBF- Coating[15]. The coatings more stable were Ca-P 0.2Ag and Ca-P 0.4Ag, which in turn had more uniform thickness. An appropriate ratio between the coating thickness with low pore density displayed better corrosion resistance compared with other coatings obtained by PEO[29]. Regarding the phase of CTi6Al4V, the value is approximately 60 % for the different coatings, which symbolizes the greater presence of defects. These defects have a relationship with the first layer of amorphous oxides generated in the anodizing process in the material.
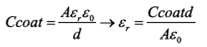
For analysis of data obtained by M-S, Eqs (1) and (2) described above were used. The value of dielectric constant of the material was determined by Eq. (5) where its relationship with the capacitance of the coating was presented.
 (5)
(5)
Where A is the area of contact of the sample with the SBF solution in the electrochemical cell, which has a value of 0.8 cm2 and d is the thickness of the coating obtained which is shown in cross sections images obtained by SEM in Figure 1(a) for Ca-P and Figure 1(d) for Ca-P-Si. The average values were 4.32 µm and 2.62 µm, respectively.
Figure 6 shows the results obtained for M-S, the calculation results of the dielectric constant (εr) of the coatings, the slope (m) [Figure 6(a)), the carrier density (Nb) and the flat band potential (Efb) [Figure 6(b)). The M-S results showed lower capacitance values for coatings with silicon and silver inclusion. Slope values were calculated in a range of 0 to 0.6 V. These data represented the dielectric system of the coatings corresponding to a typical behavior of an n-type semiconductor having a positive slope[24].
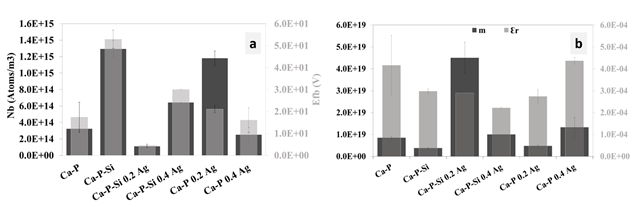
Figure 6 M-S results in coatings obtained by PEO. a) Calculate values for Efb and Nb. b) Calculated values for m and εr
The results of the slope shown in Figure 6(a) corroborated an n-type behavior for all coatings, where charge transference was performed preferentially through the interstices present in the coating. The dielectric constant in conjunction with flat band potential presented that Ca-P was more conductive than Ca-P-Si and the inclusions of silver in all coatings improved the conductivity. Ca-P-Si was less conductive than Ca-P due to the ionic behavior of silicon in the coating. Coatings with silicon incorporation showed more conductivity with silver inclusion in low concentration than for the high concentration (0.2 g/L and 0.4g/L of silver sulfate). For larger amounts of silver included, the presence of silver oxides increased, which is corroborated with the XRD pattern, presented in Figure 2. In this way, silver oxides generated an ionic behavior. Oxides were not found for Ca-P samples, so this phenomenon was not observed for them. The carrier density for the different coatings presented in Figure 6(b) was between 1013 cm-3 and 1015 cm-3, a smaller value than the one reported by other researchers of 1022 cm-3 for PEO coatings obtained with other electrolyte solutions; these high concentrations of carriers are related to oxygen vacancies in the TiO2 layer achieved by PEO[24].
3.4. EFM
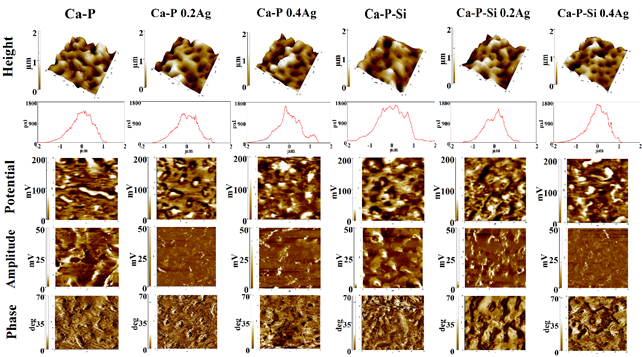
The purpose of EFM test is to analyze the surface potential respect to the parameters obtained in the EIS and M-S characterization. Figure 7 shows the results of the signals obtained, the behavior of the different coatings were similar despite their different composition. From height and potential signals using the software XEI® (Park Systems), the average values of roughness (Ra) and potential were obtained for a quantitative comparison. The values were presented in Table 3. For values of phase and amplitude, an analysis of polarizability of the surface charge on the coatings was performed.
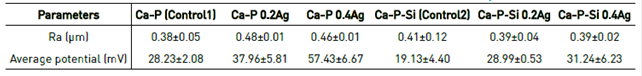
Values obtained for roughness corroborate SEM information, where no significant morphological changes between the coatings were observed, and no structural defects such as cracks were shown in the material. The values correspond to relatively smooth surfaces with roughness between 380 nm and 480 nm. Roughness values varying between 400 nm and 700 nm have been reported for PEO coatings obtained with different electrolyte compositions[30].
By SKPM the potential of the surface of the sample was obtained, this potential was measured detecting a capacitive electrostatic force that is a function of the surface potential and an applied bias voltage to separate the electrostatic force component from other force components such as van der Waals force, chemical bonding force and magnetic force. The electrostatic force is modulated applying an AC bias voltage, and the resulting modulated component of the measured force is detected by lock-in detection[32]. This measurement is usually performed in a liquid medium when is looked to analyze the effect of an ionic electrolyte in the interface electrolyte-material, even when it is required to analyze the behavior of protein adhesion on a surface[33].
In this work the measurement was developed without an electrolyte to identify the polarizability of the surface and the effects of the microstructure on the surface potential, the influence of silicon inclusion by PEO, and silver inclusion by electrophoresis. Results showed that between Ca-P and Ca-P-Si the value of surface potential was smaller with the inclusion of silicon in the coating. Regarding the silver inclusion, it increased the potential values for both coatings. Even, surface potential is bigger for Ca-P with the highest concentration of silver. These values of surface potential were inversely proportional to the dielectric constant of the material presented in Figure 6(b). The dielectric constant was greater for Ca-P than for Ca-P-Si coatings. However, the silver inclusion in high concentration in Ca-P-Si coatings decreased the constant value as an expression of the grown in the material permittivity. This relation did not happen in Ca-P coatings where with low silver concentration the constant decreased, but with high silver concentration, the constant increased more than for the control sample; which may be related to the coating oxidation for the growth of silver ions in the structure.
Amplitude images had a similar distribution for the different coatings and were reflections of the morphology described. Regarding the phase images, bigger differences between samples were not observed. The phase represented the predominant electrical domains in the coatings and EFM phase shifts were presented as different colors, with a bright color in the EFM scan indicating an attractive interaction between the tip and the sample and a dark color representing repulsive interaction, EFM phase shift measurements may be used to map the charge distribution of a sample[34]. The domains distribution on the coatings surface was neutral. Pores had a negative phase domain and the rest of the coating a positive one. Ag inclusion affected the positive domains. Coatings may have a preference of association with cells or proteins opposed to their domain. For future work, EFM measurements must be performed in liquid medium with SBF to identify the effect of the electrolyte in the distribution domain for the coating.
4. Conclusions
Coatings with electrochemical stability, potential osteosynthesis capacity, and nanostructured porous morphology were obtained by plasma electrolytic oxidation, combining an oxidation step of anodizing without reaching the dielectric breakdown and a step of incorporation of ions by electrolytic plasma without reaching the dielectric fracture. The ions incorporated were calcium, phosphorous and silicon with the purpose of obtaining semi-crystalline structures in the bone-forming coating. In addition, silver ions were included due to their antibacterial capacity to avoid biofilm formation and possible infections in the surgical site.
Electrochemical results allowed the identification of the protection provided by the coating of the material and the behavior of the flat band potential established a relationship between the differences in the silicon and silver inclusion with conductivity.
Under the assumption that both the conductivity and the surface potential defines the biocompatibility of a coating for osteosynthesis purposes, the most bioactive coatings were those with silver inclusion following the order Ca-P 0.2Ag, Ca-P-Si 0.4Ag, Ca-P-Si 0.2Ag, Ca-P 0.4Ag, Ca-P-Si, and Ca-P. Furthermore, the most stable were Ca-P 0.2Ag, followed by Ca-P 0.4Ag, Ca-P-Si, Ca-P-Si 0.4Ag, Ca-P-Si 0.2Ag and Ca-P. Likewise, surface polarizability showed that silicon inclusion on the coating decreases the surface potential in comparison with Ca-P coatings, and silver inclusion for both coatings increased the surface potential proportional to silver concentration.

