


 English (pdf)
 Article in xml format
 Article references
 Send this article by e-mail
 Cited by SciELO
  Cited by Google
  Similars in
SciELO
Similars in
SciELO  Similars in Google
 Permalink
1. Introduction
Due to the growing need for production and storage of energy in a safe and environmentally friendly way, in the recent decades many researchers have focused on the development of solid polymer electrolytes (SPE) as essential component in various electrochemical devices. The SPE are polymers with insulating properties mixed with substances that provide ions such as salts and acids. These ions, which are coordinate with polymer atoms, provide the ionic conduction required for applications in rechargeable batteries, electrochromic windows, fuel cells and humidity sensors, and in wide variety of portable devices[1]. The diversity of shapes and sizes, and the operating conditions of these devices, have generated great interest in the search of SPE with properties such as higher ionic conductivity (σ ( 1x10⁻⁵ S cm-1), better mechanical flexibility and wider thermal and electrochemical windows. In this context, previous studies of composites obtained by combinations of solid electrolytes with fillers as Al2O3, SiO2 and TiO2 have reported an enhancement in the ionic mobility due to increases in the amorphous phase, without loss of mechanics, thermal and electrochemical properties[2].
Up to date, the fillers play an important role in the properties of composites. For example, in polymer electrolytes formed with polyethylene oxide (PEO), the fillers affect the polymer dipoles orientation in their ability to align dipole moments[3], whereas the thermal history determines the flexibility of the polymer chains for ion migration[2]. Usually, the addition of fillers in SPE like PEO with alkaline salts, improves the transport properties, the resistance to crystallization, and the stability of the electrode/electrolyte interface[2-4].
In general, the increase in conductivity of solid electrolytes at room temperature has been the main goal of investigations in this field. In this regard, some of the most relevant changes in conductivity of polymer electrolytes added with fillers have been explained in literature by: i) the interactions of filler grains with ions creating pathways of high conductivity in the vicinity of grains, and weaken the association between ion pairs and enhance the transference number[5-] [10]; (ii) the higher fraction of amorphous phase in the polymer host at room temperature; (iii) the size and chemical composition of filler able to penetrate into the polymer matrix and interact with components of composite[11,12]; (iv) the filler-filler interactions that allow the formation of percolation network for ions, which avoid the crystallization of polymer increasing the amorphous phase between filler grans[13]; (v) the availability of charge carriers and the coordination sites on the polymer electrolyte[14,15].
In order to get a better understanding of what causes the observed changes in composites conductivity, various techniques of characterization have been used. The IR and Raman spectroscopy have been widely used for polymer electrolytes and composites characterization[2-17], because they allow identifying and quantifying of specific intra and inter polymer chain molecular interactions. Spectroscopy studies on the PEO-LiCF3SO3 system, showed a series IR bands assigned to ion CF3SO3, which change when its environment is modified by the presence of polymer[18]. Ion-polymer, ion-ion, polymer-filler and polymer-ion-filler interactions are studied by Raman and X ray diffraction (XRD); variations of width, intensity and shift of the bands with the formation of other peaks of specific bonds give information regarding some of these interactions[19].
The changes of conductivity previously reported in systems such as PEO/CF3COOLi[20] and PEO/CF3COONa[21], have motived us to the study of the composite formed by PEO/CF3COONa added with Al2O3 as filler, with the goal of increasing the conductivity in this system and knowing more about the interaction polymer-salt, polymer-filler and electrolyte-filler. In this paper, we studied the (PEO)10CF3COONa + x wt.% Al2O3 system by XRD, Raman, and IR to obtain information about changes in crystallinity due to interactions between the components of system. Additionally, we analyzed membranes morphology by AFM and obtained roughness root square medium (RRSM).
2. Experimentation
PEO (molecular weight Mw = 1x10⁶) and CF3COONa were purchased from Aldrich and dried under vacuum conditions ((500 Pa). The reactants were stored in dry atmosphere with silica gel and then weighed in a 10:1 ratio (EO: Na) before being dissolved separately in acetonitrile while magnetically stirred for four hours. Both solutions were combined and stirred for other four hours. Subsequently, Al2O3 ((150 mesh and 50 Å of size pore) was added at percentages of 0.0, 3.0, 10.0, 20.0, 30.0 with relation to the whole electrolyte (i.e, x = wt. Al2O3/ (wt. Al2O3 + wt. (PEO)10CF3COONa) *100 %). The mixtures were constantly stirred magnetically to prevent Al2O3 particles decantation and to ensure the uniform dispersion in the electrolyte. The mixtures were casted in a glass Petri dish where the solvent evaporated slowly at room temperature inside a desiccator under dry conditions. The resulting membranes had mechanical consistency with thickness between 150 ( 10 (m and 200 ( 10 (m.
The samples of (PEO)10CF3COONa+ x wt.% Al2O3 were analyzed by XRD on a Siemens D5000 system employing the Cu K( wavelength with a grazing incidence angle of 3°. The IR spectra were obtained with a Nicolet 750 Fourier transform infrared system. Raman spectroscopy was carried out on a Horiba Jobin Yvon LabRAM system, employing the 632.8 nm of one HeNe laser as an excitation source. The morphology was analyzed with atomic force microscopy (Autoprobe CP Research), and the Roughness Root Square Medium (RRSM) was obtained with the WSxM software[22].
3. Results and discussion
3.1 X ray diffraction
Figure 1 shows the XRD patterns for pure PEO, solid electrolyte (PEO)10CF3COONa (x = 0.0% ) and (PEO)10CF3COONa + x wt.% Al2O3 for different x values (x = 3.0; 10.0; 20.0; 30.0). The XRD pattern of pure PEO membrane shows the characteristic peaks for this polymer at 2θ = 19.3° and 23.6°[7, 23].
In the polymer electrolyte PEO10CF3COONa diffractogram (x = 0.0% in Figure 1), new peaks at 19.4°, 24.1° and 25.0°, compared to PEO diffractogram, are observed. These peaks correspond to the crystalline nature of new complex (PEO10CF3COONa) formed by the coordination of alkaline ions like Na+ with oxygen atoms of PEO. The decrease in the crystallinity of pure PEO, is evidenced in the decrease of the intensity of the peaks at 19.3° and 23.6°[8]. The results obtained for PEO10CF3COONa are consistent with DSC results reported by J. Castillo et al. [21].
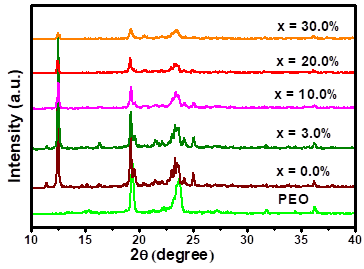
Figure 1 X ray diffractograms membranes of pure PEO and (PEO)10CF3COONa + x wt.% Al2O3 (x = 0.0; 3.0; 10.0; 20.0; 30.0)
On the other hand, diffractograms of the composites (PEO)10CF3COONa + x wt.% Al2O3 show a remarkable reduction of the XRD peaks intensity as the Al2O3 concentration increases. The reduction of the peaks intensity is attributed to the reorganization in the PSE structure and to an increase in the amorphous phase by adding Al2O3. The increase of amorphous nature give more flexibility to the backbone, resulting in a composite with greater ionic diffusivity and a higher ionic conductivity than the PEO10CF3COONa, as previously was reported by N. M Jurado et al. [24].
3.2 Raman spectroscopy
Figure 2 shows the Raman spectra of the PEO pure, the salt CF3COONa and the (PEO)10CF3COONa + x wt.% Al2O3 composites studied. The broad peak present at 235 cm-1 (a in Figure 2) has been assigned to the disordered longitudinal acoustic mode (D-LAM) of PEO[25]. The same peak is observed, without significant changes, in the spectrum of PEO pure and (PEO)10CF3COONa, and on all composites added with Al2O3.
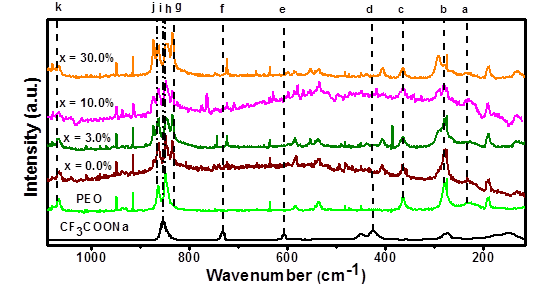
Figure 2 Raman spectra of CF3COONa, PEO, (PEO)10CF3COONa and different Al2O3 concentrations in the electrolyte
The peak shown at 279 cm-1 in the Raman spectrum of PEO (b in Figure 2), has been assigned to O-C-C/C-O-C bending and C-C rocking[25]. The broadening and weakening of this peak as a function of Al2O3 concentration, indicates that the PEO polymer chain tends to adopt different conformations due to the interaction between the ether groups and the hydrogen bonds[16-25]. Similarly, mild changes are observed on intensity and width in spectral line assigned to C-O-C/O-C-C bending vibrations of pure PEO at 364 cm-1, (c in the Figure 2). These variations are due to the changes in the PEO structure by formation of complex with alkaline-metals salts as Li+ and Na+ [25].
The peak observed at 424 cm-1 in CF3COONa spectrum (d in the Figure 2), corresponding to C-C-O-O out of plane bending[26], has been displaced to 404 cm-1 in the solid electrolyte (PEO)10CF3COONa, and its combinations with Al2O3, likely due to the presence of crystalline PEO. This shift in the Raman band by the presence of small crystallites of a different material , has been observed in the combination of polymers such as PEO and PVDF-HFP[27].
The weak spectral line corresponding to CF3 symmetric bending in CF3COONa at 606 cm-1 *[ 26- 28] (e in the Figure 2), is not present in spectra of electrolyte (PEO)10CF3COONa or the composites (PEO)10CF3COONa + x wt.% Al2O3, this indicate that the salt was dissolved in polymer. Additionally, the spectral line corresponding to CF3 deformation umbrella in the salt[29-30] (at 731 cm-1, f in the Figure 2), is displaced to 722 cm-1 when it is combined with the PEO, and all composites added with the filler. These changes in CF3 are attributed to ionic-association in ion-pairs by coordination of anions and cations [ 31-32].
The weak shoulder around 830 cm-1 in the spectrum of pure PEO, which has been previously reported[33] (g in Figure 2), is clearly resolved when the PEO is combined with the CF3COONa and the different filler concentrations. The peaks observed in pure PEO at 848 and 862 cm-1 (h and j in Figure 2), are attributed to the CH2 rocking and C-O stretching vibrational modes respectively[25]. However, a new peak close to these lines (at 872 cm-1) appears in the Raman spectrum when the salt is added, and increases its intensity with the addition of Al2O3. This new spectral line confirms the change in the structure of the PEO chain by interactions ion-polymer. On that subject, it has been frequently observed that systems formed by PEO combined with alkaline salts show dramatic changes in frequency and intensities between 770 and 900 cm-1; these changes are associated to the change in the backbone of the PEO[34]. Further, the increase of the intensity of the new peaks likely is due to interaction filler-polymer that deforms the structure by the presence of filler. In this region, the spectral line that corresponds to C-C stretching of salt appears at 853 cm-1 (i in the Figure 2), which is combined with the spectral lines of PEO indicated interactions from the ion-polymer.
The line corresponding to the combination of C-O-C symmetric stretching and CH2 symmetric rocking at 1,066 cm-1 of PEO[35] (k in the Figure 2) is also present in the electrolyte (PEO)10CF3COONa and the composites with slight changes in intensity and width, due to variations in the conformational structure of polymer.
The appearance of new lines in the Raman spectra when the polymer was combined with salt, confirm the formation of complex; these results agree with the formation of new peaks in the XRD diffractograms of the combination of PEO and CF3COONa. The semi-crystalline character of samples are affected by addition of Al2O3 particles, that addition increase the amorphous phase in the new composite, producing changes in the intensity and broadening of the Raman peaks.
3.3. Infrared spectroscopy
Figure 3 shows the IR spectra for pure PEO, CF3COONa, the polymer electrolyte (PEO)10CF3COONa and (PEO)10CF3COONa + x wt.% Al2O3 composites, between 1,000 and 450 cm-1. For the electrolyte PEO10CF3COONa with low concentrations of Al2O3, the line assigned to CF3 asymmetric bending of in CF3COONa at 534 cm-1 [29-37] (a in Figure 3) overlaps the lines at 508 and 529 cm-1 assigned to C-O-C stretching of in the principal chain of PEO[ 38, 39]; however, for the highest Al2O3 concentration the three peaks are clearly defined.
The line assigned to CF3 symmetric bending at 741 cm-1 in the spectrum of CF3COONa[40] (b in Figure 3), has shifted to 718 cm-1, when was combined with PEO and Al2O3. Similarly, the C-C stretching mode at 820 cm-1 [36-40] in CF3COONa (c in Figure 3) shifted to 803 cm-1 when it was combined with PEO. The line assigned to CH2 wagging in the PEO is observed at 842 cm-1 (d in Figure 3) [18]. At higher concentrations of Al2O3 (x ( 10%), multiples lines appear between 797-872 cm-1.The broad band assigned to CH2 twisting at 991 cm-1 in PEO (e in Figure 3) [18], split into multiples lines at high concentrations of Al2O3. The formation of new lines in the range of 797-892 cm-1 and 992-995 are likely due to the effect of polymer-filler and ion-polymer interactions.
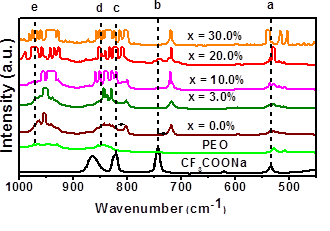
Figure 3 IR spectra of CF3COONa, PEO and electrolyte (PEO)10CF3COONa with different Al2O3 concentrations in (PEO)10CF3COONa, between 1,000 and 450 cm-1
The IR spectra for range 1,000-1,500 cm-1 is shown in Figure 4. For pure PEO, the lines corresponding to the C-O-C stretching mode at 1,061 cm-1, 1,107 cm-1 and 1,149 cm-1, are present [41] (a, b, c in the Figure 4); when PEO is combined with salt and Al2O3 multiples lines appearance. For CF3COONa, two broad peaks are attributed to CF3 asymmetric and symmetric stretching at 1167 cm-1 and 1223 cm-1 respectively[26-29] (d and e in Figure 4).
The broad band present between 1,326 cm-1 and 1,360 cm-1 (f in the Figure 4), corresponding to CH2 asymmetric wagging PEO[42] split into two clear lines when it is combined with the CF3COONa and into four lines when the filler is added. The line corresponding to C-O-O symmetric stretching of CF3COONa observed at 1394 cm-1[29] (g in the Figure 4) is not present either in the spectrum of solid electrolyte (PEO)10CF3COONa or in any of the composites this indicate that salt was dissolved in the polymer. The peak present at 1,412 cm-1 in the spectrum of pure PEO (h in the Figure 4) is displaced to 1,426 cm-1 when it is combined with the salt and increases the broadness when Al2O3 is added. The broad band presented in the spectrum of pure PEO between 1,448 cm-1 and 1,476 cm-1 (i in the Figure 4) is assigned to the combination of CH2 asymmetric bending and CH2 scissoring modes[ 42, 43], Finally, the band corresponding to C-O-O symmetric stretching mode of CF3COONa[29] (j in the Figure 4) is observed to 1477 cm-1. All these broad bands split into multiples peaks for higher concentrations of filler (x ( 10%).
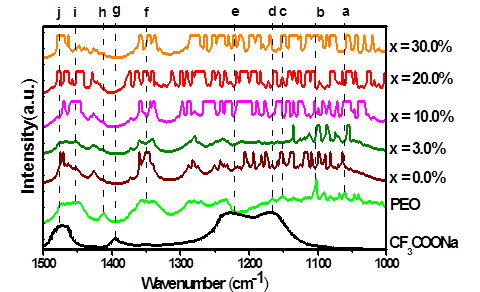
Figure 4 IR spectra for PEO, CF3COONa, (PEO)10CF3COONa and composites (PEO)10CF3COONa + x wt.% Al2O3, between 1,000 cm-1 and 1,500 cm-1
The shift of IR bands of CF3COONa when it is combined with PEO is attributed to changes in the environment of CF3COO- ions that interact with the polymer chain. In addition, the shift of IR peaks of PEO when it is combined with salt is attributed to coordination of oxygen atoms in polymer chain with Na+ ions of the salt. When the Al2O3 is added, the broadness of the peaks increased; it means that the amorphous phase increased, creating conduction pathways in the surface of Al2O3 particles and avoiding crystallization of (PEO)10CF3COONa complex. All these contribute to enhance the ionic mobility in the amorphous phase increasing the conductivity[24].
3.4. Atomic force microscopy
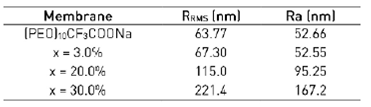
Figure 5 shows three-dimensional AFM images in the range of the scan areas 5 (m × 5 (m for the membrane surfaces of solid electrolyte (PEO)10CF3COONa (Figure 5(a)), (PEO)10CF3COONa + 3 wt.% Al2O3 (Figure 5(b)), (PEO)10CF3COONa + 20 wt.% Al2O3 (Figure 5(c)) and (PEO)10CF3COONa + 30 wt.% Al2O3 (Figure 5(d)) composites. The changes observed in the membranes surface morphology are correlated with the Roughness Root Medium Square (RRMS) and the Roughness Average (Ra), and were computed by WSxM software[22] and reported in Table 1. The increases in the RRMS with the addition of the filler indicates a decrease in crystallinity[44], probably due to the fact that Al2O3 particles are surround by amorphous material.
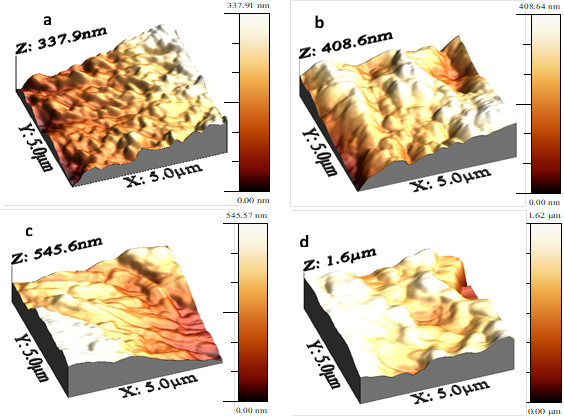
Figure 5 AFM micrographs of: a) electrolyte PEO10CF3COONa; b) composite (PEO)10CF3COONa + 3 wt.% Al2O3; c) composite (PEO)10CF3COONa + 20 wt.% Al2O3; d) composite (PEO)10CF3COONa + 30 wt.% Al2O3
4. Conclusions
The appearance of new peaks, variation in intensity, and shifting of the peaks in the XRD, IR, and Raman spectra for (PEO)10CF3COONa membrane with respective to salt and polymer, confirm the formation of a new complex. The change in the conformational structure of PEO is due to the coordination of polymer with Na+ cations. The changes observed in the salt spectrum by modification of ionic environment, due to interactions of CF3COO- anion with polymer. These results agree with previous studies of impedance spectroscopy and differential scanning calorimetric, where a new endothermic anomaly corresponding to melting crystalline phase, and an enhancement of conductivity are observed in relation of pure PEO[45].
The fraction of crystalline phase in the volume of the new (PEO)10CF3COONa electrolyte is also affected by the addition of Al2O3 particles. The increase in amorphous phase fraction of composites (PEO)10CF3COONa + x wt.% Al2O3 improve the conductivity values, by migration of ions Na+ through the pathways of amorphous phase surrounding the filler. This has been previously reported by N.M. Jurado et al. [24]. The disruption of crystallization of the SPE host matrix, by effect of Al2O3 addition, is evidenced by changes in the intensity and broadness of IR and Raman bands, and by loss of the intensity in RXD diffractograms peaks. In some composites, the increase in the ionic conductivity is proportional to the amorphicity[46], however, for the (PEO)10CF3COONa + x wt.% Al2O3 system, Al2O3 concentrations greater than 3% results in a loss of ionic conductivity due to the blocking effect of filler particles, which hinders the motions of mobile ions.
Similarly, the loss of crystallinity in membranes is validated by the morphology changes observed in the AFM micrographs; further the increases in roughness as a function of Al2O3 concentration point to an increase in the amorphous phase of the membrane[47].

