


 Inglês (pdf)
 Artigo em XML
 Referências do artigo
 Enviar este artigo por email
 Citado por SciELO
  Citado por Google
  Similares em
SciELO
Similares em
SciELO  Similares em Google
 Permalink
1. Introduction
Digital image processing has several purposes, including data treatment aimed at image enhancement [1]. Images taken from satellite sensors also have broad applications, such as the identification and classification of changes in land use [2]. Although the decision to acquire images shall depend on the needs of each study, in some cases it becomes necessary to obtain an image with higher resolution [2].
The Worldview 2 sensor is an example of this situation. The sensor has a spatial resolution of 0.5m for panchromatic images, while its equivalent resolution in multispectral images is of 2m [3]. The two images provide enough information, which permits generating a new image with high spectral and spatial resolution [2]. In this context, image fusion is concerned with the acquisition and combination of the information provided from different sensors (or from the same sensor used in different measurement contexts). The analysis in the present work is based on multi-resolution fusion [4].
Image fusion is a common approach that achieves high spectral and spatial resolution data requirements in a single image. This type of fusion allows integrating multi-spectral and panchromatic images from different spatial resolutions and / or different remote sensing satellites. Merged images provide detailed information about urban and rural environments, which is useful for applications such as urban planning and management. Additionally, image fusion is widely used in the development of projects in various fields such as agriculture, hydrology, the environment, and natural-disaster monitoring services, among others.
Recent fusion techniques include Wavelet-based schemes, which use four- frequency decomposition. In these schemes, three out of four frequencies are high and carry the details of the original image; the remaining frequency is low and carries the original image approximation [2-5]. Also, other techniques have been implemented for resolution enhancement, especially for the enhancement of contours. Such is the case of the Countourlet transforms, which include elongated supports that capture the contours more smoothly [6]. Applications of Countourlet have been reported in [7, 8]. Likewise, Curvelet transforms allow image reconstruction with a lower number of coefficients when compared to the Wavelet [9] and Ridgelet transforms. In fact, Ridgelet constitutes one of the steps in the implementation of Curvelet and provides filtering to produce a fine-scale sub-band [10].
This paper presents an implementation of Contourlet, Curvelet and Ridgelet transforms aimed at defining the contours of the objects that appear in a WorldView-2 image. The image is fused using a Wavelet symlet 5, which yielded the best results when compared with other 25 predefined (Matlab) Wavelets. Performance assessment was based on indices like ERGAS, Universal Quality (Qu) and the coefficient of correlation (CC). The resulting image can be used with other techniques such as mathematical morphology-based object extraction and segmentation, among others. The present study provides tools for the analysis of change detection, environmental studies and multi-temporal studies. The best result was found with Curvelet-based image fusion, in which the Ridgelet transform is used as an intermediate step for the construction of the new multispectral (NRBG) image.
2. Previous concepts
2.1. Wavelet Transform
The Wavelet transform consists in applying signal decomposition by means of certain wavelet functions, which can be obtained from a more general wavelet function (mother function). Decomposition provides a series of coefficients, which should be interpreted and subsequently treated [11]. Formally, according to [12], the Wavelet transform is multi-scale decomposition developed for the analysis of n-dimensional functions, or signals. This transform has proved to be an optimal representation of the original signal as a set of piece-wise smooth signals with a finite number of discontinuities.
2.2 Wavelet Symlet 5
Wavelets can be classified in three groups according to their symmetry, namely symmetrical, almost symmetrical and asymmetrical [13]. The Wavelet Symlet 5 belongs to a family of Wavelets derived from the name “symmetrical Wavelets”. These Wavelets were created with the fundamental purpose of obtaining the greatest possible symmetry from the applicable functions [14].
These Wavelets are not perfectly symmetric, but they were designed to obtain a relatively compact support as well as the highest number of null moments [14].
As this type of Wavelet is not completely symmetric, it has a minimum support in the interval [-p+1, p], with p null moments; yet, it has symmetric filters with respect to the center of its support, where the wavelet concentrates the energy of the image [14]. Additionally, the minimum phase roots (which in other cases are chosen so that the energy concentrations lie near the support point) are chosen from a set having the nearest symmetry but with a complex linear phase [15].
2.3. Contourlet Transform
The main purpose of the Contourlet is to perform a disperse expansion of piecewise smooth images that lack completely smooth contours with a high degree of anisotropy and directionality [6]. The Contourlet offers directionality and contour-capture characteristics; it also has some Wavelet characteristics such as multiscale, time, frequency and localization features [16]. The biggest advantage of this transform is the possibility to improve the contours or provide a smooth representation of such contours using less coefficients than those required by Wavelets. The base functions are oriented in powers of two, according to the number of directions, and allow flexible aspect ratios [17]. The Contourlet transform is twofold, it performs multiscale decomposition and multiresolution decomposition. The Laplacian pyramid is applied from the Gaussian pyramid, decomposing the original image into half its original scale. Thus, the resulting image can be used to predict the values of the next image by means of a Gaussian kernel function [11]. This process is aimed at having lower resolution and point density in each iteration [18]. After every iteration, the difference between two levels provides the Laplacian pyramid levels.
The multidirectional decomposition is completed using directional filter banks (DFB), which are designed to capture high-frequency components. Consequently, low frequencies cannot be analyzed using this method. Because of this, a combination of this analysis with multiresolution schemes is necessary [6].
Multiscale decomposition applies the Gaussian pyramid to the pyramidal directional filter banks (orthogonal and subsampled of order two for each dimension). This scheme generates a sequence of hierarchical spaces that are invariant to shifting and scaling. This is possible since the created subspace is defined over a uniform distribution of intervals that characterizes the approximation of the image to the resolution. Additionally, the details to increase the resolution are stored into the Laplacian pyramid images [11].
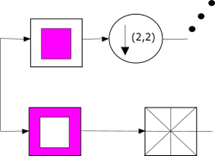
Figure 1 shows the decomposition process performed over the input image; first multiscale-wise and then directional, by means of a fan filter. The latter can also be performed using several filter types such as diamond and square filters [17].
2.4. Curvelet and Ridgelet transform
The Curvelet transform has several characteristics, such as frames indexed according to scale parameters, a high level of specificity in the construction pyramid, and multiscale properties.
Additionally, this transform offers an anisotropic, scalar principle that is not found in standard Wavelets [18]. The transform also shares special scaling characteristics Eq. (1), where the length of the support for the elements and the width are related by:
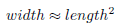 (1)
(1)
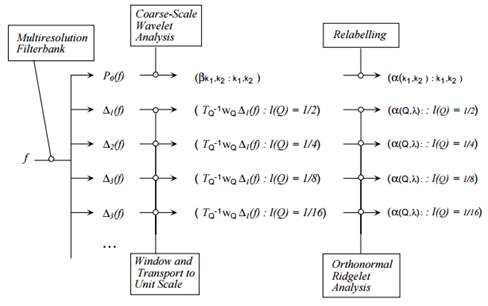
To conduct the Curvelet transform, several steps are involved, including the Ridgelet analysis. Specifically, the stages are as follows:
Sub-band decomposition
The image is divided in resolution bands Eq. (2), defining a filter bank for the sub-band.
 (2)
(2)
Object 𝑓 is then filtered in sub-bands Eq. (3).
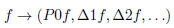 (3)
(3)
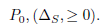
Each band contains specific details of different frequencies; P0 contains the low-pass filter.
Δ1, Δ2, … contain the pass-band filters and the details  associated to the width [19, 20].
Soft surface partition
A collection of smooth windows (𝑥1 𝑥2) is defined. The windows are located around the dyadic grid.
In this stage, the window dissection is applied to each of the sub-bands, which were isolated in the previous stage of the algorithm. To yield the spatial windows, the convention of pixels in the range of 1 to 256 is considered for each coordinate. The coordinates are related based on their spatial position (𝑥1, 𝑥2), which corresponds to the (𝑖1, 𝑖2) position, following the (𝑖ℓ−1)/4096 equivalence [19].
Renormalization
In this stage, each resulting grid from the previous stage must be renormalized (i.e. scale-converted into the corresponding units [19]).
Ridgelet Analysis
Each grid is analyzed in the orthonormal Ridgelet system. This means that, if there is an object (say f) that represents the border, once the filtering is performed in each sub band, each process yields a fine-scale sub-band that should contain a map of the borders, thickened by a factor of according to the sub-band filter operator. This provides the sub-band with a collection of flat ridges. Such ridges are almost straight at fine scales (since the border is almost a straight line) and these fragments represent the ideal input data for the Ridgelet transform [19-21].
Once the coefficients have been used over the Curvelet, it is possible to complete a reconstruction of the Ridgelet to obtain the final transformed image. To this end, the following stages are required:
Step 1. Ridgelet synthesis. Each square is rebuilt upon an orthonormal Ridgelet system.
Step 2. Renormalization. Each resulting square, from the previous step, is renormalized to its own corresponding square.
Step 3. Border integration. This is the inverse of window dissection applied to each of the rebuilt windows in the previous step.
Step 4. Sub-band re-composition. Finally, the sub-band filter banks are undone [19].
Figure 2 shows a schematic representation of the processes involved in the Curvelet and Ridgelet transforms, using DBF for the multiscale decomposition and applying the Ridgelet transform.
3. Methodology
3.1 Study area
The study area was determined by the presence of spatial objects and the possibility to observe border enhancement. The area belongs to the city of Bogota (Colombia), it lies in the northwestern part of the city near El Dorado international airport. The image was taken by the WorldView-2 satellite. To preserve the dyadic condition for the analysis, a cut of 4096 x 4096 pixels was made. The image was acquired on November 15 th , 2011, and it was re-projected onto system UTM/WSG84.
The image contains 8 spectral bands from which only RGB (431) components were used. The spatial resolution is 2m. Also, the associated panchromatic image has a resolution of 0.5m.
3.2. Fused image
From several existing methods, one of the most common methods for image fusion is the standard method, which is based on the transformation of the RGB multispectral channels into IHS [22]. Intensity (I) indicates the total brightness of the color, Hue (H) corresponds to the average wavelength of a color, and Saturation (S) refers to the purity of a color relative to a tone of gray [22].
The fused image was treated from the original RGB image with color composition (RGB-431). As mentioned above, the image was cropped to create the dyadic structure. Subsequently, a first fusion between the multispectral image and the panchromatic image was conducted according to the following stages, using the standard method mentioned above:
Step 1. The size of the pixel in the multispectral image is adjusted to the size of the panchromatic image, completing a transformation between color spaces, from RGB to HSV.
Step 2. The Value component is separated.
Step 3. The Wavelet transform is applied, creating a new image with NVALUE Value.
Step 4. The NVALUE components are concatenated according to the hue and saturation values obtained in step 1.
Step 5. The HSV space is transformed into RGB, using the HS-NVALUE components.
Step 6. A new RGB image is generated.
Step 7. The predefined Wavelets are implemented for 5 levels of decomposition using Matlab; Wavelets such as Daubechies 4 and 7, Coiflet 2 and 3, Haar and Symlet 5 and 8.
The best spectral and spatial assessment results were found for the Symlet 5 Wavelet with the 5 th level of decomposition. The evaluation was based on the spatial index of ERGAS, the universal quality index (Qu), and the spatial and spectral correlation index.
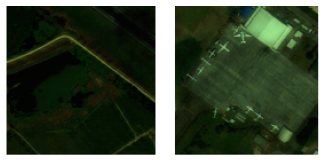
Figure 3 shows two zones corresponding to the northwestern side of the airport, where several airplanes placed on a surface of concrete can be observed; also, a nearby water body appears. In both images, spatial resolution enhancement is observable with the naked eye after applying the Contourlet, Curvelet and Ridgelet transforms.
Satellite image fusion using Contourlet, Curvelet and Ridgelet
A standard procedure for the images was conducted according to the steps below. As a result, two images were obtained from the three transforms. This is because the Ridgelet transform is immerse into the Curvelet transform, as mentioned above. The general process was performed as shown in Figure 4.
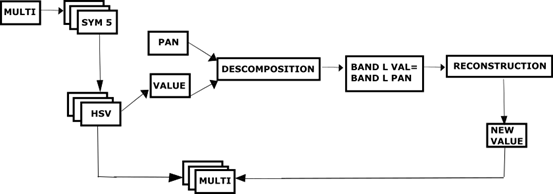
Figure 4 General schema for the implementation of transforms Contourlet, Curvelet and Ridgelet. Made by the authors
The steps outlined in Figure 4 are described as follows:
RGB color space transformation into HSV is conducted by separating the Value component over the Wavelet Symlet 5 image. This color space was chosen because, in terms of intensity, it provided better results while preserving the spectral and spatial image information.
Countourlet, Curvelet and Ridgelet transforms are applied to this component and to the panchromatic image.
The first component is extracted from the resulting coefficients of the panchromatic image and it is replaced on the Value.
Figure 5a shows the generated coefficients when implementing the transforms. The component replaced on Value corresponds to the L band from the PAN. In 5b, the first high-precision coefficient is taken from the PAN over the Value.
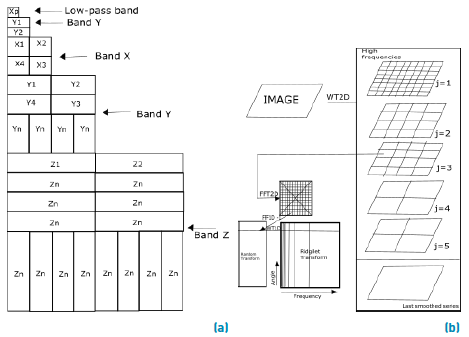
Figure 5 a) Coefficients generated by the Countourlet transform. b) Coefficients generated in the Curvelet-and-Ridgelet transform [23]
A reconstruction is performed, obtaining new images from N-VAL Value for both the Countourlet and Ridgelet-Curvelet transforms.
Concatenation is conducted for the N-VAL images including the hue a saturation images.
The last step involves transformation into the RGB space for the HSN-VAL image, considering the images obtained from the Contourlet and Curvelet-Ridgelet transforms.
4. Results and discussion
The results presented below correspond to the fused Symlet 5 image with decomposition level 5. The spatial resolution was assessed using the Contoulet, Curvelet and Ridgelet transforms with respect to the fused image.
Figure 6, shows the results obtained from the fusions applied to the fused image using the Contourlet, Curvelet and Ridgelet transforms. As can be observed, there is improvement in terms of shape, size, color and borders when looking at the constructions and the airplanes in the images, especially when comparing these objects with the original image.
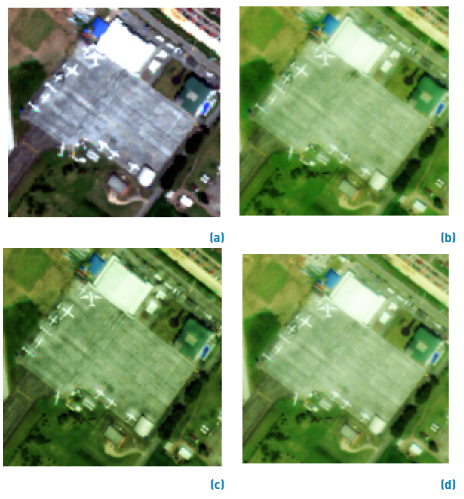
Figure 6 a) Original RGB (431) sub-image. b) Fused sub-image. c) Fused image obtained from the Countourlet transform. d) Fused image obtained from the Curvelet and Ridgelet transform
4.1. Assessment using statistical methodsFigure 9
To assess the performance of the proposed image processing using statistical methods, a tool called “Image analysis index” [21], implemented in Matlab, was used. The tool estimates the difference in the spatial resolution of the fused images obtained with the Countourlet, Curvelet and Ridgelet transforms, and that of the fused image obtained with the Symlet 5 Wavelet. To this end, the ERGAS spatial indices, the universal quality index (Qu) and the correlation spatial index are used [24, 25].
ERGAS Index
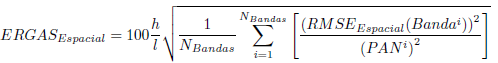
Spectral ERGAS (for the French words “Erreur Relative Globale Adimensionalle de Synthèse”) is given by the following Eq. (4):
 (4)
(4)
Where h and l represent the spatial resolution of the panchromatic and multispectral images [22]. N Bands is the number of bands of the fused image; and i PAN is the value of the radiance in the i-th band of the image [26, 27] (see Table 1].
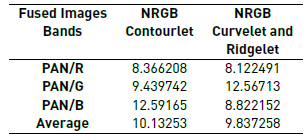
Table 1 shows the results after calculating the spatial ERGAS index. As can be observed, the best values, on average, correspond to the image obtained with the Curvelet and Ridgelet transform. For this image, the red canyon exhibits the best index (i.e. 8.12). Likewise, it was evident that the image obtained using the Contourlet transform showed the lowest values.
For the analysis, Figure 7 shows two planes taken from the images under assessment. Using the spatial ERGAS index, the results indicate that the best image is the one obtained with the Curvelet and Ridgelet transform. This result can be associated to the observable image as a shadow enhancement on the white color of the airplane, also as a better definition of the runway around the objects.
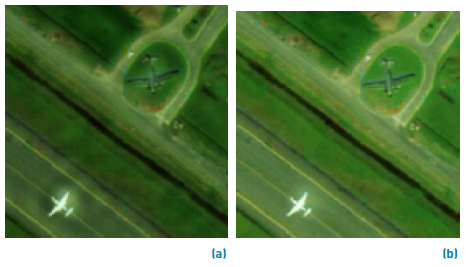
Figure 7 a) Fused sub-image using the Countourlet transform. b) Fused sub-image using the Curvelet-and-Ridgelet transform
Universal Quality Index (Qu)
Universal Quality provides a model for a quality index Eq. (5), namely the index identifies any distortion as a combination of three factors: correlation loss, illuminance distortion and distortion contrast [26-29]. The best values on this index are obtained when the value is closer to one.
Let  and
and  , for an original signal or an original image, respectively. The proposed quality index is defined as:
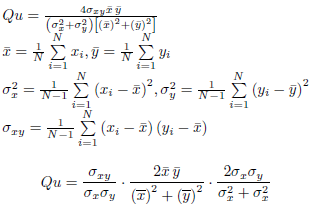 (5)
(5)The first component is the correlation coefficient between
x
and
y
, which measures the degree of linear correlation between
x
and
y
, and its dynamic range is [-1,1]. The highest value, 1, is obtained when 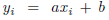 for
for  , where a and b are constant and
  . Despite the linear relation between x and y, some relative distortion may exist. Distortion can be evaluated in the two components, which are assessed in the second and third component. The second component, with a range of values in [0,1], provides a measurement of the amount of luminance between x and y. This value is equal to 1 if and only if
  and
and  can be seen as an estimation of the difference between
x
and
y
, therefore the third component is a metric of the similarity between the contrast of the images. These values have also range [0,1], where the highest value of 1 can be achieved if and only if
can be seen as an estimation of the difference between
x
and
y
, therefore the third component is a metric of the similarity between the contrast of the images. These values have also range [0,1], where the highest value of 1 can be achieved if and only if  [26].
[26].
The results of the Qu index can be seen in Table 2. It is evident that the values associated to the generated images obtained with the Contourlet and Curvelet transforms preserve the spectral resolution and yield little loss of correlation with respect to the original image, where the values of the three RGB bands are close to 1, namely with indexes 0.84, 0.85 and 0.80 (see Table 2].
Table 2 Qu index for the spatial analysis of the generated images using Contourlet, Curvelet and Ridgelet transforms
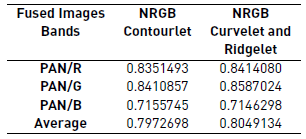
Figure 8 presents a body of water with aquatic vegetation inside the study zone. The results for the universal quality index applied to the fused images using Curvelet and Ridgelet are the best. In this image [Figure 8(b)), better defined coverages can be observed since the areas with less aquatic vegetation tend to mix.
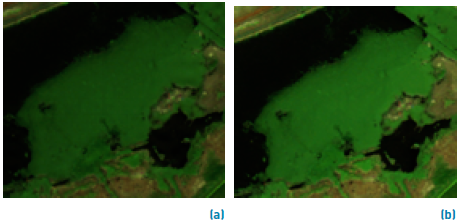
Figure 8 a) Sub-image fused using the Contourlet transform b) Sub-image fused using Curvelet and Ridgelet transform
Correlation Index
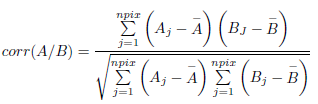
This index is estimated between the different fused bands and the original multispectral image Eq. (6). The main purpose is to obtain an index of preservation of the spectral resolution [6, 22].
 (6)
(6)
Where  are mean values from the corresponding images. This index can vary from -1 to 1. Table 3 shows the index per band as computed for both fused images (see Table 3].
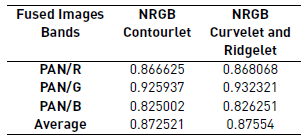
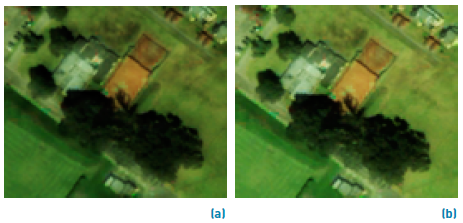
Figure 9 a) Fused sub-image using the Contourlet transform. b) Fused image using the Curvelet-and-Ridgelet transform
Figure 9, shows a mixed picture corresponding to buildings and some vegetation. Although good results were found in both sub-images, the best results were obtained when using the Curvelet and Ridgelet transforms (i.e. an average of 0.87 for the assessed bands).
5. Conclusions
Previous research has shown that the fusion methods based on the Wavelet transform are more suitable for image fusion than conventional methods [5, 22, 24]. The implementation proposed using the Curvelet-Ridgelet mathematical development allowed obtaining the best fused image based on WorldView-2 images.
The results obtained from the qualitative and quantitative analyses show that the image created using the Countourlet transform yields good results in terms of border enhancement. Quantitatively, the value of the Correlation, ERGAS and Qu indices are very similar; however, they are slightly higher for the case of Curvelet-Ridgelet. The proposed methodology allows obtaining fused images that provide users with detailed information about urban and rural environments, which is useful for applications like urban management and planning. The usefulness of the present proposal may be extended to project development on diverse fields such as agriculture, hydrology, environmental and emergency management (associated to natural disasters like flooding, forest fires, etc.), and mapping generation, among others.
All the transforms involved in this study achieved significant results both visually and mathematically with respect to the different spatial objects under analysis. The indices applied indicate that there is preservation of the spatial resolution. However, it is important to consider that the original image used for this procedure corresponds to a fused image processed according to the Symlet 5 Wavelet with decomposition level 5, rated as the best choice among a series of Wavelets studied, which included Daubechies 4 and 7, Coiflet 2 and 3, Haar and Symlet 5 and 8, for 5 levels of decomposition. It can also be observed that different results are obtained depending on the fused Wavelet used in the first process. Finally, the findings indicate that the best outcome in terms of border enhancement on a WorldView-2 image, fused with Wavelet, is the one obtained when applying the Curvelet-and-Ridgelet transform.

