


 English (pdf)
 Article in xml format
 Article references
 Send this article by e-mail
 Cited by SciELO
  Cited by Google
  Similars in
SciELO
Similars in
SciELO  Similars in Google
 Permalink
1. Introduction
Reduction of conventional energy sources and awareness of green energy to save the globe have resulted in utilization of Distributed Energy Resources (DER). Wind energy is one of the best alternatives, which is environment friendly, naturally available resource. The increased installation of wind power plants had highly contributed to meet the growing demand of electricity.
The selection and classification of wind sites is the primary requirement for successful production of wind energy, as it totally depends on the wind velocity [1]. After the use of conventional induction generators, doublé output induction generators, were used to operate wind generators at various shaft speeds [2]. Load flow analysis was done to improve the PQ bus and for modelling the generator at steady state [3]. The penetration of wind energy reduces the line losses and with an effective reactive power control the voltage profile of the power system network was improved [4]. Optimal accommodation and smart operation of Renewable Energy Resources (RES) have minimized the energy losses in the power system network [5]. Wind power curtailment has been monitored and assesses the adequacy of availability of wind energy [6]. Furthermore, to increase the efficiency of the wind power generation and to use within three phase unbalanced load flow analysis, Doubly Fed Induction Generator (DFIG) and permanent magnet synchronous generators were introduced [7].To overcome the variability, in wind flow a flexible despatch margin was proposed. This flexible despatch margin provided flexibility in scheduling the hour-ahead energy market [8]. Furthermore, to produce constant power output while integrating the wind power plant, battery energy storage system was used as a hybrid which has considerably improved the power despatch capability of the system [9]. To have a frequency regulation in the power system network co-ordinated control of wind energy conversión system and battery energy storage system was introduced. This gave an active power control and frequency control for variable wind speed conditions [10]. To enhance active power control a distributive model predictive control using fast gradient method was proposed [11].
The Newton - Raphson method is one of the best conventional load flow solution method which uses the current injection at each node through rectangular co-ordinates. This method provides a faster power flow solution with less number of iterations [12]. Furthermore, to have comprehensive load flow analysis, a new NR method was proposed which has provided effective active and reactive power control [13]. Previous NR methods had many limitations and were not suitable for ill conditioned distributed system. Hence a new modified NR method was introduced which was a continuous versión suitable for numerical integration techniques and solved load flow for ill conditioned system [14]. With the introduction of micro grid, the conventional NR load flow method was difficult for implementation in islanded micro grids. Hence a simple, efficient NR method was proposed to compute power flow for micro grids [15].
In this paper, the impact on integrating wind energy in a practical distribution system is developed using time series analysis. A practical test system with highly unbalanced load profile is taken and the power flow is run through NR method. The NR method used here is a modified version of the NR method using current injection method to compute the load flow analysis. Based on the inference, nodes are identified and wind generator is integrated along with continuously variable load profile. Time series analysis provides a better approach to study the dynamic behaviour of the power system network. The results are validated in an IEEE 123 test feeder and compared with and without integration of wind generator. The second section gives the modelling of wind generator and the third section gives the formulation of NR method. Fourth section explains the IEEE 123 test feeder description and fifth section gives the results and discussions over the implementation in the practical distribution system.
2. Wind generator Modeling
The wind generator is modeled as a PQ bus assuming the system real power and with the given power factor the reactive power consumed is calculated. Wind turbine can be operated either with fixed speed or variable speed. Fixed speed induction generator is directly connected to the grid, but the wind turbulence of the system will result in power variations and hence affects the power quality of the system. Hence for a variable speed wind generator, the generator is controlled through power electronic controller [16].
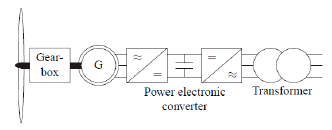
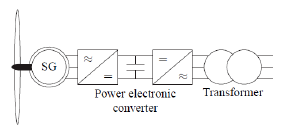
Fig. 1 shows the wind energy conversion system with induction generator. In this paper, when induction generator is used the wind turbine is connected through a gear box. The gear box is designed to produce máximum rotor speed of the generator. The stator of the generator is connected to a power electronic converter. When a synchronous generator is used as shown in Fig. 2 the generator is designed with multiple poles, hence gear box is not needed. The converter consists of an uncontrolled rectifier, a boost converter and a three phase pulse width modulated inverter [17].
Aerodynamic modeling:
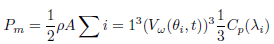
The mechanical input power P m at the shaft is given in (1)
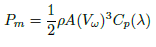 (1)
(1)
where 1.25Kg/m
3 is the air density.
1.25Kg/m
3 is the air density.
A= is the area of the rotor.
 is the wind velocity.
 is the aero dynamic power co-efficient.
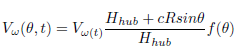
For a three blade wind turbine the distance of each Blade from the ground as a function of its angular position  is given in (2)
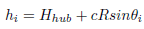 (2)
(2)
where i = 1…3
H hub is the hub height. C < 1 which defines the distance of aerodynamic center of the blade from its root.
 (3)
(3)
The total input mechanical power on the shaft is given in (4)
 (4)
(4)
where i = 1…3
3. Newton - Raphson Load Flow Analysis
Load flow analysis is carried out to determine the voltaje and power flow of a practical distribution system. Many methods are available for performing load flow analysis. In this paper, Newton - Raphson method is used to run the power flow as it is suitable for mesh network. NR power flow modeling consists of two sets of equations. The first set of equations describes the current injection from the load into the system. They are split into real and imaginary parts as given in (5) and in (6).
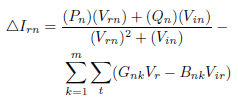 (5)
(5)
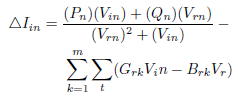 (6)
(6)
where
△I is the current injection in the bus
n is the bus number.
t represents all phases connected to the bus.
P is the real power of the load.
Q is the reactive power of the load.
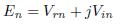
If E n represents voltage of the bus such that
V rn is the real portion of the voltage
V in is the imaginary portion of the voltaje
 (7)
(7)
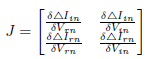
With the current injections calculated the voltage updates are calculated through:
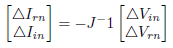
where J -1 is the inverse Jacobian.
 (8)
(8)
For any bus k the real and reactive power of the network is given in (9) and (10)
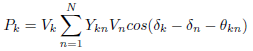 (9)
(9)
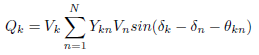 (10)
(10)
Equations (5), (6), (7) and (8) are frequently used to calculate the nodal voltages, using current injections into the system through NR method. Equations (9) and (10) are used to compute the real and reactive power flow in the line.
4. System Description
The IEEE 123 Node test feeder is taken for demonstrating the power flow and realizing the impact of wind energy integration. Fig. 3 shows the line diagram of the IEEE 123 test feeder [18].
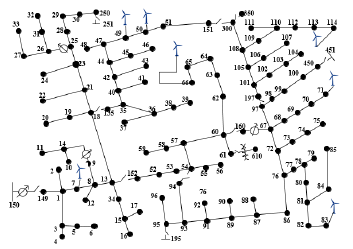
The IEEE 123 test feeder is a practical test system with a source voltage of 115 KV and a nominal voltage of 4.16 KV. This feeder is taken for time series analysis as this feeder is a lengthy feeder and has voltage drop problems. This voltage drop problems are solved by adding four step type regulators at necessary locations. It consists of a mesh network with enough inter connectivity switches, which can be optimized as per the requirement. The feeder consists of overhead and underground lines with various phasing. It has a combination of all loads such PQ, constant current and constant impedance loads and is unbalanced.It is a highly unbalanced system with three phase and single phase laterals with all the loads being spot loads. The system has an inline distribution transformer with a nominal voltaje of 4.16 KV for a small span of the network. It has 85 spot loads, out of which 15 loads are constant impedance loads, 13 loads are constant current loads and 57 loads are PQ loads. The total real power at phase A is 1420kW and in phase B it is 915kW and in phase C it is 1155kW. The network has two regulators with 24 three phase laterals and 10 single phase laterals. It has four inline shunt capacitors to maintain the voltaje profile. The feeder is well behaved and does not have a convergence problem. The power flow is carried out using Newton - Raphson load flow analysis. For running the power flow the line to neutral voltage is considered. At the substation the line to neutral voltage is 66.397 KV and the voltage at the distribution transformer end is 2401.847 V.
5. Results and Discussions
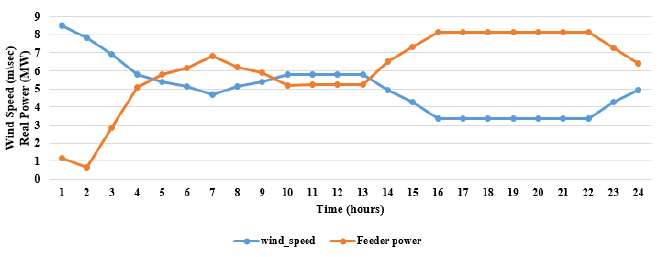
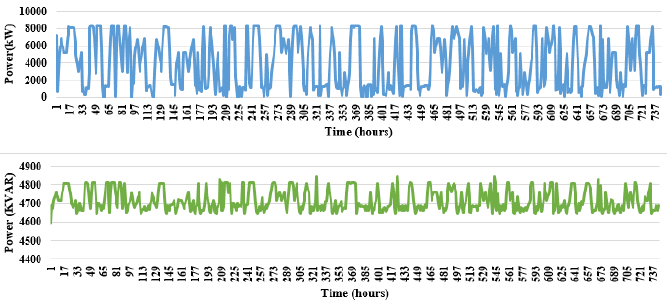
The load flow analysis is carried out in the IEEE 123 test feeder and the output is analysed using time-series simulation and the impact of wind energy integration is analysed by taking time step values of power and voltage during the month of July, when the wind source is maximum. The wind data for the complete year have been taken and integrated in the program. Wind energy is totally depending upon the wind speed in that particular location. To illustrate this, time series simulation was carried out for one day in a time step of one hour resolution. In Fig. 4 we have compared the feeder power and the wind speed, it is observed that when the wind speed increases the feeder power reduces and vice versa.
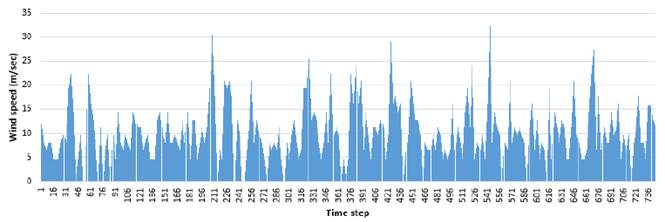
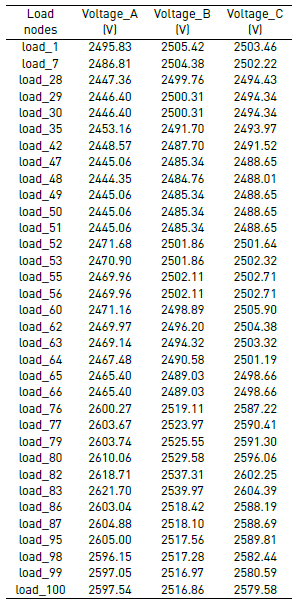
Wind generator is proposed to integrate in the IEEE 123 test feeder and analysis was done with and without integrating wind energy and time series simulation was done for the month of July through NR method. Fig. 5 gives the wind diffuse for the month of July. It is observed that the average wind speed ranges between 10 to 15 m/sec which is quiet sufficient for wind power generation. Table 1 gives the load voltages in all the three phases before integrating wind generator. It is observed that the voltage level in phase A is less when compared with other phases. The voltaje mismatch in nodes 7, 28, 29, 48, 49, 50 and 51 are more. To improve the voltage profile PQ nodes are identified at remote locations and wind generators are integrated in these nodes. The identified nodes are 7, 49, 50, 66, 71, 83 and 114.
The time series analysis is carried out in the IEEE 123 test feeder with and without integrating wind energy. Seven 25 MW wind generators were integrated at the identified load nodes, which need voltage profile improvement. The simulation is carried out with an one-hour time step over a one month period. The analysis is carried out using Newton Raphson method. Fig 6 illustrates the real and reactive power flow in the substation.
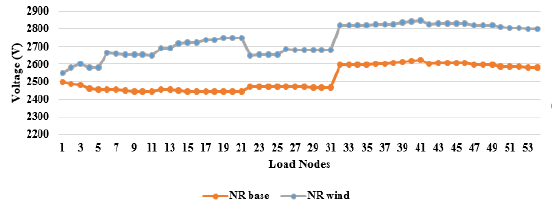
The impact of the voltage profile was studied after the integration of wind generators. Fig. 7 gives the comparison of load voltages in phase A before and after integration of wind generator in the IEEE 123 test feeder. It is observed that there is a better improvement in the voltage profile after integrating wind energy in the distribution system. Here phase ’A’ voltage profile alone is compared, as only is phase ’A’ the voltage profile was observed to be less tan the nominal voltage.
6. Conclusion
In this paper, the impact of the wind generator when integrated with a practical distribution system is presented. The time series analysis carried out provides the dynamic behaviour of the system. The load flow is run through Newton Raphson method and the results have been validated in a practical distribution system. Based on the voltage solutions, nodes were identified and wind generators were integrated suitably. The load flow was performed and the results were compared. It is found that there is a greater impact while integrating the wind generator. The time series analysis was done which gave the dynamic behaviour of the system. This paper describes the impact of wind generator integration in the time domain for the distribution system with penetration at suitable locations and change in load demand.

