


 English (pdf)
 Article in xml format
 Article references
 Send this article by e-mail
 Cited by SciELO
  Cited by Google
  Similars in
SciELO
Similars in
SciELO  Similars in Google
 Permalink
1. Introduction
Groundwater is the portion of rainwater that infiltrates through the terrain surface, reaches soil layers, later percolates, is stored, and flows through geological formations that have the right conditions in terms of porosity and permeability [1]. Groundwater represents about 30% of the total freshwater on the planet, and if polar icecaps and glacial ice are neglected, groundwater represents 95% of the liquid fresh water on Earth [2]. In many countries, groundwater is an alternative source for domestic use, agriculture and industrial activities [3], but for many others, it is the only source of water, contributes to maintain the baseflow of rivers and other surface water bodies.
Geochemistry and isotopic hydrology have made significant contributions to the understanding of groundwater systems for the last 60 years. Especially important are the development of the hydrogeochemical facies concept, the application of equilibrium theory, the investigation of oxide reduction processes, and radiocarbon dating. In addition, these tools can be used for the interpretation of the type and origin of groundwater recharge, to decipher reactive processes, and calibration of hydrological models. Additionally, hydrogeochemical and isotopic data are useful for identifying sources of recharge and groundwater flow [4].
Characterization of facies can provide insights about how a system functions, including information such as residence times, the degree of mineralization, and the isotopic composition of water.
For the region of Urabá, Antioquia, Colombia, groundwater is an important resource, not only for agriculture and industrial activities, but also for the population in general. The main economic activity of this region is the cultivation of banana, which covers 90% of its water needs with groundwater.
Since 1993, under the initiative of Corporación para el Desarrollo Sostenible del Urabá Antioqueño (CORPOURABA), progress has been made in learning about the aquifer system of the Gulf of Urabá; an initial conceptual model of the aquifer was constructed [5], and also a numeric model [6]. In 2013, the isotopic characterization of the Gulf of Urabá aquifer was completed, using 2H, 18O, 14C, and 13C [7]. With field information gathered since 1993, and considering the results of the detailed studies performed since then, a reinterpretation of the conceptual model of the aquifer established that the hydrogeological system of Urabá has a multilayer character [8].
This article summarizes the interpretation of results from a series of hydrogeochemical analyses (including some isotopic data) of the aquifer system in the Gulf of Urabá, considering the hydrogeological conceptual model, according to which a large part of the territory is confined by a clay layer and a multilayer aquifer exists that has as its main recharge area some shallow levels of permeable material located to the east of the system, in the foothills of the Abibe Mountains.
2. Framework
A multilayer aquifer is a system composed of multiple layers, where each layer is usually heterogeneous [9]. Multilayer aquifers can be made up of multi-aquifers that are, in some cases, bounded by aquitards. This heterogeneity is usually seen in sedimentary environments [9, 10]. It is usually not easy to determine the continuity of these layers, which can, on occasions, conver a considerable area.
To understand these systems, it is necessary to determine their hydraulic properties, hydrostratigraphic characteristics, and piezometric levels. Additionally, hydrogeochemical and isotopic techniques are essential tools for the validation of a hydrogeological model; understanding the chemical characteristics of groundwater can be very useful to distinguish hydrogeological formations with similar hydrogeochemical characteristics [9].
Groundwater chemistry varies in relation to complex factors, including geological, geochemical, hydrogeological and climactic factors that control the groundwater's chemical evolution. Variations in groundwater chemistry are expected as a result of atmospheric variations and changes in the mineralogy of the aquifer, as well as in the hydrogeochemical environment, groundwater flow, and residence time [11,12].
Geochemical reactions along flow trajectories can lead to regional variations in water composition, which evolve in the direction of flow [13]. As the chemical composition of groundwater is the result of the water that enters to the aquifer and its reactions with minerals in the rock that modify its composition [14], its chemical composition will be influenced by the residence time and the main minerals present in the host rock [15]. In the unsaturated zone, acid-base reactions, the transformations of nitrogen, and microbiological activity that drive CO2 production and its processes are very important during infiltration. Numerous reactions from weathering, adsorption and redox produce changes in the concentrations of solutes in the soil. These reactions mainly involve silicate weathering, carbonate reactions, and reactions with organic material [11, 13, 14]. In the saturated zone, reactions between water and rocks continue, but reaction rates vary; relatively long residence times are required in order to dissolve silicate minerals, and water that is free of silicates is subject to acidification [11].
In addition, groundwater flow patterns and residence time have a marked influence on groundwater chemistry, since they determine the manner in which chemical reactions may occur. Flow conditions can vary according to porosity and permeability, the dimensions of the aquifer, the recharge and discharge areas, the degree of confinement, and the abstraction regime [3, 11].
In recent years, the assessment of both the geochemical state of groundwater and the impact of anthropogenic pollutants have become more important [4,16]. Most hydrogeochemical studies take the understanding of geology as a starting point, and later, analyze the quality of groundwater in order to define flow patterns and hydrogeological units [17].
Determining hydrogeochemical facies is a great help for determining relationships and similarities among the chemistry of waters in an aquifer. Facies are expressed as the measured concentration of major ions in decreasing order [18]. Various techniques are used for hydrogeochemical interpretation, based on data from spatial representations, and graphical and statistical methods. Among the graphical methods, Stiff and Piper diagrams stand out. When they are placed over a map, and knowledge of other characteristics of the aquifer system is taken into account, it is possible to obtain conclusions about the main processes that lead to the chemical composition of the groundwater [19], and identify elements that allow for testing the conceptual hydrogeological model, such as the flow paths and the residence times of the water in the system.
Other methods for the interpretation of groundwater chemistry include analysis techniques like multivariate statistics methods [19-21], inverse hydrogeochemical modeling [22, 23], and the use of tracers and isotopic analysis [18, 24-27].
3. Study area
Urabá is a region located in northwest Antioquia (Colombia). It covers an area of approximately 1,030 km² and is bordered to the east by the Abibe and Palomas Mountains, to the northwest by the Caribbean Sea coast, and to the west and south by the León river [Figure 1]. The towns of Chigorodó, Carepa, Apartadó and Turbo are located in this region.
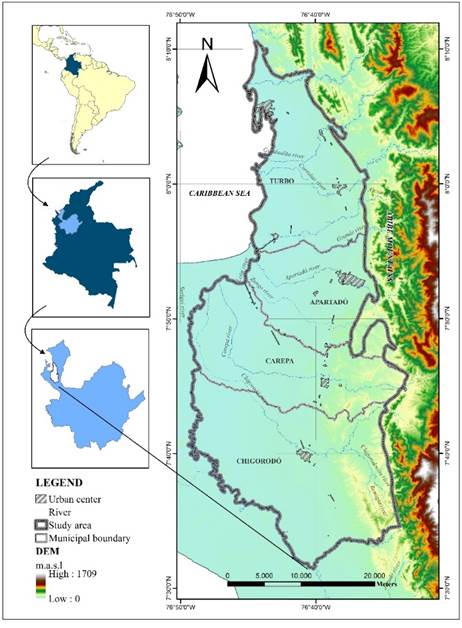
The relief is flat, and inclines slightly toward the northwest, showing heights that vary between 100 m.a.s.l. in the Chigorodó area, and 0 m.a.s.l. at the Gulf of Urabá. The main drainages that cross the area belong to the León river basin; the Currulao, Guadualito and Turbo rivers drain directly into the Caribbean Sea at the Gulf of Urabá.
The climate of the Urabá region is determined by its location in the Intertropical Convergence Zone (ITZC), its closeness to the Caribbean Sea, and the so-called Chocó Jet Stream. With mean annual precipitation varying between 2,200 mm/year and 3,800 mm/year, it is characterized by a wet season from April to November, and a dry period from December to March. Mean temperature is 28 ºC and relative humidity is around 85.9%, corresponding to the characteristics of a tropical rain forest [5, 28].
In the region of Urabá, over a base of older rocks, sedimentary rocks from the Neogene are found; they are the Pavo, Arenas Monas, and Corpa Formations. Alluvial, fluvio-lacustrine, fluvio-marine, and marine deposits from the Quaternary cover the surface [5]. The mineralogy of the sedimentary system is characterized by the presence of iron oxides, calcareous material, silicates, sulfurs, chert, quartz, organic material, peat, and traces of magnetite, zircon and paragonite stand out. In terms of structural geology, it is necessary to point out the presence of fault fronts related to strong morphological changes around the Abibe Mountains and the sections of hillocks and plains [5].
The hydrogeological system is a multilayer aquifer made up of a series of layers that alternate between permeable, semipermeable, and impermeable. This structure was determined using hydrostratigraphic criteria and considering different ranges of hydraulic conductivity [Figure 2]. The model was made with a vertical representation scale of 10 m, including some layers with 3 m. It is possible to determine and distinguish the predominance of clayey levels to the north, and to the south, the progressive increase of levels in which first, fine to thick sands, and later, sands and gravels are combined.
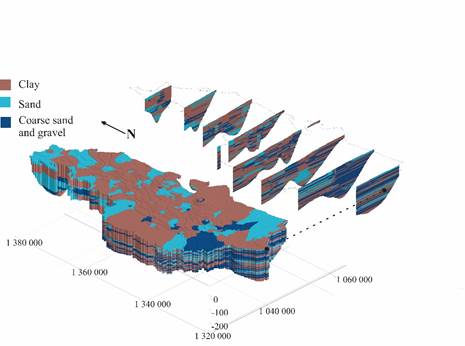
According to the conceptual hydrogeological model obtained for the zone of study, water flows from the Abibe Mountains toward the riverbed of the León river in the center and south, and toward the Gulf of Urabá, following a southeast-northeast tendency in the north; hydraulic conductivity changes from 0.6 m/day in the northeast region to 28 m/day in the south. For the deepest levels, the storage coefficient is on the order of 10-4 [28].
4. Materials and methods
Based on the conceptual elements presented in the framework, the following will indicate the methods that were implemented and the information used for the hydrogeochemical evaluation of the multilayer aquifer system of the Gulf of Urabá.
4.1 Available information
To verify the hydrogeological model of the Gulf of Urabá, available hydrogeochemichal studies conducted from 1994 to 2014 were compiled. Reports with hydrogeochemical information were supplied by CORPOURABA from 8 databases that contain analyses of major and minor ions, SiO2, electric conductivity (EC), pH, total dissolved solids (TDS), temperature, and some data from analysis of stable water isotopes (δ18O, δ2H). All samplings were made by CORPOURABA, according with the following conditions: an effective purge of the wells was ensured for sampling, CE, pH and temperature were measured in the field. The samples were filtered with 0.45 µm membranes, collected in polyethylene bottles that were previously washed with deionized or well water. For the analysis of cations, water was acidified with HNO3 (pH <2) and a temperature below 4 °C was guaranteed before the analysis [29]. The chemical analyses were done following standardized protocols in certified laboratories by the Institute of Hydrology, Meteorology and Environmental Studies of Colombia According to the NTC-ISO / IEC 17025 [30] by automatic titration, absorption atomic spectrometry and ionic chromatography. Isotopic analyzes were performed in the International Atomic Energy Agency (IAEA) laboratory using laser spectroscopy.
A verification of duplicate information and reliability checks were performed following Hounslow [31], with the ionic balance (<10%), as well as the representativeness of spatial distribution were applied to the 783 hydrogeochemical analyses available, in order to establish the information to be employed to carry out the hydrogeochemical characterization of the system. Finally, 63 data were selected from samples collected on 2010 and 2012, which correspond to water samples from the deepest levels of the multilayer aquifer, whose well design is mostly known.
4.2 Methods
To perform analysis of the hydrogeochemical characteristics of an aquifer system, it is necessary to have a previous knowledge of its geology, and a conceptual hydrogeological model where the hydrogeological units, recharge areas, flow network, and hydraulic properties are designated and identified.
First Hydrogeochemical analysis began with determination of the facies and the representation of them on a piper diagram [Figure 3 and Figure 4]. Afterward, according to the flow directions deduced from the piezometric surface, and keeping in mind the data spatial distribution, 4 flow lines were selected to evaluate the hydrogeochemical evolution from the recharge area, through transit and finally to the discharge location [Figure 3]. These analyses were superimposed over cross sections [Figure 5] that allowed the identification of possible flow trajectories. The hydrostratigraphic sections were modeled using correlation functions available within the application tools of the RockWorks 15 Complete © [32]. In addition to the representation of lithological characteristics, permeability conditions and catchment designs were also arranged. Also, Piper and Stiff diagrams were made using Aquachem® software [33] and were superimposed over the piezometric surface.
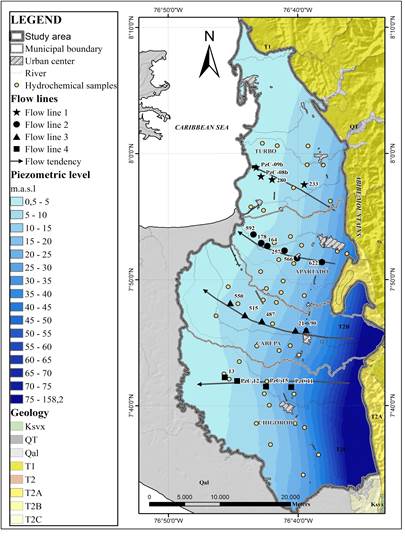
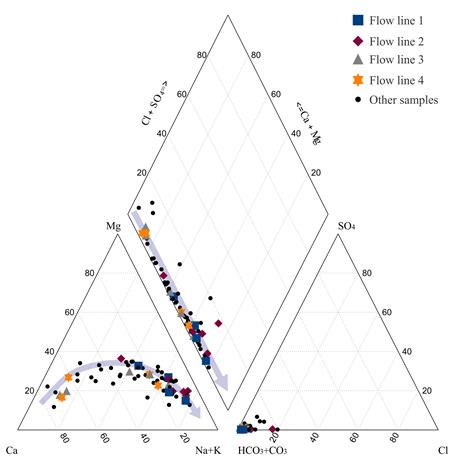
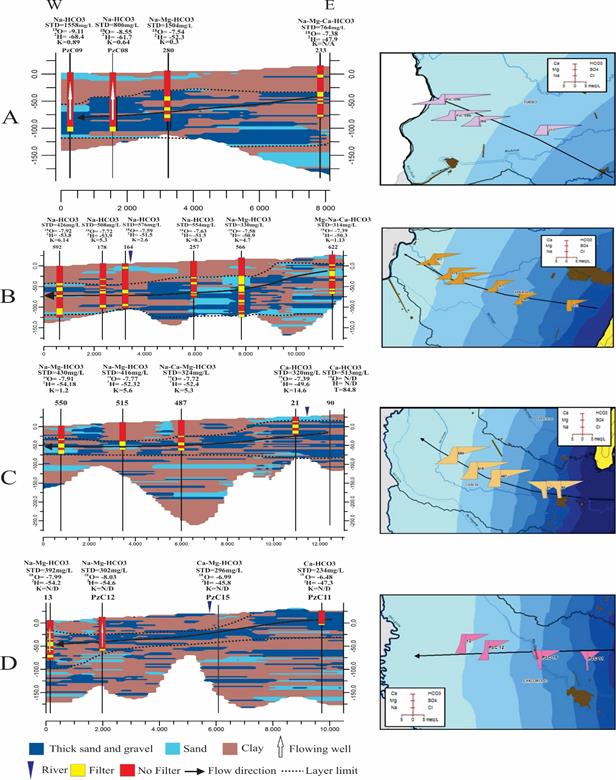
Figure 5 Hydrostratigraphic sections and Stiff diagrams associated with each line of flow. Sections: A: flow line #1, B: flow line #2, C: flow line #3, D: flow line #4
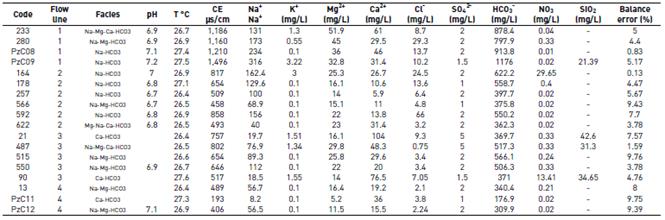
The results of the proposed interpretation were compared with available isotopic information in order to verify the hypotheses relating water quality with its natural evolution. In this paper, we have selected the results of the hydrogeochemical analysis and isotope data according to their relation with the main groundwater flow path. Table 1 presents the referenced information.
5. Results
As can be seen in the Piper diagram in Figure 4, in terms of anion composition, the groundwater of the evaluated system has a bicarbonate nature, showing significant variations in the content of cations. The hydrochemical evolution of Ca2+-HCO3 - and Ca2+-Mg2+-HCO3 - to Na+-HCO3 - facies, include silicate and carbonate weathering processes, as well as ion exchange processes of Mg and Ca to Na. Some ionic ratios validate this conclusion: in the SiO2/Na++K+-Cl- molar ratio, 90% of the values is less than 1, showing ion exchange processes, the Na+/Na++Cl- ratio show that exist other sources of sodium such as albite and ion exchange (97% of the data >0,5).
The hydrostratigraphic section corresponding to flow line #1 includes points 233, 280, PzC08 and PzC09 [Figure 5A, Table 1]. At point 233, the system is separated from the surface by a layer of clay that is about 15 m thick; nevertheless, considering the chemical analysis of the collected sample, this point contains a mix of waters from different levels of the aquifer. The next three points following along the East-West direction would be capture just one level separated from the surface by a clayey layer between 20 and 30 m thick. At the first point, Na+-Mg2+-Ca2+-HCO3 - facies and a concentration of total dissolved solids (TDS) of 764 mg/L were recorded. This is an indication of water with a greater degree of evolution than that of recently recharged water. From this point, the water becomes Na+-Mg2+-HCO3 -, and evolves to Na+-HCO3 - at the last point: as concentrations of Na+ increase, concentrations of Ca2+ and Mg2+ decrease. In the piezometer PzC09, the concentration of TDS was 1,558 mg/L. According to the stable isotope data available, in the same direction of flow, there is a depletion in values of δ18O.
For the flow line #2 [Figure 5B, Table 1], defined by points 622, 566, 257, 164, 178 and 592, the lateral connection that exists among the most permeable levels of the multilayer system is observed; based on the location of the filters in the sampled wells, the levels of continuity of the underground flow can be established. The first point of the line of flow (point 622) captures different levels, including shallow layers of gravel and sand (25 m) that outcrop at the surface. From point 566, the flow is isolated from the surface by a layer of clay that reaches a thickness of 50 m. In the well identified by the code 164, a mixture of groundwater from different layers occur. The first point of this line shows Mg2+-Na+-Ca2+-HCO3 - facies and a TDS concentration of 314 mg/L. As the flow continues, the composition evolves to Na+-HCO3 -. At the end of the flow line (point 592), TDS concentration is 426 mg/L. The hydrogeochemical evolution is marked by an increase in the concentrations of HCO3 - and Cl-, while the SO4 2- ion is recorded at an average concentration of 2.0 mg/L, with very little spatial variation. A depletion is detected when we observe the δ18O measurements with respect to the distance of points along the direction of flow at deep levels.
Figure 5C shows that the stratigraphic section of flow line #3 has five points: 90, 21, 487, 515 and 550. The depths of the wells vary between 50 and 90 m. It can be clearly seen that the first two points capture shallow levels which outcrop at the surface, which would be exposed to direct recharge. The other points (487, 515 and 550) would take water from the multilayer system in conditions of confinement below a 40-meter thick layer of clay. It is also clear that the intercalations between permeable and impermeable layers are more frequent along this section than to the north, and that the content of coarse material, with gravel being the most common, increases in this area. As for hydrogeochemical composition, the first two points of the flow line show Ca2+-HCO3 - facies and have TDS concentrations of 513 and 320 mg/L, respectively. The other points along the flow line evolve from Na+-Ca2+-Mg2+ -HCO3 - facies to Na+-Mg2+-HCO3 - facies, with increase in the concentrations of Na+ and Mg2+ and decrease in the concentrations of Ca2+. TDS also increases from 324 to 430 mg/L. As for isotopic composition, just like in the previous lines, there is a depletion in the measurements of δ18O advancing along the direction of flow.
Flow line #4, in the southern part of the zone of study, is made up of points PzC11, PzC15, PzC12 and 13. In this hydrostratigraphic section, connections are recorded between permeable levels near the surface of the terrain. Also, lateral continuity between layers of sand and gravel is well defined [Figure 5D, Table 1]. The collected water samples capture levels that get deeper as they go along the direction of flow. The last two points are artesian wells. Along the flow line, the concentration of TDS increases from 234 to 392 mg/L. In hydrogeochemical terms, the facies evolve from Ca2+-HCO3 - and Ca2+-Mg2+-HCO3 - at points PzC11 and PzC15, respectively, to Na+-Mg2-HCO3 - at the last two points. Concentrations of Cl- and SO4 2- show little variation. As for δ18O content, more enriched values are recorded at the first two points.
The hydrogeochemical and isotopic evolution of the groundwater along the analyzed flow lines show regional differences related to various features, among which the following stand out: variability in the stratigraphic characteristics of the system, differences in the degrees of connection between permeable layers, changes in the conditions of hydraulic conductivity, variation in the depth of the captured layers of the aquifer, and differences in the distance to the zones of recharge.
The greater confinement of the aquifer system is found towards the center and north (flow lines #1 and #2), with a recharge zone located only distantly to the east in the foothills of the Abibe Mountains. The hydraulic conductivity values of less than 7 m/day, and the fact that the zone has a low hydraulic gradient (on the order of 10-3), imply a slower flow rate for the water in this aquifer. Under these circumstances, it is normal for groundwater to have more mineralization (TDS between 314 and 1,558 mg/L) and more evolved facies, reaching Na+-Mg2+-HCO3 - or Na+-HCO3 -. The presence of younger waters (based on characterization of their hydrogeochemical facies as Mg2+-Na+-Ca2+-HCO3 -) registered at the beginning of flow line #2 (point 622) is most likely due to the proximity of the recharge zone, and to the mixture of water from some shallow levels with water from deeper levels that would be occurring in the well. The successive depletion in values of δ18O and δ2H in the direction of flow not only confirms conditions of evolution for the water in the western part of the aquifer, but also provides evidence for the presence of regional flow systems. Additionally, it indicates conditions of recharge under climatological regimes with lower environmental temperatures. Data from radioisotope analyses are required in order to determine ages and correlations between recharge times and paleoclimates.
In the southern part of the study zone, the hydrogeochemical and isotopic characteristics reported from cross sections in the directions of flow of lines #3 and #4 also explain the hydrogeological model. The biggest connection between the multilayer aquifer system and meteoric conditions through the permeable layers that outcrop at the surface has to do with the lower concentrations of TDS in comparison with the northern section. In this way, hydraulic conductivity values and their relation with the gradient allow for faster flows, and hence, less mineralized samples. Effectively, the hydrogeochemistry corresponds to less evolved water, with facies ranging from Ca2+-HCO3 - to Na+-Mg2+-HCO3 -. Similar to the north, evidence of changes in climatic conditions during recharge is seen in the south, with colder conditions for the more evolved water, and higher environmental temperatures at sites where a current connection with the surface is evident, allowing direct recharge. The site with identification code 21, from the beginning of flow line #3, provides evidence for this, showing the most enriched waters in stable isotopes of the system.
6. Discussion
Hydrogeochemistry and isotopic hydrology are essential methods and tools for validating conceptual models. In the case of complex systems, where it is difficult to define the lateral continuity of layers, these types of techniques are even more important, since they can be used to identify connections among flow systems.
On the other hand, it is important to consider that a hydrogeological model contains many qualitative and subjective interpretations, and proof of its validity is only attained by applying specific (hydrogeochemical and isotopic) investigation techniques. It is important to note that conceptual hydrogeological models require periodic verification and should be updated with new information.
Downscaling of conceptual hydrogeological models is usually necessary to develop and implement new methodologies to obtain an adequate understanding of the aquifer behavior. However, the joint use of hydrostratigraphic cross sections obtained from the information about well design and piezometric levels, TDS content, hydrogeochemical facies, and isotope data provide convincing arguments to improve the understanding and validation of conceptual hydrogeological models. These tools facilitate the visualization of potential flow systems, which indicate information about relative residence time and possible contacts with direct recharge water.
7. Conclusions
For this multilayer hydrogeological system, the elaboration of hydrostratigraphic sections parallel to the flow direction allowed the achievement of an integral view of the underground system. This representation made easier the interpretation of the water evolution processes in the zones of recharge, transit, and discharge. Knowing the variation in the degree of aquifer confinement, the orders of magnitude of hydraulic conductivity, and the hydraulic gradient across the aquifer system of Urabá, allowed the identification of areas to the north of the study zone where groundwater flows with less velocity, and in consequence, presents more mineralized samples, compared to the southern part.
The groundwater hydrogeochemical facies validate the hydrogeological model characterized by a multilayer system, and they allow the identification of regional flow systems. The degree of depletion in the isotopic signature observed along the direction of hydrogeochemical evolution and groundwater flow indicates that recharge to the system took place in the past under colder climatic conditions. Groundwater analysis using radioisotopic techniques would allow establishing correlations between the age of the water and paleoclimatic conditions in the multilayer aquifer of Urabá.

