


 Inglês (pdf)
 Artigo em XML
 Referências do artigo
 Enviar este artigo por email
 Citado por SciELO
  Citado por Google
  Similares em
SciELO
Similares em
SciELO  Similares em Google
 Permalink
1. Introduction
Polyurethanes (PU) are polymers containing urethane bonds (─NH-CO-O─) in their main chain. Although these materials were discovered in Germany in 1937 by Otto Bayer, PU foams were only introduced in the 1950´s. There are two types of PU foams; flexible PU foam (PUF) and rigid PU foam (PUR). Those materials exhibit high mechanical resistance, chemical and thermal stability. These properties combined with their cellular structure made them an excellent replacement for rubber, and cotton fibers [1].
PU containing materials are present in daily life as coatings, mattress, automotive parts and thousands of other products. As their demand and production increases, the waste generated in their synthesis also increases. In order to reduce the amount of PU waste, physical, chemical, and thermal PU recycling processes have been used.
In the case of PUF, physical or mechanical recycling is the most common method used in the production of rebounded foams and consists in the grinding of foam to small size chips, later the mixture with adhesives and molding by compression of the PUF chips. This method has the weakness that after the use of rebound foams, they are again disposed, thus returning to the environment. The thermal recycling is achieved by the incineration and decomposition by pyrolysis of PUF obtaining fuel gases. The drawbacks of those processes are the production of toxic gases and their high costs [2].
In chemical recycling, the PU materials react with chemicals substances in order to break their polymeric structure to obtain valuable materials as polyol and nitrogen compounds that can be used in the synthesis of polyurethane and also as agro chemical promoters.
Among PU chemical recycling methods, glycolysis is the most common procedure due to their technical advantages, low costs and the high quality of recovery polyols [2,3].
This method was developed in the 1970s and consists in the rupture of the urethane bond by reaction with a diols, usually at the temperature range 160 - 220 °C, under inert atmosphere and with the presence of catalysts [2]. Traditionally glycolysis is carried out using homogeneous catalysts as metallic hydroxides [4-6], diethanolamine, metallic oxides and organic salts [7].
Several researches in PU chemical recycling are reported in the literature, one of the first is the work of Ulrich et al., reported in 1978 for the PUF glycolysis using LiOH. The authors worked at the temperature range of 185 - 200 °C, under nitrogen atmosphere and DEG as glycolysis agent with a DEG/PU mass ratio between 50/50 and 60/40. Polyols with viscosity of 3000 cps at 25 °C and hydroxyl number of 130 mgKOH/g were obtained [3].
In more recent research, other kind of catalysts were explored; Wu et al. reported in 2003 the PUF glycolysis using DEG at 220 °C, and potassium acetate (KAc) as catalyst. They achieved urethane groups conversion between 88 and 94% and polyol recovery of 55.4% for reaction times of 90 min [8]. In 2006, Molero et al. obtained polyol from PUF using diethanolamine, titanium n-butoxide and octoate salts as catalysts. They found the highest selectivities for the PUF to polyol using titanium butoxide (IV) and potassium octoate at 120 min of reaction [7]. In 2009, Molero et al. recycled PUF wastes using DEG and stannous octoate as catalyst for 30 min of reaction at 189°C and ratio PU:DEG = 1:1.5. The authors founded a polyol recovery of 82.3%, hydroxyl number of 198 mg KOH/g and amine content of 5.23 mgKOH/g [9]. In 2015, Simon et al. used stannous octoate as catalyst for the PUF glycolysis. They found that the more suitable conditions of reaction to obtain polyol similar to the original are 189°C, PU:DEG ratio = 1:1.125 and 1.3% of catalyst. The recovered poliol/DEG mass ratio at those conditions was 80 [9].
Nowadays, the need of high purity recovered products and eco-friendly substances are promoting the use of heterogeneous catalysts instead of homogeneous ones. In polymers recycling, most of the investigations have been carried out in presence of homogenous catalysts but recent studies point to the use of heterogeneous catalyst as a viable solution. In the literature, there are reports of polyethylene terephthalate (PET) recycling by glycolysis over heterogeneous catalysts.
In 2012, Zhu et al. studied the PET glycolysis using ethylene glycol (EG) over cobalt sulfate (SO4 2-/Co3O4) and zinc modified cobalt sulfate (SO4 2-/Co-Zn-O) [10]. The authors reported enhanced catalytic activity in the PET glycolysis using binary sulfur oxides SO4 2-/Co-Zn-O. For the tested catalyst, the low calcination temperature improved their amorphous structure, increasing the Lewis acid sites in the surface of both catalysts. More Lewis acid sites were obtained in the SO4 2-/Co-Zn-O surface than in SO4 2-/Co3O4. The (SO4 2-/Co-Zn-O) binary oxides exhibited better catalytic activity in the PET glycolysis than a single (SO4 2-/Co3O4) oxide. At 180°C, atmospheric pressure and 3 h of reaction time the PET conversion over SO4 2-/Co-Zn-O was 96% and the selectivity to bis (2-hydroxyethyl) terephthalate (BHET) was 75% [10].
Chen et al. [11] reported mixed Zn/Al oxides as heterogeneous catalysts in the PET glycolysis using EG as glycolysis agent. The authors found that the mixed oxides showed higher catalyst activity than Zn and Al individual oxides. Their more suitable reaction conditions were achieved for mass ratio EG/PET = 5, PET/catalyst = 0.01 and reaction time of 1.25 h. Over a catalyst with Zn/Al molar ratio of 3, they obtained 92% of PET conversion and 79% of BHET yield.
Some recent investigations show that catalysts containing tin exhibit higher yield in the glycolysis reaction, even more than metallic hydroxides [12,13]. The catalytic activity in the PU glycolysis is related with the carbonyl groups coordination with metallic species [12]. It explains the high catalytic activity of stannous compounds even more than transition metals [12]. Chen et al. found that the Zn/Al mixed oxides are effective catalyst for the PET glycolysis and good choice as replacement of homogeneous catalysts. For stannous catalysts they reported that their basicity play an important role in the glycolysis reaction [11].
In this research, PUF was recycled via glycolysis for the recovery of the most important raw material, polyol. The urethane bonds were broken using a Zn/Sn/Al as a heterogeneous catalyst. The effect of several reaction conditions was evaluated on the polyol recovery as on their effect in the synthesis of PUF
2. Methodology
2.1 Zn/Sn/Al hydrotalcite synthesis
The Zn/Sn/Al hydrotalcite was prepared by the hydrothermal method [14], using 9.8718 g of aluminum nitrate nonahydrate (Al(NO3)3•9H2O 95% w/w, from Merck), 21.2258 g of zinc nitrate hexahydrate (Zn(NO3)2•6H2O 98.102% w/w, from Panreac) and 1.1293 g of stannous chloride dihydrate (SnCl2•2H2O 99.9% w/w, from Alfa Aesar) in 100 mL of deionized water [14]. The Zn/Sn/Al molar ratio was 2.8/0.2/1 and the total metallic ion concentration was 1.0 mol/L. An alkaline solution was prepared dissolving 2 g de NaOH (99%, from Merck) and 1.3249 g of Na2CO3 (99.5%, from Merck) in 100 mL of deionized water [15]. Both solutions were added at the same time in a round bottom flask (with a volumetric flow rate of 0.2 mL/s) that previously contained 100 mL of deionized water. The process was carried out with vigorous stirring at 40°C and pH of 10 controlled by addition of NaOH solution. The obtained gel was stirred for 30 min, and later the mixture was introduced in an autoclave to be dried at 120°C for 10 h. The resulting product was cooled down to room temperature. Later, it was filtered and washed several times with deionized water and ethyl alcohol to a pH of 7 [14]. Finally, the hydrotalcite was dried at 60ºC for 24 h and macerated until a fine powder was obtained.
Zn/Sn/Al hydrotalcite characterization
The hydrotalcite was characterized by X-Ray diffraction (XRD), electronic transmission microscopy (TEM), and Fourier transform infra-red spectroscopy (FTIR). The XRD was carried out with a series 2 Panalytical Empyream equipment, using a Cu anode and radiation generated at 45 kV and 40 mA with 5° ≤ 2θ ≤ 70°. The scan was continuous with a 0.039 °/s step. The Zn/Sn/Al hydrotalcite morphology was observed using TEM, in an equipment TECNAI F20 SUPER TWIN from FEI, using 0.1 nm resolution and 200 kV; for the test, a small amount of hydrotalcite was dispersed in ethanol (2 mL), until a clear solution was obtained that was sonicated for 20 min. Finally, a drop of this solution was poured in a 3 mm copper cell with a carbon membrane until the ethanol was completely evaporated. The chemical analysis was done in an atomic absorption equipment model PU9100X from Philips. The sample was digested with hydrofluoric acid, hydrochloric acid, nitric acid and boric acid. The FTIR was carried out using attenuated total reflectance (ATR) in a SHIMADZU IR Tracer-100 spectrometer, between 400 and 4000 cm-1.
2.2 PUF glycolysis
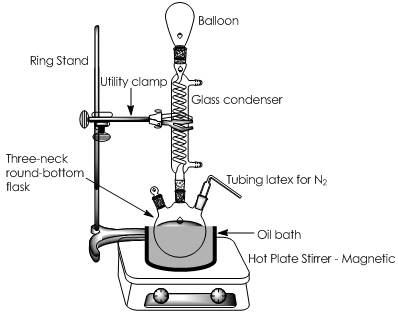
The PUF glycolysis was carried out with DEG (98%, from Protokimica) and NaOH and Zn/Sn/Al hydrotalcite as homogeneous and heterogeneous catalysts respectively. A system composed of a 50 mL three neck round bottom flask, submerged in an oil bath, with condenser, temperature control and heating plate with magnetic stirrer. The experiments were carried out under N2 atmosphere that was maintained using an air balloon in the condenser open side and at 180, 185 and 190ºC, because at a temperature higher than 190ºC, the excessive DEG evaporation is promoted as well as side reactions, which means a high probability of polyol degradation [16]. The mixing rate was between 500 and 1400 rpm. For all reactions, the DEG was added to the flask and heated to the reaction temperature at 500 rpm, Figure 1. In the case of NaOH, it was added simultaneously with DEG to achieve complete dissolution of PUF. In the case of hydrotalcite, PUF was slowly added to the system; when the PUF was completely dissolved in DEG, the hydrotalcite was added. Once both PUF and catalyst were added to the system, the mixing rate was increased to 1400 rpm. Reaction times were between 2 and 5 h, with the initial time when the PUF was completely dissolved in the DEG.
When the reaction times finished, stirring and heating were stopped, and the reaction products were poured in test tubes to be centrifuged at 3000 rpm during 20 min. The recovered polyols were collected with syringe and stored in glass vessels.
In total, 32 experiments where done. The effects of condition of reaction were determined for the PUF glycolysis, Table 1. The variables studied were temperature (170, 180, 185 and 190 °C), reaction times (2, 3, 4 and 5 h) and the catalysts Zn/Sn/Al amount (0.01, 0.1, 0.2, 0.3 and 0.35 g); for the experiments 10 g of DEG and 15 g of PUF were used.
Recovered polyol characterization
The viscosity of the recovered polyol was determined using a rheometer Bohlin model Gemini Nano HR. This test was carried out in a Peltier cell at 25 °C ±0.01. A plate-plate 40 geometry was used with a shear velocity of 50 s-1 in 60 s. Polyol density was determined with a 10 mL pycnometer at 25ºC following the ASTM D4669 standard [17]. The water content was determined with the Karl Fisher method following the ASTM E203 standard; the titration was done using an automatic titrator TitrinoPlus 848 coupled with a water content measurement unit Karl Fischer 803 Ti Stand. The IR analysis was done in a spectrometer SHIMADZU IRTracer-100, in the range 400 - 4000 cm-1 using ATR. For the GPC analysis, 0.2500 g of polyol samples were added in 30 mL flasks and dissolved with THF. The samples were stirred to complete solution and later filtered with 0.45 (m PTFE membranes, analyzing 20 µL of the filtrate. The analysis temperature was 35ºC, with 0.7 mL/min volumetric flow, and using a refractive index detector and Columns: Phenogel™ 5 μm, LC Guard Column 50 x 7.8 mm, Phenogel™ 5 μm 50A, LC Column 300 x 7.8 mm (range 100 - 3k), Phenogel™ 5 μm 10E4A, LC Column 300 x 7.8 mm (range 5k - 500k). A polystyrene-standard-based calibration curve was used in the range 682 to 304000 D, following the linearized equation:
 with R2 = 0.9956, where V is the elution volume in mL and MW is molar mass in D.
2.3 PUF Synthesis
The PUF syntheses were carried out in paper molds with dimensions 12 x 12 x 6.8 cm, following the formula showed in Table 1.
For the PUF synthesis, 4 substance groups were mixed. Group 1 composed of commercial grade polyol and stannous octoate that was called catalyzed virgin polyol. Group 2 containing a mixture of amine, silicone and water and called ASA. Group 3 was pure TDI and the group 4, the recovered polyol. The synthesis was carried out mixing groups 1, 2 and 4 under vigorous stirring to obtain an emulsion. Later, the TDI was added to the mixtures and stirred at 3000 rpm during 5 s. Finally, the complete mixtures were poured into the molds.
2.4 PUF Characterization
Compression set tests
The PUF compression sets were determined in a universal test machine series AGS-X from SHIMADZU, following the ASTM D3575-14 standard. The tests were carried out at 24 °C with specimens of 50.8 x 50.8 x 25.4 mm. The specimens were compressed to the 50% of the total thickness for 30 min, and 2 h later the final thickness were determined.
3. Results
3.1 PUF glycolysis
Catalyst load effect
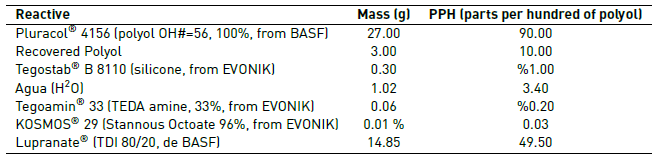
Figure 2 shows the effect of catalyst in the PUF glycolysis. The reaction without catalyst was not complete obtaining a polyol amount of 1.71% of the total PUF mass, it is in agreement with data reported in literature [12], when is mentioned that the transesterification of urethanes with hydroxyl group of glycols is slow without catalyst. When NaOH was used as a catalyst (0.6 g NaOH, 190 °C, PUF/DEG = 1.25, 3 h), a polyol amount of 61% of the total PUF mass was obtained. In the case of Zn/Sn/Al catalysts, the amount of recovered polyol increased until 66.37% of the total amount of the PUF used in the reaction (15 g).
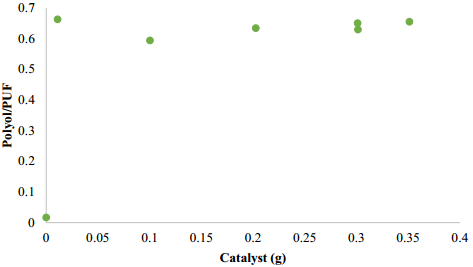
Figure 2 Effect of Zn/Sn/Al catalyst amount in polyol/PUF mass ratio at 190 ºC, mass ratio PUF/DEG = 1.5 and reaction time 3 h
When the hydrotalcite was added to the reaction, the polyol/PUF ratio was around 66%, but with the hydrotalcite amount increase in the 0.01 - 0.35 g range, no big differences in polyol/PUF ratios were obtained.
Temperature effect
The thermal degradation of urethane groups in the polymer structure occurred at around 200 ºC by two mechanisms, depolymerization and dissociation [12,18]. In previous investigations, an increase in amines content was observed at temperatures higher than 190 ºC [12]. Taking into account the previous references, the temperatures of the present research were selected below 200°C, Figure 3. It was found that at temperatures lower than 190ºC, two liquid and one solid phases were obtained. The amount of the upper liquid phase, mainly composed by polyol, was poor at 180 and 185°C. At 170°C a solid black phase and a negligible polyol reaction was obtained, it shows that at lower temperatures the reaction to polyol does not occur and side reaction promote the production of non-desirable products such as amines and ureas [13]. At 190 ºC, the highest polyol amount was achieved, also the PUF dissolution time was lower, obtaining a solid phase in the bottom, a black liquid phase in the middle, and a liquid and clear polyol rich phase at the top. A temperature of 190°C was the more suitable temperature for the polyol recovery.
Figure 3 Temperature effect on the polyol/PUF mass ratio. Reaction conditions: mass ratio PUF/DEG = 1.5, 3 h, 0.3 g of Zn/Sn/Al catalyst
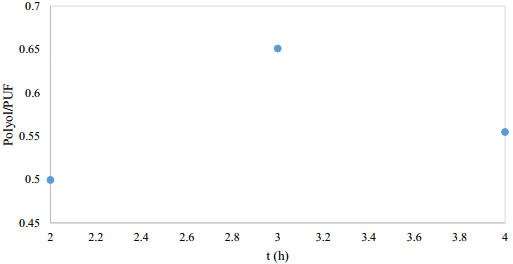
Time reaction effect
The reaction time could be reduced by the temperature increase and the catalyst presence [12,13]. With 3 h reaction, the highest polyol amount was obtained. In the case of 4 h reaction, the side reactions are promoted and the polyol is evaporated, thus decreasing its yield [Figure 4].
3.2 Hydrotalcite characterization
X-Ray diffractogram
Figure 5 shows the X-Ray diffractogram of the Zn/Sn/Al hydrotalcite used in this study. The X-Ray diffractogram for Zn/Sn/Al hydrotalcite reported by T. Wang et al. [14] is also included for comparison purposes.
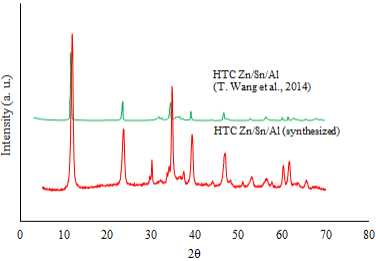
The presence of symmetric and sharp diffraction peaks, and the peak at around 11.6° support that the hydrotalcite had a hexagonal crystalline, typical in those materials [14].
Fourier transform infrared spectroscopy (FTIR)
The hydrotalcite FTIR spectrum, Figure 6, is typical for the Zn/Sn/Al hydrotalcites [14].
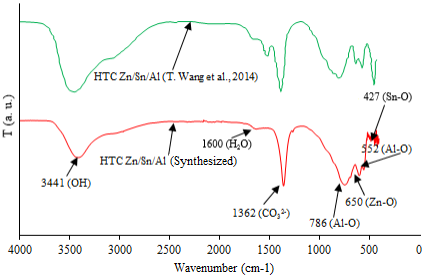
The main bands are [14] stretching of OH groups coupled with metallic ions at 3404 cm-1, water flexion vibrations at 1616 cm-1, anion carbonate presence at 1356 cm-1, Zn-O vibration between the bands 650-500 cm-1, Al-O stretching attributed to the bands 553 and 747 cm-1 and Sn-O vibrations at 428 cm-1.
Chemical analysis
The chemical analysis showed a Zn/Sn/Al molar ratio of 1/3.4/0.2, which is close to the theoretical value (1/2.8/0.2), it verified the effectiveness of hydrotalcite synthesis method. The atomic ratio of 0.22 is near to the ideal value of 0.25, it means that the metals (Zn, Sn y Al) precipitated completely [19].
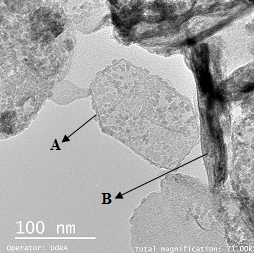
Electron transmission microscopy (TEM)
From TEM images, Figure 7, two main structures are identified, hexagonal plates and fibers. The first type corresponding to carbonated plates [20,21] attribute to hydrotalcites [22,23], and fibers corresponding to ZnO single phase [22].
3.3 Polyol characterization
Viscosity
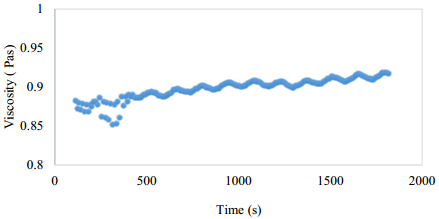
Recovered polyol had an average viscosity of 0.8967 Pa.s, Figure , higher than the original polyol (0.587 Pa·s) [24]. That difference would be owing to the presence of side products in the polyols. From Figure 8, it is concluded that the polyol behaves as a Newtonian fluid, as the viscosity is nearly constant with the shear rate.
Fourier transform infrared spectroscopy (FTIR)
The spectra for commercial and recovered polyols, Figure 9 , are very similar. It implies that the upper phase obtained in the glycolysis is manly polyol. Differences in spectrums are attributed to impurities in the recovered phase [25]. The main absorption bands are aliphatic ethers (1080 y 1091 cm-1), OH ending groups stretching (3427 y 3475 cm-1), CH bond stretching (2968-2866 y 2968-2854 cm-1) and flexion of methylene groups (1452-1373 y 1450-1371 cm-1).
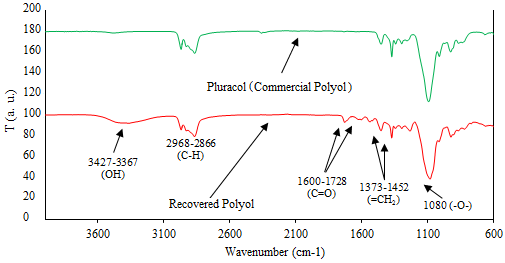
The vibration in hydroxyl ending groups are bands in the range 3427 to 3367 cm-1; stretching vibration in C=O bonds of carbamates from side reactions are located in the range 1600 to 1728 cm-1. The flexion vibration of NH molecules from primary amines are at around 1604 cm-1.
Water content (Karl Fischer)
Recovered polyols shown a water content of 0.195 ± 0.0083 % w/w and in the commercial polyol the water content was 0.037 ± 0.0016 % w/w, both values are near to the reported in literature (0.048% w/w) [26]. The higher water content in the recovered polyol could be owing to the foam wastes, the water content in air as well as the water from the DEG. This total water amount should be considered in the preparation of foams from recovered polyol to guarantee similar foam properties [6].
Density
For commercial grade polyols, the density was 1.0335 g/mL, close to the reported value of 1.0185 g/mL [24]. The density from recovered polyol was slightly higher 1.0640 g/mL. The difference in density could be due to the presence of dissolved impurities from side reactions.
Gel permeation chromatography
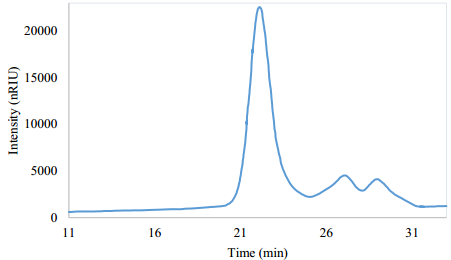
As shown in Figure 10, the GPC exhibits two small peaks probably due to the residual DEG and low molecular weight side products. The recovered polyol weight average molecular weight (MW) was 6541 g/mol and the number average molecular weight (MN) was 5452.3 g/mol. These values are in the same order of magnitude of commercial polyols used in the PUF synthesis (2000 - 6000 g/mol) [27]. The GPC analysis showed that the recovered polyol is monomodal and homogeneous, with a polydispersity (MW/MN [28]) of 1.2 [29].
3.4 PUF synthesis
Four PUF tests were performed. Recovered polyol was used in three foam formulas as partial substitute of commercial polyol in 10, 15 and 17% of the total polyol. Additionally, a reference formula without recovered polyol was produced. The stress versus strain curves obtained from mechanical tests of obtained PUF from the three foam formulas and the reference are shown in Figure 11.
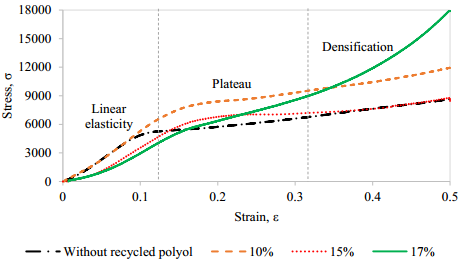
The linear elasticity was controlled by the PUF internal cells flexion. As the compression was higher, the internal cells collapsed, as shown in the middle part of the curves (flat zone) when the tension was nearly constant [30]. Finally, the curves slope increased, it occurred since the cells walls start to be in contact because compression of the solid but without a relevant deformation, thus the stress increased and also the PUF density, this zone is called densification region [30]. Young modulus (E) of PUF is the slope in the stress-strain curve in the linear elasticity region [30], Table 2.
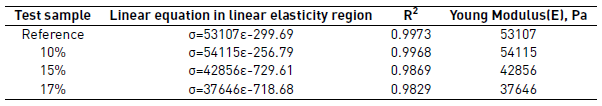
Young modulus for reference and 10% of recovered polyol PUF were quite similar. In the case of PUF containing 15 and 17%, the Young modulus value were lower. It means that when the amount of recovered polyol increases is easier to compress the PUF. This behavior is probably due to the bigger cells and thinner walls in the PUF with more recovered polyol, that geometry is less resistant. The best results for compression and elasticity were obtained for the PUF containing 10% of recovered polyol, that showed the highest Young modulus among PUF with recovered polyols and a value compared with the reference. It means that its elastic properties allow returning to its original shape after compression, a very important property in comfort applications.
4. Conclusions
Glycolysis of PUF waste was carried out with Zn/Sn/Al catalyst to obtain polyol. The polyols were used for the PUF synthesis. The PUF glycolysis in inert atmosphere helped to avoid the polyol oxidation and side products formation. With a PUF/DEG mass ratio of 1.5 a polyol/PUF ratio of 0.66 was obtained using a heterogeneous catalyst, it is a higher amount compared with the traditional homogeneous catalyst that produced a polyol/PUF ratio of 0.61. The highest amount of recovered polyol was achieved for temperature of 190 ºC, 3 h of reaction, 0.01 g of hydrotalcite, 15 g of PUF and 10 g of DEG. The similarities of recovered and commercial polyols were confirmed by FTIR, density and water content. Substitution of 10 % of commercial polyol with recovered polyol, gives similar PUF properties compared with PUF based on pure original polyol, thus the chemical recycling process is technically feasible and a potential choice for waste management in PUF industries.

