


 English (pdf)
 Article in xml format
 Article references
 Send this article by e-mail
 Cited by SciELO
  Cited by Google
  Similars in
SciELO
Similars in
SciELO  Similars in Google
 Permalink
1. Introduction
In the last fifty years, accelerating population growth and disorganized and poorly planned urban sprawl are a social and demographic phenomenon that has exercised a strong impact on the environment; introducing the modification of hydrological cycle patterns such as (infiltration and runoff). This development now causes frequent problems of flooding due to the overflow of rivers.
According to the program for the development of the UNITED NATIONS (PNUD, 2010) [1], "Colombia is a country particularly vulnerable to climate change because of the location of its population in flood zones and in unstable terrain in the upper parts of the mountains range. Colombia also has a high recurrence of extreme events, with a large and increasing incidence of emergencies associated with the weather. Increases in runoff are projected in localities where floods and landslides have occurred in recent decades, phenomena that will take place more frequently due to the precarious infrastructure in areas at risk, further deteriorating the living conditions and quality of life of these communities. "
The city of Tunja has not been immune to the problem, as the population of Tunja has doubled from 1985 to 2015 [2]. Along with this growth is the disorganized development of infrastructure (housing, roads, bridges, etc.) that forces changes in land use and inevitably leads to the destruction of strategic ecosystems (forests, fell, wetlands, etc.). During the years 2010 through 2012, as a consequence of the phenomenon of “La Niña,” the city of Tunja suffered a major overflow of the Vega and Jordan rivers, causing the flooding of approximately 15 neighborhoods, affecting about 500 families, many of whom lost all their property. Likewise, malls and schools stopped operating, reporting countless material losses and physical damage to their facilities.
By means of this project, public and/or private entities can have a tool to evaluate and manage flooding in urban areas of the city of Tunja. For this project, it was necessary and imperative to obtain information from official entities (Corporación Autónoma Regional de Boyacá - CORPOBOYACA and Instituto de Hidrología, Meteorología y Estudios Ambientales - IDEAM), and to engage in field work to define specific characteristics of existing structures (bridges, box culvert and railways) throughout the riverbeds of the Jordán and Vega rivers.
Once this information was obtained, the hydrological model used was the HEC-HMS computational tool, developed by the Hydrological Engineering Center of the United States Corps of Engineers, taking into account the following parameters: a) net precipitation, loss method (SCS Curve Number); b) method of transformation (SCS Unit Hydrograph); c) Base flow method: it was not used, considering the dry riverbed before rain; d) Muskingum method of flood routing. The parameters were selected taking into account the ease of application of the methods and the knowledge of necessary variables (area, length, slope and shape of the basin). Finally, the flow hydrographs were obtained for the calculation of the flood zones of the city of Tunja.
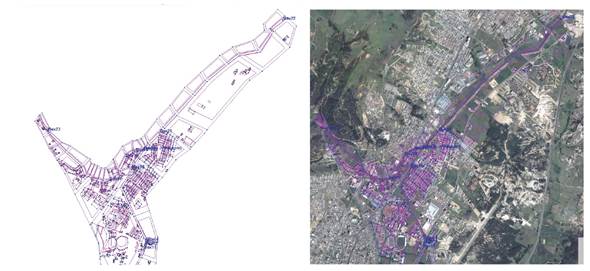
The hydraulic calculation was done using the two-dimensional model IBER, which is a numerical calculation tool for free-flow water flow and variable regime, for hydrodynamic studies in irregular geometries, with numerical schemes of high resolution allowing the calculation of discontinuous flows and working in two dimensions with a mesh formed by quadrilaterals or triangles [3]. In our case, a mesh of a structured type was developed along the Jordán and Vega riverbed, generated from four-sided geometric surfaces, while in neighboring areas an unstructured mesh, with triangular geometries, was created. Four boundaries conditions were loaded, three inputs with their respective hydrographs of flows corresponding to the sub-basins of the Vega river, Jordán upriver and Jordán downriver and one exit. The Manning coefficient employed was associated to the soil use of the study area.
From the results obtained with the hydraulic model corresponding to a return period of 100 years, critical sectors of interest were identified and the implementation of conventional works (extension of Box Culvert and construction of containment walls) were proposed to prevent and relief flood risks. For that, those areas of the rivers prone to overflows were identified and transversal profiles were generated tending to show the difference of quota existing between the water sheet and the ground.
2. Theoretical Framework
The HEC-HMS (Hydrologic Modeling System) model is a rain-runoff model, developed by the Hydrologic Engineering Center (HEC) of U.S. Army Corps of Engineers (USACE), which is designed to simulate the hydrograph of runoff that occurs at a certain point in the river network as a consequence of a rainy period. Simulation of the drainage network of a basin forms the basis of the model. All other options are developed on the hydrographic calculation capacity at any point in the basin [4]. The components of the model are based on simple mathematical relationships that try to represent the processes involved in the generation and circulation of runoff hydrographs: losses, transformation of excess rainfall into basin outflow, addition of base flow, circulation of the hydrograph by the riverbed, etc. In this case, there are a number of constraints or limitations that the model has applied for different reasons: a) The simulation is limited to rain events (model of events), consequence of the model's own application to the simulation of avenues; and b) In the modeling, subsurface runoff is not included because it does not have values of the parameters that characterize itself.
On the other hand, "The mathematical modeling of the flow of water in a river consists of predicting the values that the hydraulic variables take (depth, velocity, flow, etc.) from the numerical methods of equations obtained with a series of hypotheses. For the study of the effects of avenues propagation in rivers, one-dimensional or two-dimensional models can be used. The need to study increasingly complex phenomena, and the observation of two-dimensional flow in nature, where the horizontal dimensions predominate over the vertical, together with the increasing capacity and velocity of computers, has led to the use of two-dimensional equations and schemes (shallow water equations). Some of the tools available and using finite volumes are Infoworks, Guad2D, the latest versions of Mike-21 and Iber”. [5]
Iber is a two-dimensional mathematical model for the simulation of flow in rivers and estuaries developed from the collaboration of the Water Engineering Group and the Environment, GEAMA (Coruña University), Mathematical Engineering Group (Santiago de Compostela University), Flumen Institute (Polytechnic University of Catalonia) and International Center for Numerical Methods in Engineering (CIMNE) and promoted by the Center for Studies Hydrographic of CEDEX. Some of the fields of application of the current version of Iber are:
Simulation of the flow in water free surface in natural riverbed.
Assessment of flood zones. Calculation of preferential flow zones.
Hydraulic calculation of pipelines.
Hydraulic calculation of channels networks in water free surface.
Calculation of tidal currents in estuaries.
Stability of bed sediments.
Processes of erosion and sedimentation by transport of granular material. [5]
From the physical laws of conservation that govern the flow of a fluid in general (conservation of mass, conservation of the amount of movement and constitutive equations), in the case of an incompressible and isotropic fluid, such as water, Navier-Stokes equations can be derived for the instantaneous movement, and from them, considering average variables in time, the Reynolds equations can be deduced of these, integrating in the depth to eliminate in them the vertical dimension. Then, the two-dimensional Saint Venant equations are obtained, valid when the flow to be represented also has this two-dimensional character, with small vertical velocities, slopes of the bottom of the smooth channel, and in general the horizontal dimensions are predominant over the vertical [5]
In the hydrodynamic module, the equations of conservation of mass and for the moment in the two horizontal directions are solved: Equation (1).
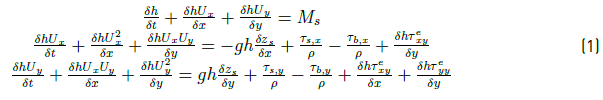
Where h is the depth, U x , U y are the horizontal velocities averaged in depth, h is the water depth, t is time, x and y are the space terms, g is the acceleration of gravity, Z s is the water free surface elevation, τ s is the friction at the free surface due to the friction produced by the wind, τ b is the friction due to the friction of the bottom, ρ is the density of the water, τ e xx , τ e xy , τ e yy are the horizontal effective tangential tensions, and MS is a water mass source/sink term, through which precipitation and infiltration processes can be modeled.[5]
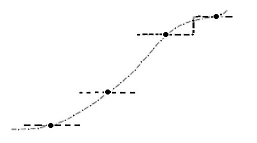
The treatment of the dry-wet fronts used in IBER is stable, conservative and non-diffusive, that is, the fronts are adequately solved, without numerical type instabilities, even when they occur on strong bottom slopes. Each finite volume has a background dimension associated with it. In a schematic way, the bottom can be represented as is shown in Figure 1. [6]
Between two volumes with a different bottom dimension, one of the situations can be produced, which is represented in the following Figure 2:
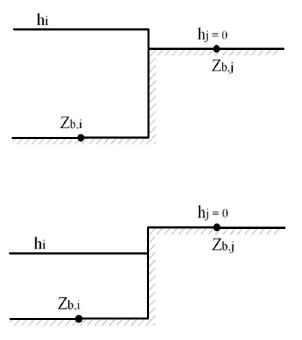
In Figure 2, in the second case the level of the free surface in the wet cell is higher than the bottom level in the dry cell, while in the third case it is lower. Only in the third case it is necessary to use a special treatment, which consists in redefining the slope of the bottom and imposing a reflection condition on the front. In this case, the slope of the bottom is redefined as Equation (2): [6]
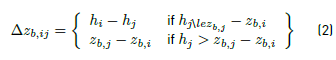
Where h is the depth, and Z is the elevation channel.
The condition of reflection is imposed as Equation (3) with the cells flows and his normal vectors (q, n):

Using the above conditions provides a hydrostatic solution accurately for any bathymetry, without spreading the front and without generating spurious oscillations on the free surface. This type of treatment of the dry-wet fronts has been successfully used both for modeling stationary and non-stationary processes, being particularly useful for the simulation of flood zones in rivers and coastal areas, as well as for calculating the evolution of the front of tide [6]
According to the IBERAULA website, IBER version 2.4.3 consists of a hydrodynamic module that allows two-dimensional simulation of channels, thus giving the possibility of defining flood zones. In this model, both the hydrodynamic equations, the turbulence models and the sediment transport model, are solved integrally by the finite volume method in a non-structured net. The method of finite volumes is one of the most widespread and commonly used in fluid dynamics because it is very efficient for the resolution of conservation laws.
The characteristics of the numerical schemes used in Iber are the following:
Schemes in finite volumes, proposed in an integral and conservative way.
High-resolution off-center Roe type schemes.
Ability to solve subcritical, supercritical and regime changes.
Non-structured nets formed by 3 or 4-sided elements.
Explicit time schedules.
Treatment of dry-wet fronts using stable and conservative schemes (without loss of mass).
The hydrodynamic module of IBER has the capacity to deal with the following processes:
Non-stationary flow in fast and slow regime.
Formation of non-stationary hydraulic shoulders.
Bottom friction as formulated by Manning.
Non-stationary flood fronts.
Turbulent voltages calculated according to different turbulence models.
Temporal variation of the bottom level due to sediment transport.
Conditions of open contour type: hydrograph, tide level, critical discharge, landfill, expense curve.
Wall boundary conditions: free slip, wall friction according to logarithmic law.
Internal boundary conditions: bridges, landfills, gates, culvert.
Dams breach formation for stud breach studies.
Infiltration according to the formulations of Green-Ampt, Horton, Lineal.
Surface wind friction according to Van Dorn formulation.
In a two-dimensional problem, it is necessary to distinguish between two types of contours: open and closed. The closed contours, also called wall-like contours, they are impermeable, not allowing the passage of the fluid through them. In both open and closed contours, it is necessary to impose boundary conditions on the hydrodynamic equations of St. Venant. [5]
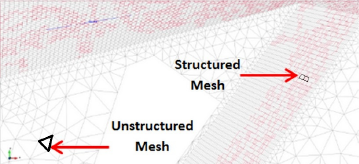
To solve a differential equation by the finite volume method, it is necessary to make the domain to be studied spatially discrete. For this, the studied domain is divided into cells of relatively small size (calculation mesh). Iber works with structured and unstructured meshes (show Figure 3] formed by elements that can have 3 or 4 sides. Irregular elements of 3 and 4 sides can be combined within the same mesh. The main advantage of working with unstructured meshes is the ease with which they adapt to any geometry, since it is not necessary for the mesh to have any type of organization or internal structure. This feature makes them particularly suitable for use in river hydraulics. [5]
The Iber model, the work platform of this work, is based on a mesh that is adapted to the topography of the area, and where each mesh element corresponds to a finite volume, according to the resolution type of the characterization equations of the flow. In this way, each element handles input and output variables with interconnection to the rest of the elements. In order to differentiate the type of modeling according to the zone of water interaction within the basin, a differentiation of the cell type has been defined within the domain rendered spatially discrete in finite volumes, by means of cells of Contribution and cells of Rio [7]
Faced with the pre and post-process of the Iber model, the user interface has been created for the GiD program developed by the International Center for Numerical Methods in Engineering. GiD is a pre and post process program for numerical simulations, designed to be adapted and customized according to the requirements of the numerical model. With integration, a complete numerical simulation tool is achieved, with great flexibility and friendliness. Similarly, the interface allows for managing the pre-processing of all the information required for calculation, from geometry, contour conditions, roughness, etc. to the generation of the calculation mesh. It allows visualization of the results of the simulation both during the calculation and once finished. In order to work with Iber, it is necessary to provide the program with topographic information through meshes and certain hydraulic information that varies according to the type of calculation that we are going to develop [5].
3. Hydrological Model
From the digital rise model of the Chicamocha River High basin supplied by CORPOBOYACÁ, the geographic parameters of the sub-basins were obtained using the ArcGIS 10.3 program with the extension Hec-GeoHMS. The hydrological model was developed using the HEC-HMS software, which is a global model used to obtain hydrographs of flows in each of the sub - basins. The rainfall data were calculated using the alternate blocks method, which means that the IDF curve data was provided by the IDEAM. Once this information was obtained, the time of concentration of each sub-basin was calculated using the Temez formula. For the development of the hydrological model, it was necessary to adopt some considerations such as: 1. Net precipitation losses method - SCS Curve Number; 2. Transformation method (SCS Unit Hydrograph); 3. Base flow method: it was not used considering dry run before rain; 4. Muskingum propagation method. The choice of considerations was made taking into account the ease of application of the methods and the knowledge of necessary parameters.
3.1 Geometric Scheme of the Basin
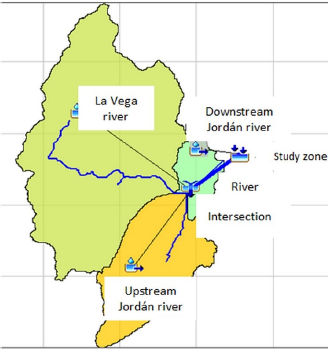
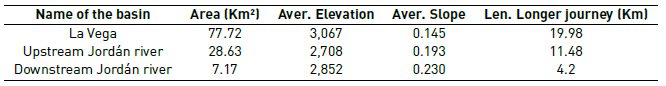
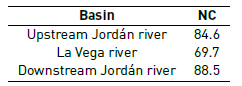
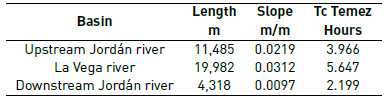
For the study of the basin, the digital elevation model with a resolution of 30 meters per pixel has been used. This information has been treated using the program Hec-GeoHMS to subdivide the basin into sub-basins of characteristics as homogeneous as possible, in order to work with the HEC-HMS hydrological model. As a result, the basin has been subdivided into three sub-basins, one corresponding to the Vega river, another to the Jordan River before the confluence with la Vega river, and another after the confluence to the point of departure of the study area. The Characteristics of each sub-basin are shown in Figure 4 and Table 1:
3.2 Rainfall study
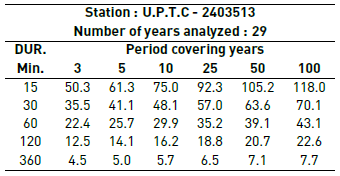
Any event of rain causes a runoff by the surface of the basin and its magnitude or nullity depends on the type of terrain and its permeability. This runoff is associated with some parameters of the basin. Within these parameters, there are some known to be invariable, such as the area of the basin, the slope, the length of travel of the water, etc.; however, the precipitation is variable in each event, for the calculation of the flood it is necessary to calculate a probability of occurrence of extreme rainfall, this probable rainfall is calculated on the basis of rainfall data recorded in the study basin. The way to obtain this is by the frequency of a magnitude of rain, which is called occurrence for a period of return (show Table 2].
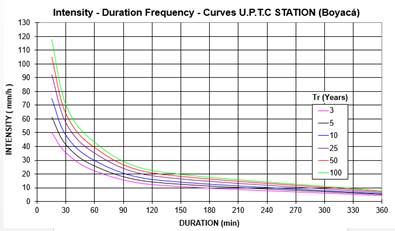
For this calculation, precipitation data recorded from 1963 to date were used at ESTACION U.P.T.C (BOYACÁ)-COD: 2403513. Station managed by IDEAM, who also provided us with the Frequency Intensity curves (show Figure 5] used in the elaboration of the hydrological model.
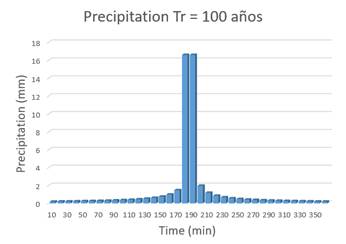
3.3 Calculation of Rainfall Project by the Alternate Blocks Method
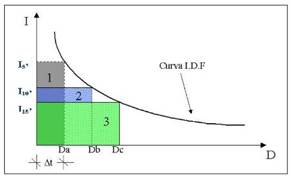
According to the Department of Hydraulic Engineering of the Polytechnic University of Catalonia, it is without a doubt, the most widespread method for obtaining a project rain from the IDF exclusive curve. The hyetograph produced (show Figure 6] by this procedure specifies the precipitation at a number of time intervals Δt for a rain of total duration Td = nΔt. Once the desired return period is selected, the precipitation intensity data of the IDF curve are taken for durations Δt, 2Δt, 3Δt, as well as the total precipitation obtained by multiplying the intensities by the rain durations. It is a question of estimating the most unfavorable rainfall intervals, according to Figure 5. For the time Δt, for example 5 minutes, the maximum rainfall amount is the direct data of the IDF curve. Therefore, we have a block of rain with a duration of 5 minutes and with a precipitation intensity indicated by the IDF (show Figure 7]. [8]
3.4 HEC-HMS Hydrological Model
With the HEC-HMS model, the losses of the precipitation, the generation of runoff and the propagation of the flows were calculated. Finally, the flow hydrographs were used to calculate the flood zones.
Loss of Precipitation
The model HEC-HMS considers calculations of losses of precipitation either by interception or infiltration. Once the loss is calculated, it is subtracted from the precipitation to obtain the net rain that is involved in the process of runoff. The HEC-HMS model contains several methods to determine losses, some of which are not applicable to our study basin.
For our study, we will adopt the SCS curve number method. Ven Te (1984) was developed by the US Natural Resources Conservation Service (NRCS), originally called Soil Conservation Service (SCS), to calculate effective rainfall as a function of accumulated rainfall, soil cover, land use, and moisture conditions. [9]
Number of Curve (CN)
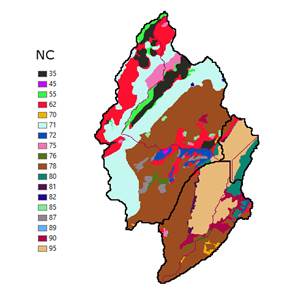
The curve number has been obtained from the sources of CORPOBOYACÁ. The CN (II) was used, in other words for normal humidity conditions (which corresponds to the average of the humidity conditions that occur when the maximum annual level occurs), this being the condition that best fits the study area and the one most used for this type of hydrological modeling. With HEC-GEO-HMS, the discretized CN value for each sub-basin was obtained according to the Figure 8 and Table 3.
Runoff Generation
To transform the net rainfall in runoff, the model allows choice between several methodologies. In our case, the methodology based on the application of the unit hydrograph was used. The Table 4 shows the times of concentration of the sub-basins.
Flow Propagation
To calculate this modification of the hydrograph, the model propagation, HEC-HMS has several methods; we will use the Muskingum Method of flood routing in our work.
The Muskingum method was presented by McCarthy and handles variable flow-storage ratios. This method models the storage in a basin by the combination of two types of storage: a prismatic storage, formed by a volume of constant cross-section along the prismatic flow, and a wedge storage, formed by the difference between the inlet and outlet flows, or by the slope of the water sheet in the considered section. [10]
The total storage in the section would be then the addition of both storages Equation 4 and Equation 5.

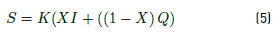
Where S is the storage (base flow, S p , and peak storage, S c ), and K, X, geometric and morphometry constants.
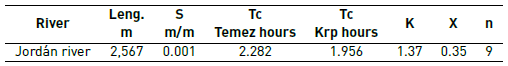
This equation represents the linear model of storage for the propagation of avenues in channels by the method of Muskingum. For Parameter X we will take the value of 0.25 in all cases. The parameter K, will be equal to three fifths of the travel time that can be calculated with the formula of Témez or that of Kirpich (show Table 5].
Result of Hydrograms
After the simulation of the hydrological model in HEC-HMS, the following results were obtained:
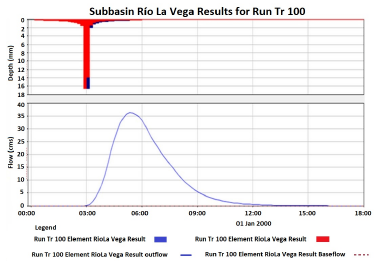
The Figure 9 shows the outflow hydrograph of the Vega river sub-basin, with a maximum flow rate of 36.4 m3 / s associated with a return period of 100 years and a response time of the sub-basin of 2 hours and 20 minutes.
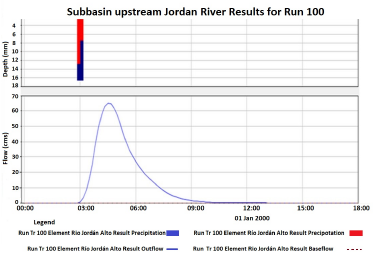
The Figure 10 shows the outflow hydrograph of the Jordán river sub-basin high part, with a maximum flow rate of 65 m3 / s associated with a return period of 100 years and a response time of the sub-basin of 1 hour and 30 minutes.
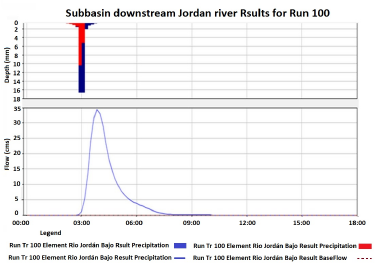
The Figure 11 shows the outflow hydrograph of the Jordan River low with a sub-basin, with a maximum flow rate of 34.4 m3 /s associated with a return period of 100 years and a response time of the sub-basin of 50 minutes.
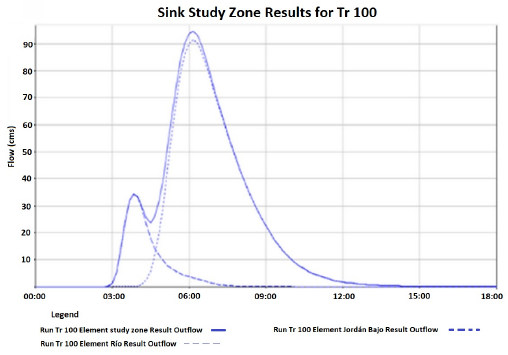
The Figure 12 shows the exit hydrograph of the study area, as well as the hydrograph of the Jordan River Lower part and the hydrograph of input at the point of confluence of the sub-basin La Vega and Rio Jordán Alto, with maximum flood flow of 94.7 m3 / s associated with a return period of 100 years and a sub-basin response time of 3 hours and 10 minutes
4. Hydraulic calculations with the IBER two-dimensional model
With the hydrological model of the river basins of the Jordán and Vega rivers defined in the previous chapter, we proceeded with the implementation of the hydraulic model, with the urban center of the city of Tunja understood as the study area for this purpose the IBER two-dimensional model was used. Taking into account that the objective of the project was to identify potential and flood-prone areas in the city, we worked with flows associated with a return period of 100 years. The digital elevation model used corresponds to information supplied by CORPOBOYACÁ on flights with LIDAR technology with a resolution of 1 x 1 m. The adopted considerations were: a) the generated mesh was of structured type (network of rectangles) and unstructured (net of triangles) on geometries and defined areas; b) The allocation of the coefficients of Manning is a function of the different coverings of soil present in the study area; c) Within the boundary conditions, three inputs were configured with their respective hydrograph of flows (defined in the previous chapter - hydrological model in HEC HMS) and one output; d) As starting data, it was assumed that the elements of the mesh were dry and that there was no base flow; and e) The total time of simulation was 41,200 seconds guaranteeing the flood routing. Each of the above procedures is described more clearly below.
4.1 Topography and calculation mesh
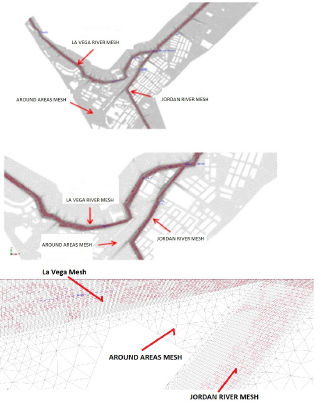
To solve a differential equation by the finite volume method, it is necessary to render the domain to be studied spatially discrete. Therefore, a computational mesh was required to divide the study domain into small-sized cells. For the case of our project, we worked a structured mesh in the channel of the rivers composed by blocks of 1 x 2 m., this was done manually by the generation of surfaces in four-sided geometries [Figure 13]. On the other hand, in the areas surrounding the river bed an unstructured mesh was defined as small contrivances in places where the geometry of the terrain is more rugged and larger triangles (maximum 10 m) in the flat areas and less-rugged relief. According to the above, Figures 14 and 15 were obtained in IBER.
4.2 Boundary Conditions
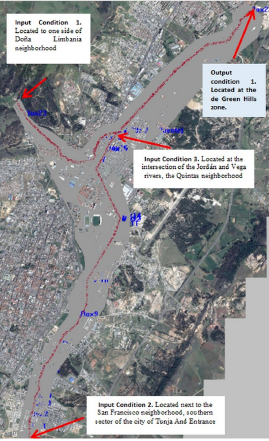
The following conditions of input were defined (show Figure 16]: Entrance 1. Located to one side of Doña Limbania neighborhood, western sector exit of Arcabuco town. Entrance 2. Located next to the San Francisco neighborhood, southern sector of the city of Tunja And Entrance 3. Located at the intersection of the Jordán and Vega rivers, the Quintas neighborhood; each one with its respective hydrograph of flow obtained in the HEC-HMS hydrological model for the sub-basins of the Jordán high, Jordán low and Vega rivers. Likewise, an output contour element was assigned in the sector of Green Hills to the north of the city.
4.3 Initial Conditions
In two-dimensional modeling, as an initial condition, it is necessary to assign on each element, the amount of water that the model has at the beginning, which can be put in the form of a draft or water sheet. For our case, a value of zero was assumed, in other words the program will automatically consider all elements of the dry mesh as its initial condition.
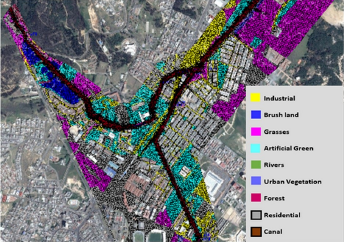
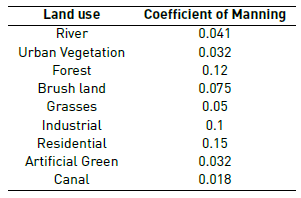
4.4 Manning coefficient
Regarding the manning coefficient, this varies mainly by the use of soil and some other characteristics (show Figure 16]. For the case of our area of study, the following values were considered (show Table 6]:
4.5 Hydraulic Model Results
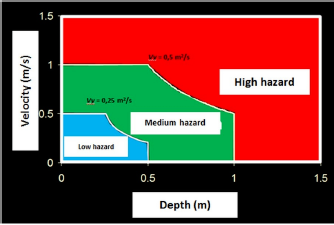
In the case of hazardousness, IBER numerically quantifies this criterion in terms of the depth and velocity associated with a return period. According to Directive 2007/60/EC of the EUROPEAN PARLIAMENT AND OF THE COUNCIL of 23 October 2007 on the assessment and management of flood risk, as well as Royal Decree 9/2008 of the Catalan Water Agency (ACA), three levels of hazard are defined which are shown in the following Figure 17.
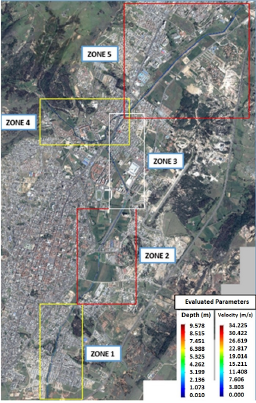
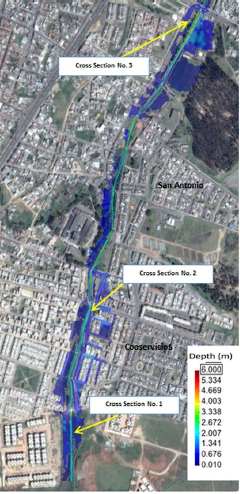
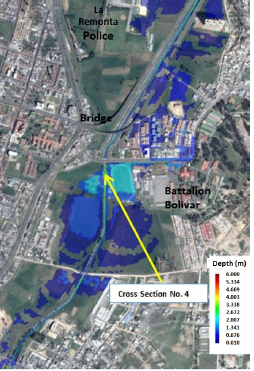
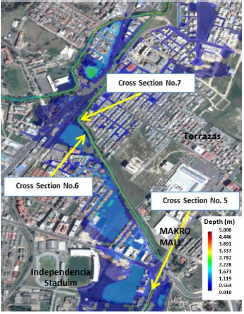
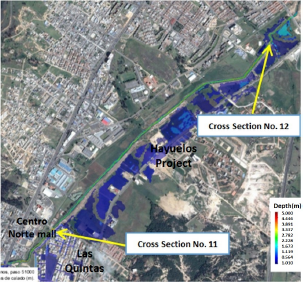
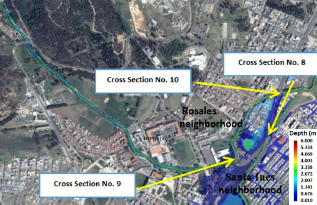
Taking into account that the magnitude of the geographic zone corresponds to the whole city of Tunja, five zones [Figures 18, 19 and 20] were defined for the presentation of results. These zones were defined covering stretches of river with similar lengths, but basically the selection was made by way of spatial visualization of the results generated by the model in a clear and understandable way; in other words, there is no defined technical criteria.
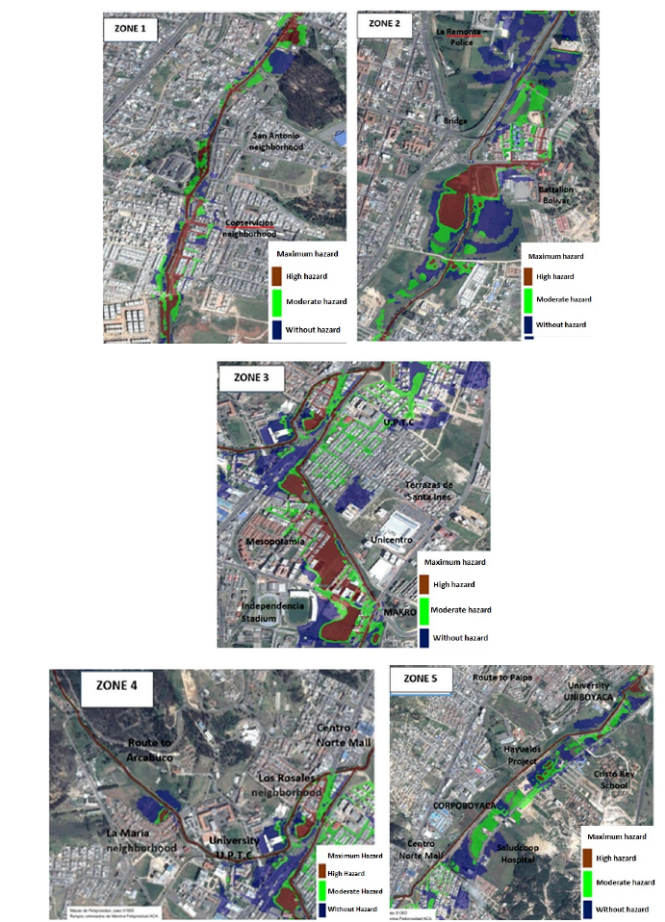
4.6 Results Analysis
From the results obtained in the hydraulic model with IBER corresponding to a return period of 100 years, points of interest were identified in which there is an overflow of Jordán and Vega rivers and in which the impact produced by flooding is important, show Figures 20 to 24.
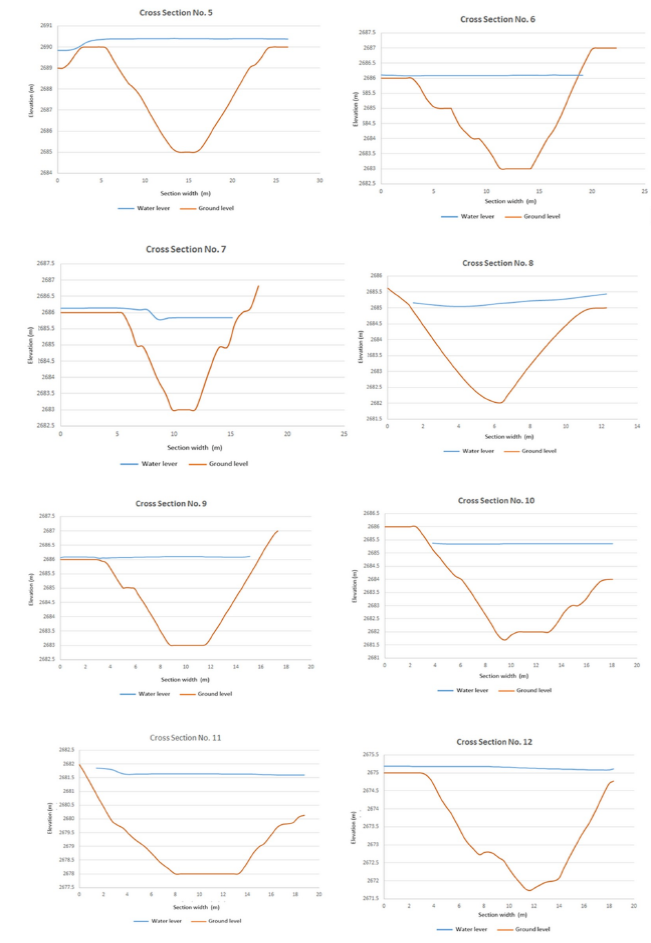
As a result, eight (8) overflow points were identified in the Jordán high River, (2) in the Vega River and two (2) in the Jordán low River, which are shown in the following illustrations. For each of them, the cross sections of the river (show Figure 25 was defined that shows the maximum level of the water sheet with respect to the terrain.
5. Conclusions
The information used for the development of this study comes from official sources (Corporación Autónoma Regional de Boyacá-CORPOBOYACÁ y el Instituto de Hidrología, y Estudios Ambientales IDEAM). As for the information about structures such as box culverts and bridges, it was derived in situ.
The methods considered in the hydrological and hydraulic model work well for basins with characteristics similar to those found in the study area. However, some were also selected based on existing information.
The results obtained through the implementation of the hydraulic model with IBER were the expected ones according to the antecedents experienced in the city. The model allows prediction of flooding and a hazard footprint in accordance with historical flood events; it allows the identification of points of interest along the Jordán and Vega rivers that are susceptible to overflows.
In most cases, floods in the city of Tunja occur as a consequence of the lack of hydraulic capacity of the existing structures (box culvert), since these were mostly designed without an adequate hydrological study, for which in an event of extreme rain causes damming of the channel and eventual overflow upstream.
The hydraulic model allowed for some corrective, preventive and mitigation measures, such as: construction of a culvert with sufficient hydraulic capacity, construction of gillnets, inclusion of risk areas in the Territorial Arrangement Planning, respect for river rounds, which will be presented to government entities in order to be taken into account in future investment projects. Finally, it shows how some zones of urban expansion, specifically the northeastern part of the city that goes from the Las Quintas to Green Hills and where the development of important projects is planned (a mall in front of the Cafesalud clinic and a residential project Hayuelos) are prone to major flooding, and therefore it is recommended that in this section the river round areas be respected and protection works be built.
Finally, for the city of Tunja and the state [of Boyacá, the first experience with the implementation of this type of hydrological and hydraulic models will serve as a base tool for the development of innumerable future projects and for the efficient planning of investment projects that will tend to reduce the social and environmental problems caused by flooding.
6. Recommendations
In spite of working with all the available official information, the hydrological model could not be calibrated, since much of the information on the basins studied was not available in usable format. This leaves open possibilities for future thesis projects to develop with a view to strengthening the products and results generated by the present study.
CORPOBOYACÁ is contemplating the installation of three limnigraphic stations between the Muiscas and the Copa dam. However, for a hydrological study to be representative, it is necessary to have information going back at least 10 years. Once started, they will become an important point of reference for the flow hydrograms used in the present study.

