


 English (pdf)
 Article in xml format
 Article references
 Send this article by e-mail
 Cited by SciELO
  Cited by Google
  Similars in
SciELO
Similars in
SciELO  Similars in Google
 Permalink
1. Introduction
In many applications of mechanical engineering, the rotating elements of machines such as axles, cranks, and crankshafts, are subjected to conditions of shear loads during operation, which may result in deformation that affects proper operation. Therefore, the materials used to fabricate these elements must resist the torsional stresses applicable to them by external loads.
Also, the fatigue life of these components is known to be highly dependent on the physical state of its surface. Thus, proper attention must be paid to the specifications of surfaces when parts are dimensioned in fatigue. To describe the surface condition, three parameters are usually considered: a) geometry: surface roughness; b) mechanical: residual stresses and surface hardness; c) metallurgical: microstructure [1].
There have been several contributions on the examination of fatigue life due to surface quality. Shamsaei and Fatemi [2] studied cyclic deformation and fatigue behavior of case-hardened 1050 steel in torsion. They found that significant weight reduction of 50% could be obtained by changing the solid cross section configuration to tubular configuration, while maintaining the same torque carrying capacity. Bonglae and Shahriar [3] presented experimental and analytical results on the deformation behavior of carburized steels, under cyclic stress conditions including axial and torsion loadings. They concluded that under torsional loading, the carburized steel exhibited cyclic softening behavior.
Fatigue fracture initiation usually occurs at the material surfaces, especially in high cycle fatigue; hence it may be expected to effectively enhance the fatigue life by means of surface modifications [4]. Various investigations have been carried out for enhancing the resistance to fatigue fracture of components. Huang et al. [5] demonstrated that the enhanced fatigue resistances of the surface mechanical grinding treated (SMGT) samples of martensitic stainless steel can be attributed to the formation of the gradient nano-grained (GNG) structure with a hard surface layer. Works from Villegas et al. [6] and Dai and Shaw [7], also indicated that the enhancement via a surface nanocrystallization and hardening (SNH) process originated from the nanostructures and the work hardening of the surface layer.
Moreover, many manufacturing processes introduce deformations which improve materials properties, such as fatigue resistance. For example, torsion is widely used because high deformations are achieved with no shortening or lengthening of the component during the process. Thus, in the car industry, the torsion bars are subjected to large permanent torsion deformation as a means of increasing its shear strength [8].
This review indicates the importance of gaining a better experimental understanding of how the torsion process affects the functional behavior of the workpieces, as it may enhance the fatigue resistances of the surface. Therefore, the aim of this research was to study the effect of the angle of twist, on the microstructure and microhardness profile of annealed AISI 1045 steel subject to torsion. From these results, the overall objective was to develop a simple expression for the prediction of the hardness profile considering the main process parameters: radius (r), and angle of twist (θ).
2. Literature review
In engineering, torsion is presented as the twisting of a straight bar by the exertion of a torque which tends to produce a rotation about the object own longitudinal axis. Consider the solid bar of length (L) with circular cross-section of radius (r) subjected to torques (T) acting at the ends, as shown in Figure 1. For this case, it is assumed that the left end of the bar is fixed, while the right turns a small angle (, known as the angle of twist [9].
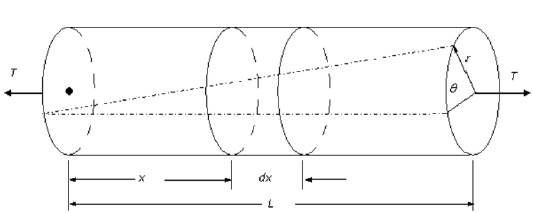
It is important to highlight that by considerations of symmetry, each cross-section of the bar do not change shape while rotating as a rigid entity around the longitudinal axis, remaining all sections flat, circular and radius straight. In addition, the length of the shaft remains constant.
From the shaft in Figure 1, an infinitesimal element of length (dx) between two cross-sections is examined in Figure 2. Since the distance is infinitesimal, the difference in rotations of the cross-sections, defined by the angle (dθ), is also infinitesimal. As the cross-sections sustain the rotation (dθ), segment (ab) deforms into (ab´). By observing this distortion, it can be established that the angle (γ) is the shear strain of the element.
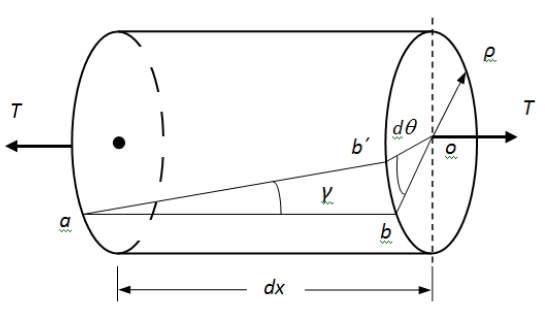
From the geometry of Figure 2, the distance (bb´) can be expressed as (γdx) or also as (ρdθ), where (dθ) is measured in radians. The obtained formula for the shear strain is expressed by Equation (1):
The quantity (dθ/dx) is the rate of change of the angle of twist, with respect to the distance (x) measured along the axis of the bar, i.e. the angle of twist per unit length denoted (θ). With this notation, the equation for the maximum shear strain (γ max ) in the outer surface of the bar results in Equation (2):

Equation 2 shows that the shear strains in a circular bar vary linearly with the angle of twist (θ) and the radial distance (ρ) from the center, where it is zero, to the outer surface, where it is maxim.
If the material of the bar is linear-elastic, the shear stresses (τ) can be determined from Hooke's law on cutting state, and is defined in Equation (3) [10]:

Where, G is the shear modulus or modulus of rigidity.
Substituting Equation (2) in Equation (3) results in Equation (4):

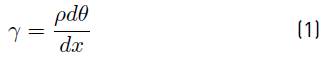
This equation shows that the shear stresses vary linearly with distance from the center of the bar to give the maximum shear stress on the outer surface. The variation of the shear stress acting on the cross-section is illustrated in Figure 3.
3. Experimental procedure
In this research, the base material used was AISI 1045 steel (0.455± 0.01% C and 0.82± 0.01% Mn) supplied in bars at a cold-drawn state, nominally 38.1 mm in diameter and 3,000 mm in length, which were cut to 170 mm in length prior to machining.
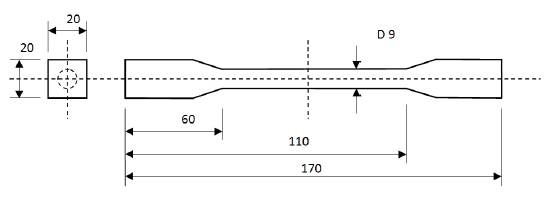
Cylindrical samples for torsion testing [Figure 4] were turned on a CNC lathe. To ensure good surface quality due to the tool wear [11, 12], the processes were performed using constant cutting parameters, abundant quantity of water-soluble oil coolant and ISO code - DCMT11T308MU carbide inserts with a nose radius of 0.8 mm.
For recrystallization, grain-growth, and stress relief of the material, the annealing of the samples was carried out at a temperature of 870 °C for 1 h, according to a previous experimental research with AISI 1045 steel [13]. All the test specimens were subjected to slow furnace cooling.
A free-end torsion machine was used for the torsion test, which gives a constant strain rate on the surface of the sample in all the measurements. The specimens were twisted by applying angles of twist of 90, 180, 270, 360 and 450 degrees, with two repetitions each.
After torsion, test samples from each specimen were cut perpendicular to the axis direction of the bar, within the machined length. The cross-sectional areas of these samples were then mechanically polished and etched according to ASTM E3-11 standard metallographic techniques [14].
To determine the distribution profile, microhardness measurements were carried out on the cross-section of the deformed samples as a function of radius starting from the center to the edge, with 0.5 mm spacing. Three indentations were made for each distance. The microhardness measurements were performed on a Buehler Vickers hardness tester, with a constant load of 200 gf for 15 s according to ASTM E384-11 standard [15]. Finally, the average microhardness was calculated by eliminating the values that were significantly outside the range differentiated by the other measures.
The experimental results for average microhardness profiles were then analyzed using analysis of variance (ANOVA) at a confidence level of 95%, to see which process parameters; radius (r), and angle of twist (θ) are significantly affecting the responses. The significance level was based on the P-value as [16]:
Insignificant if P > 0.10
Mildly significant if 0.05 < P < 0.10
Significant if P < 0.05
The ANOVA model was modified to represent the relative importance of each parameter and their cumulative percentage contributions using a PARETO-ANOVA diagram. Finally, using multiple linear regression methods [16], a statistical mathematical expression was created for the prediction of the microhardness profile.
4. Results and discussion
The graph of microhardness profiles measured along the radii for tests with each evaluated angle of twist is shown in Figure 5. Each point on the plot represents the average of measurements at the same distance. As was expected, the curves describe the same shape for different angles of twist, with higher values of hardness on the surface of the samples continually decreasing towards the centers [17]. It is also observed, that as the angle of twist increases, the overall microhardness values increases [18]. These results are in agreement with the fact that shear strains and shear stresses vary with the distance from the center of the sample and the angle of twist applied, as proved in the literature review [9, 10].
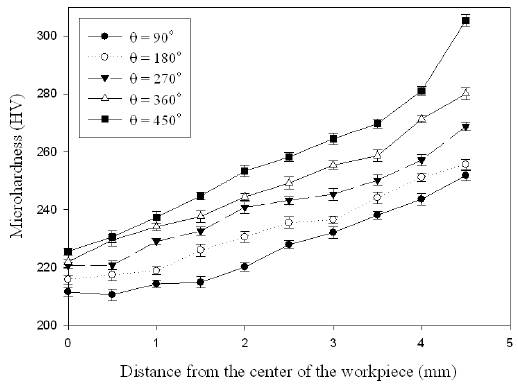
Figure 5 Values of the Vickers microhardness versus distance from the centers after torsion for various angles of twist
The resulting microstructure near the surface at a cross-sectional area of a sample subjected to severe torsion conditions was compared with a representative after annealing heat treatment sample. It was observed that as consequence of the torsion process, the pearlitic and ferritic microstructure is unchanged. The structure has no deformed features, no angle disorientation of grains and the lamellae in pearlite colonies were not deformed or locally fragmented. Therefore, it can be implied that the measured rise in microhardness might be related to the plastic deformation and residual stresses introduced into the material.
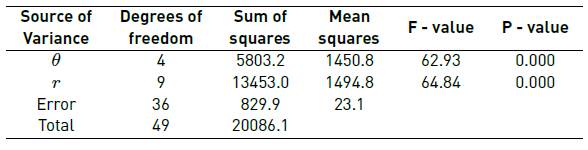
Table 1 shows the results of the analysis of variance (ANOVA) performed on experimental data with a confidence level of 95%, made with average microhardness values for different values of distance from the center (r) and the variation of the angle of twist (θ). The results put in evidence that all main factors are significant affecting the microhardness (P < 0.05) [16]. Additionally, F-test decides whether the parameters are significantly different. A larger F-value would show greater impact [16], in this case they have similar impact on the microhardness.
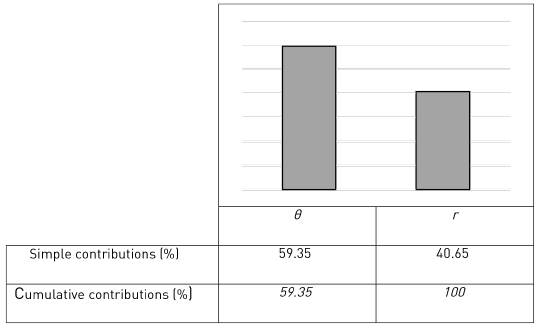
The effect of each individual factor, as well as their interactions, can be analyzed from the Pareto chart illustrated in Figure 6. In this chart, the length of each bar is proportional to the absolute value of its estimated effect or associated contribution. According to the performed Pareto chart, the angle of twist was found to be the major factor affecting microhardness values (59.35 %), while the distance from the center was found to be the second-ranking factor (40.65 %).
Using the significant regression coefficients, the final model for the prediction of the microhardness profile could be constructed as given in Equation (5):

R2 = 0.941
R2 adjusted = 0.939
This expression was chosen because: the value of R2 showed that 94.1% of the observed variability could be explained by the independent variables. Also, the R2 adjusted meant that the correlation coefficient between the value of the dependent variables and the predicted value based on the regression model is high [19].
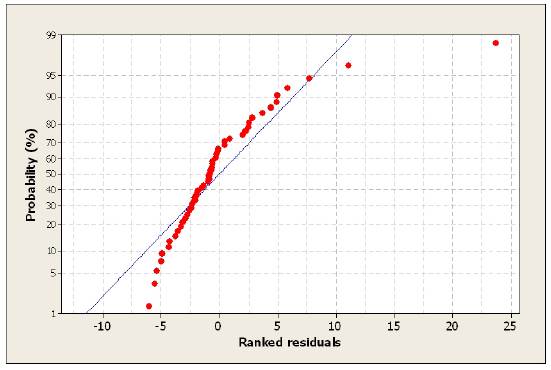
The normal probability plot for the model is shown in Figure 7. The general tendency reveals that the residuals fall in a straight line, showing that the errors are distributed normally, and implying that the dependability of the expression is proven [16].
5. Conclusions
In the limits of tests, based on the results of this study for annealed AISI 1045 steel, the following conclusions can be drawn:
The hardening of the material was related to the plastic deformation caused by the torsion process rather than by microstructural transformations.
The microhardness increases when the torsion parameters, the angle of twist (θ) and distance from the center (r) increase.
It was observed through ANOVA-Pareto that the angle of twist (θ) is the most influential control factor (59.35 %) among the torsion parameters investigated.
The developed model can be used to effectively predict the hardness profile in the torsion of cylindrical bars.

