


 English (pdf)
 Article in xml format
 Article references
 Send this article by e-mail
 Cited by SciELO
  Cited by Google
  Similars in
SciELO
Similars in
SciELO  Similars in Google
 Permalink
1. Introduction
International standard ISO 9613 Part 2 specifies an engineering method to calculate sound attenuation during outdoor propagation to predict sound pressure levels at a certain distance from various sources [1]. In this method, the source of noise emission is considered as a point source and sound emission at any receiver is predicted with reasonable accuracy under conditions that are favorable for its propagation of sound [2].
However, in 2006, van den Berg demonstrated that these calculation results were not only significant underestimations of the expected sound levels at the receptor; moreover, these levels occur primarily in atmospherically stable conditions. In addition, as wind turbines are becoming higher, the difference between the real and estimated sound pressure levels considerably increases [3].
Unfortunately, the problem of noise propagation from wind farms is not easily solved. Significant fluctuations in sound pressure levels obtained from areas surrounding wind farms that are currently in operation are revealed. A large part of this variation may be attributed to the fact that the power of the sound emitted from the wind turbine is a function of wind velocity; however, it is also known that the fluctuations are a result of changes in the sound propagation trajectory from the wind turbine to the receptor [4].
The uncertainty in predicting sound pressure levels using current analytical or empirical models may be significant and may result in the failure to use valuable wind resources in order to avoid possible conflicts arising from the noise produced by the generator. If the sound pressure levels associated with wind farms is precisely calculated, the environmental acceptability of the proposed projects can be adequately evaluated during the planning stage [4].
2. Prediction of noise generated by wind turbines
The sound emitted by wind turbines is irradiated above the ground, i.e., usually at an altitude in between 50 m and 150 m. As the sound propagates, it frequently diminishes if the wind turbine is far from the receptor. The type of terrain and meteorological conditions influence the attenuation of the sound over distance [5]. The tools most commonly used for predicting the sound pressure levels associated with fixed sources generally follow the calculation method proposed in standard ISO 9613 Part 2.
The method established in standard ISO 9613 Part 2 is a general model to predict sound pressure levels at a specific receptor, which originates from known sources. A general method can be applied to a wide range of noise sources and includes most of the main attenuation mechanisms. The method predicts the sound pressure level with an A-weighting filter with a long-term average using octave bands. The model assumes a downwind position and a moderate positive temperature with winds from 1 m/s to 5 m/s, measured from a height in between 3 m and 11 m [1].
The downwind equivalent continuous sound pressure level in the octave bands for a given receptor at a given distance from the sound source may be calculated using the Equation 1 [1]:

where:
Lp = Sound pressure level in octave bands at a given receptor, dB
Lw = Level of sound power in octave bands produced by a sound point source, dB
D = Directivity factor, dB
A = Attenuation in octave bands that is produced during the propagation from the sound point source to the receptor, dB The specific attenuation terms considered in the algorithms from the standard ISO 9613 Part 2 are as follows [1]:
Geometric divergence
Atmospheric absorption
Ground effects
Reflection from surfaces
Screening by obstacles
Given the wide range of uses for the noise prediction model in addition to the great variety of factors which influence sound pressure levels in an open field, no procedure exists to define a detailed model that would be adequate to estimate the sound generated by wind turbines [5].
According to Wondollek, wind turbines are not omnidirectional point sources, as proposed by the model from ISO 9613 Part 2 [6]; i.e., the sound pressure level varies according to the position of the receptor because of the directionality of the sound. According to [7, 8], the directivity of the sound is a function not only of the position of the receptor but also of the wind speed.
Wondollek and Kalinski et al. indicate that a wind turbine is more than a simple point source and the assumption of spherical propagation is contradictory and results in an underestimation of sound pressure levels at the receptor, particularly at longer distances [6, 9].
A drawback of the model from ISO 9613 Part 2 is that it has only been validated for source and receptor heights of up to 30 m and distances of up to 1000 m with a precision of 3 dB [6, 9]. It does not consider source heights greater than 30 m and does not take into account atmospheric variations over significant distances [9].
As stated by Wondollek, according to the ground attenuation equations of the model from standard ISO 9613 Part 2, if the source is located at a height of 80 m (axis height) and the receptor is placed at a height of 1.6 m at a distance of 500 m from the source, the ground attenuation should be constant and equal to −3 dB (63-8000 Hz) for hard soil and 4.3 dB for porous soil (500 Hz). Above 125 Hz, soil attenuation should be approximately 0 dB for porous soil. Accordingly, porous soil would produce a ground attenuation equal to zero, whereas hard soil would result in reinforcement. Another fact that must be taken into account is that the source height has no influence on the ground effect when it is greater than 10 m, and the ground effect is independent of the average size of the area [6].
According to Wondollek, if the axis height is 80 m and the projected distance is less than 2,445 m, the ground attenuation would be zero for porous soil and 3 dB for hard soil. Therefore, it is implicit that the average size of the area plays no role in the ground attenuation in the model from standard ISO 9613 Part 2. In contrast, at heights in excess of 10 m, the height of the source has no influence on the ground attenuation, another result that sounds unrealistic. These are other examples of how the model from standard ISO 9613 Part 2 cannot be applied at considerable distances or when the source and the receptor are either very tall or placed at a considerable height [6].
3. Methodology
In this study, an experimental program is designed to test the accuracy of the prediction method proposed by standard ISO 9613. This includes measuring the sound pressure levels under given weather conditions inside a wind farm and comparing them with the levels that had been estimated using the prediction model proposed by standard ISO 9613 Part 2 with the most common geometric spreading laws (spherical propagation and cylindrical propagation).
The measurements were conducted in a wind farm belonging to the company Kentilux S.A., located in the department of San José (Uruguay), kilometer 41 national route number 1, near Paraje de Punta del Tigre. More precisely, it is located within a property belonging to La Magdalena farm.
Different measurement sites were selected, all of which were downwind from the wind turbines, in an effort to achieve the best alignment with the wind turbines. The noise originating from the wind turbines was recorded and measured (sound emission or sound pressure levels) using a microphone placed at a height of 1.2 m from the ground at various distances downwind from the wind turbine (from 100 m to 900 m). The sound was recorded continuously for at least 10 min.
4. Results
Figure 1 presents a general idea of the frequency distribution of the sound pressure levels produced by the wind turbines. The wind turbines have a noise spectrum characterized by low and medium frequency components that result in a large difference in the wide band sound pressure level as expressed in dBZ or in dBA.
Figure 2 represents various models and compares them to the measured wideband levels. The propagation models represented were spherical propagation and cylindrical propagation. As seen in the figure, the attenuation over distance of the wideband sound pressure levels from the turbines approximates the cylindrical propagation model. As the wind velocity increases, the data fits the model more closely. At a velocity of 2 m/s or 3 m/s, the propagation model coincides qualitatively but not quantitatively.

Figure 1 Equivalent continuous sound pressure level (L Zeq ) at different distances downwind from the wind turbine
The difference between the observed value Y i and the value estimated by a model is called the residual and is the same as the adjustment error in the model at the i-th datum [10]. Consistent with the above, this article will hereafter use the term residual sound pressure level to refer to the difference between the measured sound pressure level and the sound pressure level obtained by the noise prediction model. A negative value indicates an underestimation, whereas a positive value indicates an overestimation.
The residual sound pressure level varies between −8.6 dBZ and 72.6 dBZ, with a median of 25.7 dBZ for all frequencies and measurement points. The residual for the wideband equivalent continuous sound pressure level expressed in dBZ varies between 1.0 and 56.5 dBZ, with a median of 29.6 dBZ. When the wide band equivalent continuous sound pressure is expressed in dBA, the residual varies between −4.4 dBA and 37.7 dBA, with a median of 20.5 dBA.
Knowing the fact that the method prescribed in standard ISO 9613 Part 2 was developed to estimate the sound pressure level under meteorological conditions favorable for the propagation of sound emission, that is, in a well-developed system of moderate thermal inversion and wind velocity between 1 m/s and 5 m/s, recorded from a height of between 3 m and 11 m above ground level, it is observed that for these conditions of stability (class E stability) and wind velocity, the residual sound pressure level increases as wind velocity decreases.
For class E stability and wind velocities less than 5 m/s, the residual sound pressure level varies between 11.5 dBZ and 57.2 dBZ, with an average value of 27.0 dBZ for all frequencies and measurement points. The residual for the wide band continuous sound pressure level varies between 18.4 dBZ and 45.7 dBZ, with a median of 27.9 dBZ. When the wide band equivalent continuous sound pressure level is expressed in dBA, the residual varies between 15.9 dBA and 29.0 dBA, with a median of 20.9 dBA.
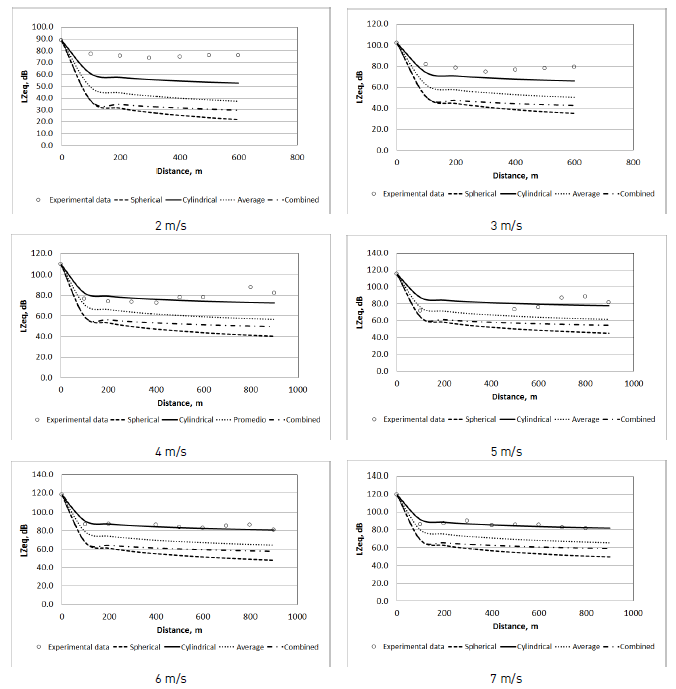
Figure 2 Behavior of the propagation of wide band noise emission from the wind turbines for several wind speeds without taking into account other attenuation factors
With the cylindrical propagation model, the residual for the wide band equivalent continuous sound pressure level varies between −22.0 dBZ and 25.7 dBZ, with a median of 1.1 dBZ. When the wide band equivalent continuous sound pressure level is expressed in dBA, the residual varies between −27.4 dBA and 13.6 dBA, with a median of −7.2 dBA.
Table 1 presents the difference between the measured sound pressure levels and those estimated, in wide band and with Z- and A-weighting filters, for the model from standard ISO 9613 in its original form and with some variations with regards to geometric spreading (cylindrical propagation). It may also be observed from the table that the method from standard ISO 9613 Part 2 is not particularly accurate, and it slightly improves when the geometric spreading is assumed cylindrical.
Table 1 Differences between estimated sound pressure levels and those measured, in wide band and with Z- and A-weighting filters

Table 2 presents the statistics for the difference between the measured sound pressure levels and those estimated, in wide band and with frequency Z- and A-weighting filters, for the model from standard ISO 9613 in its original form and with some variations regarding geometric spreading (cylindrical propagation).

Table 2 shows that the median and standard deviation in the residual sound pressure level of the standard ISO 9613 Part 2 method improves when geometric divergence is assumed cylindrical.
5. Discussion
The method established in standard ISO 9613 Part 2 is not adequate to estimate emission levels from wind turbines or wind farms since the estimated sound pressure levels are generally conservative and tend to underestimate wideband sound pressure levels associated with wind farms. Therefore, differences of up to 56.5 dBZ, with a median of 29.6 dBZ, were found between the estimated sound pressure levels and measured levels. The residual sound pressure levels given by standard ISO 9613 Part 2 for the wind turbines is larger for high frequencies than that for low frequencies. When the wide band equivalent continuous sound pressure level is expressed in dBA, the residual varies between −4.4 dBA and 37.7 dBA, with a median of 20.5 dBA.
It must be noted that the wind turbines represent a sui generis situation since the noise source is found at an altitude higher than 80 m above the ground level. The method from standard ISO 9613 Part 2 has not been developed or tested with noise sources located at this altitude. In addition, wind turbines are noise sources that operate at wind speeds greater than those foreseen by standard ISO 9613 Part 2. In general, the characteristics of the wind turbines and the conditions in which they function are very different from those detailed in standard ISO 9613 Part 2.
However, as the distance between the source and the receptor increases, so does the residual sound pressure level, agreeing with the data reported by Thorne. He suggests that the normal intervals of prediction error increase with distance and adverse climate effects. This difference is in a large part due to the noise prediction model assumes a spherical propagation. In addition, as the wind velocity increases, the residual sound pressure decreases [11].
Dickinson indicates that this method was not developed with wind farms in mind and that wind turbines do not comply with the limitations cited for this method. He proposes that wind farms should be modeled as linear sources (cylindrical propagation), which would result in an attenuation of 3 dB as the distance is doubled [2].
The propagation model that best fits the attenuation of noise from wind turbines over distance is cylindrical propagation, in accordance with what was reported by Martín et al. [12]. It is precisely this model that presents the lowest residual sound pressure.
According to Møller and Pedersen, the lower frequencies appear to decay by 3 dB when the distance is doubled (cylindrical propagation) instead of 6 dB (spherical propagation), as supposed by the majority of sound propagation models. This may generate sound pressure levels that are higher than expected at distances greater than a few hundred meters. At greater distances, the sound, majority of which is low-frequency sound, may be one of the main problems for those who live near wind farms [13].
6. Conclusion
Wind turbines create a noise spectrum characterized by low and medium frequency components. It is also observed that they lack impulsive components and pure tones since no band stands out against the adjacent bands.
The methodology of standard ISO 9613 Part 2 is not appropriate to model the propagation of noise originating from wind turbines since the modelling parameters must be adjusted adequately in order to take into account the unique characteristics of this noise source.
Regarding geometric spreading, the propagation model exhibiting the closest fit to the attenuation of noise from wind turbines over distance is that of cylindrical propagation.

