


 English (pdf)
 Article in xml format
 Article references
 Send this article by e-mail
 Cited by SciELO
  Cited by Google
  Similars in
SciELO
Similars in
SciELO  Similars in Google
 Permalink
1. Introduction
Designing an algorithm for detecting systolic peaks in photopletysmographic (PPG) signals can be as challenging as climbing a mountain. From that point of view, the top of the mountain is reached when the algorithm performance is good enough for medical applications. This latter implies that the devised algorithm must be able not only to ignore fake or error peaks that may result from motion artifacts, respiration and electrical noise, but also to adapt to the physiological variability of the PPG wave.
Several authors have aimed efforts at the development of adaptive algorithms for accurate peak detection in PPG signals. In [1], an adaptive threshold (ADT) algorithm which uses two variable thresholds to detect the peaks and the valleys of PPG signals was developed. Once a peak is detected, the peak detection threshold is decreased with time until it reaches the upslope of the next systolic wave; similarly, once a valley is detected, the valley detection threshold is increased with time until it reaches the downslope of the next diastolic wave. In another study [2], the inverted triangular area contained by two consecutive PPG peaks and the valley between them was used to overcome the effects of the baseline drift and wandering. More recently, a robust peak detection (RPD) algorithm [3] was devised by comparing a percentage of the PPG amplitude, which is constantly updated and which they called adaptive distance, with the difference between the amplitudes of the last peak or valley detected and the current point. The RPD algorithm is also able to eliminate fake or error peaks by calculating the standard error value over N peak-to-peak intervals, whose difference was assumed to be not greater than 100 ms. On the other hand, these algorithms, as well as those developed for heart rate (HR) monitoring through mobile devices like a Smartphone [2, 4-6], might not perform well when the amplitude of the PPG signal is reduced. Several authors [1, 7] argue that decreases in the amplitude of the PPG wave should be addressed from signal acquisition and conditioning stages. However, decreases in the amplitude of the PPG wave can be observed after injury (e.g., when a patient experiences the first surgical incision of an operative procedure) or during apnoeic episodes, as a consequence of peripheral vasoconstriction caused by an increase in the sympathetic tone [8]. Under such circumstances, it is important to guarantee continuous and reliable peak detection, so a novel, simple and real-time peak detection algorithm for PPG signals is proposed in this study.
2. Materials and methods
2.1 The mountaineer’s method for peak detection (MMPD)
The proposed peak detection method is based on the similarities between the PPG waveform and a mountain range. If every PPG pulse is considered as a single mountain, then the systolic peak can be thought as the top of the mountain. Likewise, if one begins to climb the rising edge that precedes the systolic peak, it can be assumed that the latter will be reached when the slope changes from positive to negative. This equals to assume that the rising edge preceding the systolic peak is a strictly increasing function, which can be denoted as f. Thus, every point composing the systolic rising edge satisfies the condition (1):

But if this is so, how the algorithm will be able to distinguish between the true peak and one caused by a sudden change in the sign (from positive to negative) of the slope? One could count the number of times the condition (1) is met and if this number reaches or exceeds a certain threshold, then the current change of slope is a systolic peak. This threshold is proportional to the total number of samples composing the systolic rising edge, which in turn depends on the sampling rate, but not on the amplitude of the PPG signal, as shown in Figure 1.
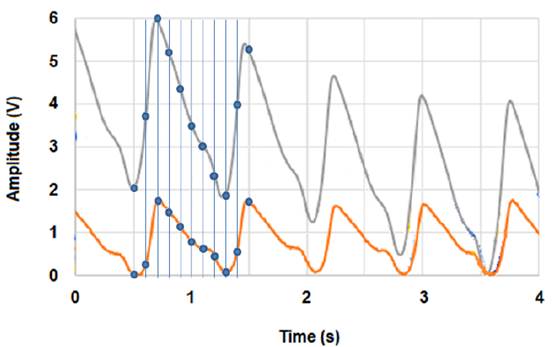
Figure 1 PPG signal at two different amplitudes. Regardless of the signal’s amplitude, the number of samples composing the PPG signal, as well as its different segments (e.g., the systolic rising edge), is always the same
The crest time (i.e., the time interval measured from the onset of the systolic rising edge to the systolic peak) was found to be around 0.1 s for healthy subjects [9], depending on the heart rate (HR). Hence, for a sampling rate of 100 Hz, the systolic rising edge will be composed of ten samples and the condition (1) will be satisfied nine times before the systolic peak is reached. A pseudo code for the proposed method (MMPD) is shown in Algorithm 1.
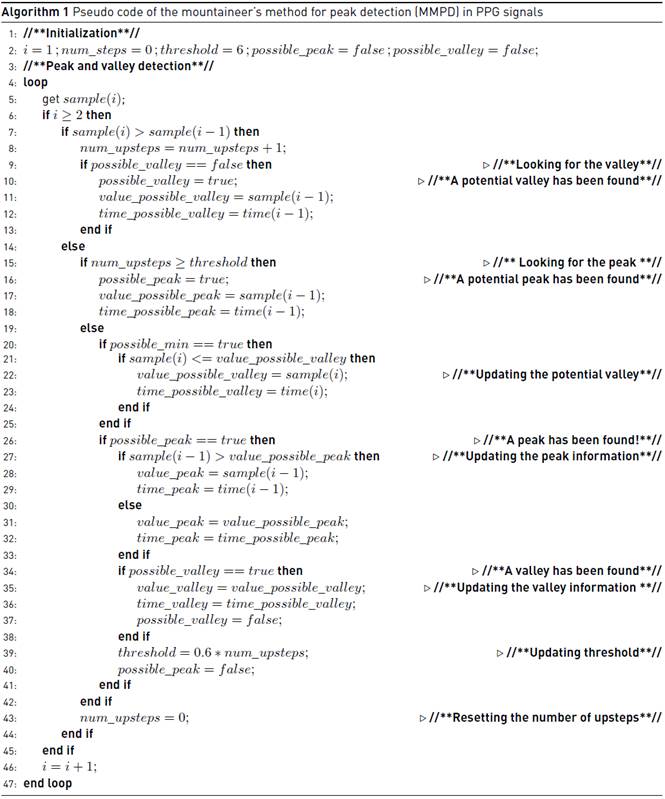
It is worth noting that the variable num_steps increases as long as the slope of the PPG wave is positive. If the slope changes from positive to negative, num_steps is reset to zero, whether or not its value has reached or exceeded the threshold. Once the peak is detected, the onset of the systolic rising edge is marked as the valley that precedes the systolic peak. The variables possible_peak and possible_valley are flags by which it is possible to ignore ripples and even the diastolic peak, which could be erroneously labeled as a systolic peak. The threshold empirically initializes at 6 and it updates its value with every heartbeat as expressed by Equation (2):

The higher the subject’s HR, the lesser the number of samples composing the systolic rising edge and, therefore, the lesser the number of times that condition (1) is met. By setting the detection threshold at 60% of the total number of times condition (1) was satisfied before reaching the last systolic peak, the algorithm will be able to detect new peaks even when the HR increases.
2.2 PPG acquisition system
A modified version of the circuit built in [10] was used for conditioning PPG signals, which were collected through a NellcorTM adult finger clip (model DS-100A). The resistance R1 was replaced by a potentiometer by which it was possible to control the current through the infrared light-emitting diode (IR-LED). The signal from the phototransistor is filtered and amplified with a single pole, band-pass filter with a lower cut-off frequency of 0.7 Hz, an upper cut-off frequency of 2.34 Hz, and a gain of 100. The output of the first stage is regulated by the potentiometer R7 and additionally amplified with a gain of 10. Digitalization of the signal is performed by the 8-channel analog-to-digital converter of an Arduino Nano board with 10-bit resolution. The board was programmed to collect a PPG sample every 10 ms (sampling rate = 100 Hz). The whole circuit was powered with a rechargeable Ni-MH battery (3.6 V/1000 mAh, Huawei) and integrated into a single printed circuit board (PCB) using high-quality components, in order to reduce the signal contamination as much as possible. Once digitalized, the PPG signal is transmitted from the Arduino board to a portable PC (Acer TravelMate B113) via serial port.
2.3 Subjects and data sets
Eight young and healthy subjects (five male and three female, ages ranging from 18 to 30 years) participated in the study. As done in [1], drinking and smoking were prohibited during 24 h before the experiment. Each participant was asked to sit as comfortable as possible while the PPG finger clip was placed around the tip of the middle finger of the writing hand. Three 5-min data sets were recorded from each subject, with a 2-min resting period between data sets. The first data set was obtained while the participants remained seated as still as possible and the PPG circuit operated with an IR-LED driving current of 2.54 mA in order to obtain a PPG amplitude around 2 V. The second data set was obtained while the participants draw a house, a tree and a clock on three different sheets of paper with the IR-LED driving current fixed at 2.54 mA. The third data set was obtained while the participants remained seated, again, as still as possible, and the PPG circuit operated with an IR-LED driving current of 0.96 mA in order to reduce the PPG amplitude to ~0.2 V. Data were stored for analysis and two emergency physicians annotated the systolic peaks of each PPG recording as controls for evaluation.
2.4 Performance evaluation
The effectiveness of the MMPD was benchmarked against two other adaptive peak detection methods: the ADT algorithm [1] and the RPD algorithm [3]. The first one was chosen since it has been widely used as a gold standard to evaluate the performance of novel peak detection algorithms [2, 3]. The second one was chosen because it has been postulated [3, 6] as one of the more robust algorithms for detecting systolic peaks in PPG signals. The three algorithms were implemented in Matlab R2013a (The Mathworks Inc., Natick, USA). A beat-to-beat comparison was performed between the output of the three algorithms and the annotated systolic peaks. The first ten seconds of each data set were considered as a training period and they were not included in the comparison. Time deviations within 0.05 s between beats were accepted.
As developed in previous studies [1, 3, 4], the performance of each algorithm was evaluated by calculating its sensitivity (SE) and its positive predicted value (+P), each of which is given by Equations (3) and (4):
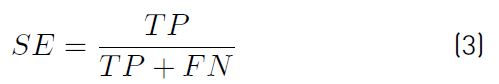
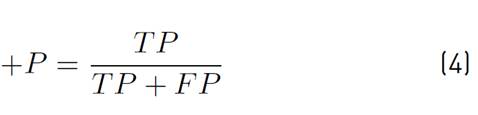
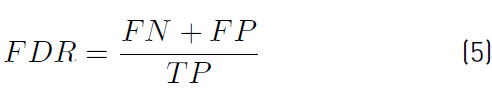
where TP, FN and FP denote, respectively, the number true positives (systolic peaks labeled as systolic peaks), the number of false negatives (un-detected systolic peaks) and the number of false positives (false or error peaks labeled as systolic peaks). Both a FN and a FP counted as a detection error, so for this study the failed detection rate (FDR) was defined by Equation (5):
As done in previous studies [1, 3], the denominator of equation above is the amount of true positives (TP) rather than the total peaks labeled by eye.
3. Results
Tables 1 and 2 summarize how accurate the three algorithms (ADT, RPD and MMPD) were in detecting, respectively, peaks and valleys from authentic PPG signals.
Table 1 Results of peak detection (ADT: adaptive detection threshold; RPD: robust peak detection algorithm; MMPD: mountaineer’s method for peak detection)
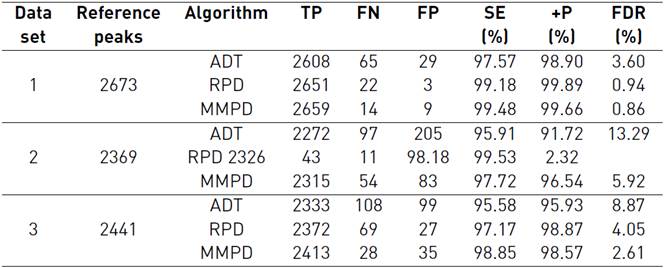
Table 2 Results of valley detection (ADT: adaptive detection threshold; RPD: robust peak detection algorithm; MMPD: mountaineer’s method for peak detection)
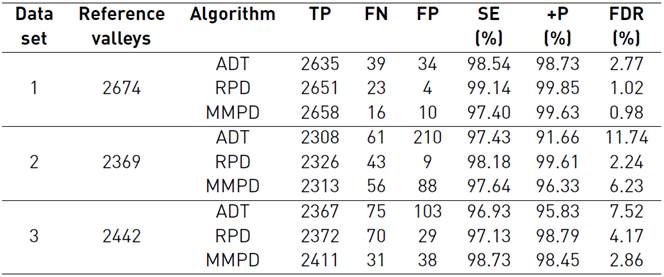
For both peak and valley detection, the MMPD showed the highest SE, as well as the lowest FDR, when subjects remained seated as still as possible (1st and 3rd data sets). On the other hand, the RPD algorithm achieved the highest value of SE, as well as the lowest value of FDR, under moderate motion artifacts conditions (2nd data set). For every data set, the RPD algorithm also achieved the highest value of +P, whereas the ADT algorithm showed the lowest values of SE and +P, as well as the highest values of FDR.
The difference between the number of peaks and the number of valleys detected by the MMPD and the RPD algorithm, under the same conditions, was one or two, whereas for the ADT algorithm the difference between detected peaks and valleys was 27, 36 and 34 for the 1st, 2nd and 3rd data set, respectively.
4. Discussion
Numerous efforts have been made to develop algorithms for accurate peak detection in PPG signals [2,4-6], most of which have been specifically conceived to perform under high motion artifact and baseline drift conditions. However, little has been done regarding peak detection in low-amplitude PPG signals. Low-amplitude PPG signals are more vulnerable to noise contamination and other undesirable effects because the signal strength is comparable to noise power. Such recordings may exhibit several ripples which could be erroneously labeled as peaks if the detection algorithm is not robust enough. Several authors [1, 7] argue that decreases in the amplitude of the PPG signal should be addressed from signal acquisition and conditioning stages. On the other hand, such decreases can be observed after injury or during apnoeic episodes, as a consequence of peripheral vasoconstriction caused by an increase in the sympathetic tone [8]. In this instance, it is important to ensure continuous and reliable peak detection, which is why a novel peak detection algorithm for PPG signals is presented in this study.
Results reveal that the RPD algorithm performs well under both low and high motion artifact conditions, as demonstrated in previous studies [3, 6], and since it is able to eliminate error and fake peaks, it emerges as the algorithm with the highest +P for every data set recorded in this study. But when the amplitude of the PPG signal was reduced drastically, its SE dropped to ~97% for both peak and valley detection. As mentioned above, noise and baseline drift have a stronger effect on low amplitude PPG signals, so such recordings may exhibit several ripples and sudden amplitude changes. In that case, the difference between the last local maximum or minimum detected and an adjacent lower or higher point could be less than the adaptive distance computed by the RPD algorithm, thereby resulting in an undetected peak (or valley), as shown in Figure 2.b. In turn, the ADT algorithm showed the lowest values of SE and +P, as well as the highest values of FDR, among the three algorithms tested. Previous work [3] demonstrated that the performance of the ADT algorithm deteriorates under moderate/high motion artifact conditions. Furthermore, and as confirmed by the present study, the ADT algorithm cannot perform well when the amplitude of the PPG signal is considerably low, a limitation which was previously outlined by its authors [1]. Contrarily, and as shown in Tables 1 and 2, the MMPD was able to achieve over than 98% SE and less than 3% FDR despite a significant reduction in the amplitude of the PPG signal. Both RPD and ADT methods, as well as several other peak detection algorithms [2, 4, 6], use the amplitude of the PPG wave to set their detection threshold. In other words, most of the systolic peak detection algorithms have a strong dependence on the signal’s amplitude. Unlike all those methods, the MMPD depends on the steepness of the systolic rising edge rather than on the amplitude of the PPG signal, and results suggest that, by eliminating such dependence, the peak detection process may be less likely to be hindered by ripples and sudden amplitude changes (see Figure 2.c), which tend to be more frequent when signal strength is comparable to noise power.
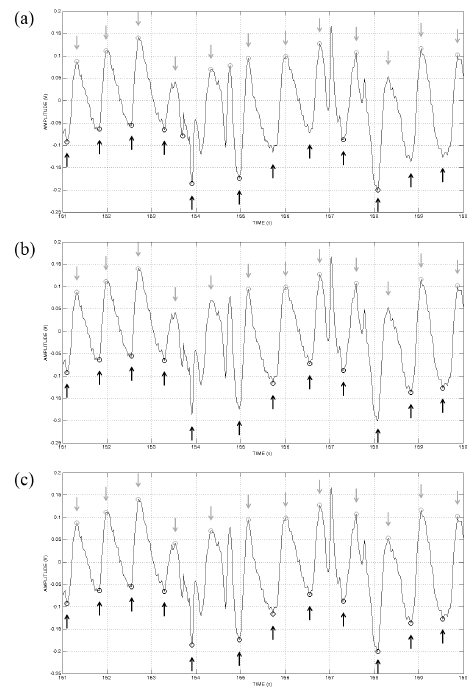
Figure 2 Peaks and valleys detected by: a) the adaptive threshold algorithm (ADT), b) the robust peak detection algorithm (RPD), and c) the mountaineer’s method for peak detection (MMPD) when the amplitude of the PPG signal was decreased to ~0.2 V (data set #3). Light and dark gray circles represent, respectively, the peaks and valleys detected by the algorithm, whereas light and dark gray arrows represent the annotations of the experts
Though the MMPD achieved the highest SE and the lowest FDR under both normal (~2 V) and low (~0.2 V) amplitude conditions, its SE dropped to 97% and its FDR increased under moderate motion artifact conditions. On the contrary, the RPD algorithm provided better detection performance than that showed by the MMPD when motion artifact effects were significant (see Figure 3b). In fact, the RPD algorithm achieved the lowest value of FP and, therefore, the highest value of +P for every data set. This can be attributable to its post-processing stage, which is based on the assumption that the difference between two consecutive peak-to-peak intervals does not exceed 100 ms [3]. Such method allows the algorithm to eliminate premature or late peaks possibly originated by motion artifact effects. However, this post-processing could produce a delay when the number of intervals considered in the calculation of the standard error value is increased, which in turn may hinder real-time processing when computational power is reduced. The MMPD, on the other hand, avoids excessive calculations and can be easily implemented for real-time applications. Its detection threshold changes with every heartbeat, which allows the algorithm to actually adapt to the variability of the HR. Nevertheless, future work should aim to include a low computational cost method for artifact detection in order to further reduce the number of FP reported by the algorithm and, therefore, improve its +P and FDR.
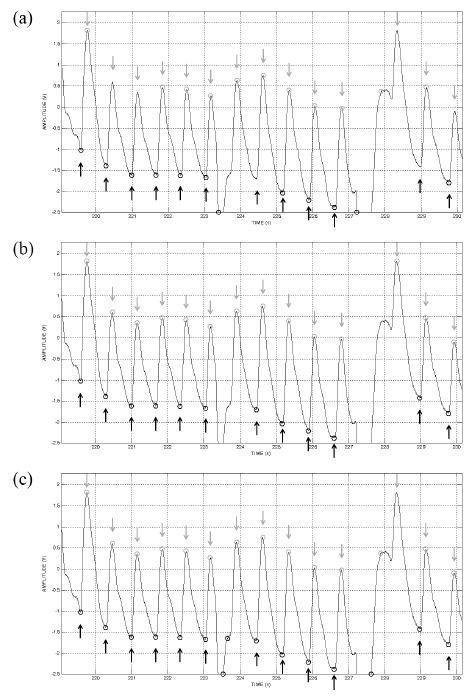
Figure 3 Peaks and valleys detected by: a) the adaptive threshold algorithm (ADT), b) the robust peak detection algorithm (RPD), and c) the mountaineer’s method for peak detection (MMPD) under moderate motion artifact conditions (data set #2). Light and dark gray circles represent, respectively, the peaks and valleys detected by the algorithm, whereas light and dark gray arrows represent the annotations of the experts
The ADT algorithm was designed for PPG signals without baseline drift and its detection thresholds depend exclusively on the signal amplitude, which may change drastically due to physiologic and motion artifact effects. In the present study, this method reached a higher SE when it was used to detect valleys, whereas its +P was slightly greater when it was used to detect peaks, as reported by its authors [1]. Moreover, the difference between the number of peaks and the number of valleys detected by the ADT algorithm was 27, 36 and 34 for the 1st, 2nd and 3rd data set, respectively. A possible explanation lies on the fact that this algorithm uses two different thresholds: one for peak detection and one for valley detection. On the other hand, the MMPD and the RPD algorithm were developed to detect the peak-valley couple, which may explain the small difference between the number of peaks and valleys detected by these algorithms. If an algorithm is able to detect the peak-valley couple with high accuracy, then that algorithm could be used not only for HR estimation, but also to obtain additional information about the subject condition. For instance, the amplitude of the PPG signal (also known as the pulse plethysmographic amplitude - PPGA) has been used for years to assess autonomic nervous system activity [11,12], and it is given by the amplitude difference between a peak and the consecutive valley. Thus, if there is no agreement between the number of peaks and valleys detected, the PPGA may be miscalculated and physiological states could not be analyzed correctly [13]. Accurate peak-couple detection is, therefore, a very desirable feature, and since the number of peaks detected by the MMPD was almost equal to the number of detected valleys, the proposed method could find its use in estimating not only HR, but also several cardiovascular responses like vasoconstriction or vasodilatation.
5. Conclusion
A novel and low-complexity algorithm for detecting PPG peaks in real time was proposed. Results show not only that the proposed method is able to detect systolic peaks with high accuracy, even if the amplitude of the PPG signal is too low, but also that it is feasible to develop an accurate peak detection algorithm which, unlike other methods, does not depend on the PPG signal’s amplitude. Still, further work is needed to improve its robustness to motion artifacts and, therefore, to reduce the number of FP reported by the algorithm.
To conclude, it is worth mentioning that automated peak detection in PPG signal is a mountain which remains unconquered. Although most of the peak detection algorithms that have examined in this study have the potential to compete with those developed by medical device companies, they have not been rigorously validated. Therefore, it is necessary to provide researchers with a standardized set of tests to objectively compare the performance of different peak detection algorithms.

