


 English (pdf)
 Article in xml format
 Article references
 Send this article by e-mail
 Cited by SciELO
  Cited by Google
  Similars in
SciELO
Similars in
SciELO  Similars in Google
 Permalink
1. Introduction
Colombia is a developing country in which the demand for electricity has increased 31% from 50,429.71 GWh to 65,940 GWh from 2005 to2016. In this year, most of the electricity was consumed by the regulated market (residential sector) 45,082 GWh, (68% of the national electricity consumption), whereas the non-regulated market (industrial sector) accounted for 20,850 GWh, (32% of the national consumption) 1. This amount of energy comes mainly from renewable resources (67.1% large Hydropower plants) and fossil fuels (27% mainly Gas thermal plants), while a small amount of 5.9% comes from smaller (less than 20 MW of installed capacity) Hydro, Thermal, Wind, and co/self-generators power plants, of which only 0.91% comes from Wind power plants. In response to the effects of “El Niño” and the high price of the liquid fuels in 2015, the government was forced to implement an energy saving strategy for the residential sector 1; as a result, the electricity demand dropped 0.2%. In this period, electricity was provided by a share of 63.8% of Hydropower, 31% of Thermal power and, 5.2% of small, and co/self-generators; this production configuration has been constant over the last several decades 1.
The historical dependence on Hydropower resources have become in a double-edged sword for Colombia. The national grid is one of the cleanest in the Americas and only exceeded by countries such as Costa Rica, Paraguay, Brazil, and Panama 2. This dependence has, however, turned Colombia into a country highly vulnerable to climatic variations such as the “El Niño y La Niña”. “El Niño” (south oscillation ENSO) is a climatic phenomenon that involves changes in temperature of waters in the central and eastern tropical Pacific with cycles between 3 and 7 years. This phenomenon alters air currents and affects both rainy and dry seasons during the course of a year. Some consequences of this phenomenon are reduction of rainfall leading to a decrease in flow of rivers, increase in fire frequency in vegetation cover, water deficit problems affecting municipal and rural aqueducts, rationing in the power sector, and adverse effects on agriculture, health, and environment 3. To addresses these problems, the Colombian government recently introduced Law 1715 in 2014 to integrate non-conventional renewable energy sources into the power system 4. With this law, the Colombian government seeks, first, to promote Wind and Solar power to protect the power grid against such climatic variations. Second, it aims to achieve the commitments made in Cop 21 to reduce carbon emissions by 2030 5. Three, the government hopes to contribute to achieving national and international sustainable development goals, especially the Goal Seven, which stipulates that the entire population of a given country has access to electricity 6. To achieve these goals, the government aims to invest in renewable resources, which are expected to be part of the power grid by 2030 7.
One of the unresolved questions regarding with the non-conventional renewable resources is whether they can be labeled as clean energy. Since although CO2 emissions are much lower than those of fossil fuels, other kinds of environmental effects such as acidification, eutrophication, and land use can be higher than those of fossil fuels 8. To answer the question posed above, Life Cycle Assessment (LCA) has become in a suitable tool because it can be used to assess the environmental impact on a system in a holistic manner (from the extraction of raw materials and the manufacturing to the operation, maintenance, and final disposal). In this case in particular, LCA allows for a nuanced examination of different environmental issues rather than just CO2 emissions.
In LCAs, the role of the electricity is crucial since most products or services require electricity. Electricity commonly comes from different sources, e.g. wind, fossil fuels, or water, rather than only one. This particularity makes the modeling of the electricity systems a complex task 9. One of the challenges is the use of average or marginal data since the use of such approaches attempt to answer different questions and scopes, and has different implications.
This paper contributes to the LCA literature in two ways. First, this study shows that the methodology proposed by 10,11 is suitable and manageable to identify the long-term marginal technology in the case of Colombia. Second, this paper is the first study to assess the long-term marginal technology for a national power grid in a country in South America. The results show that the actual and future marginal technology is Hydropower rather than, as in countries such as Denmark, Sweden, and China. 10-12, fossil fuels. The long-term marginal technology is calculated for Colombia over the period of 2000- 2016 and 2016-2030 applying the consequential life cycle approach and considering the national power strategy, the electricity demand, and the energy resource availability provided by the national authority of Energy Mining Planning Unit (UPME), the Colombian authority responsible for this matter. Furthermore, the study identifies the marginal technology under different climate change scenarios.
The results show that Hydropower has historically dominated the electricity generation in Colombia despite challenges resulting from climatic variations and hydraulic conditions. Efforts to diversify the energy grid have been unsuccessful, and fossil fuels have been the only technology installed to overcome this issue. Thus, despite the effort made by the government to introduce non-conventional renewable resources into the power grid with the Law 1715 in 2015, it is very unlikely that these resources will be a relevant part of the power by 2030.
The findings are expected to help practitioners conducting LCAs in Colombia and countries with similar conditions and also by government and non-government agencies tasked with understanding and evaluating the consequences of an increase in electricity demand. This paper is structured as follows. Section 2 briefly describes the influence of “El Niño” on the power grid and the concepts of a circular economy, it also addresses the Consequential Life Cycle Assessment approach (CLCA) and the research method applied to identify the long-term marginal technology in the case of Colombia. Section 3 presents the results. Section 4 discuss these results, and Section 6 presents the main conclusions.
2. Materials and methods
To identify the marginal technology during the period between 2000 and 2016, the CLCA has been carried on taking data of the: demand of electricity, installed capacity, and the amount of power plants. The data was provided by the statistic yearbooks published by the UPME. The functional unit is 1 KWh electricity produced; this study does not consider the transmission and distribution phase.
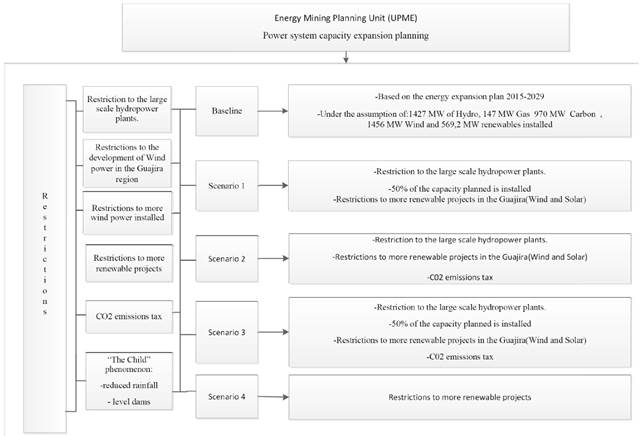
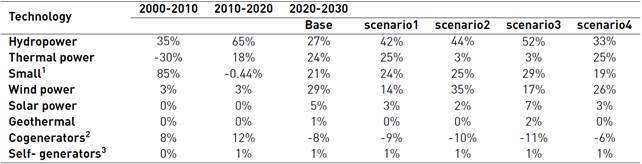
For the long-term marginal technology during the period 2016-2030, four scenarios developed by the UPME were considered. These scenarios take into account different issues: First, Restriction to the large scale hydropower plants (reservoir) given by difficulties related to the environmental and the social conditions of the projects. Second, restrictions to the development of Wind power in the Guajira region in north of the country. Only 1450 MW of the potential 3131 MW will be installed as baseline scenario and two additional criteria in which only the 50% or 25% of this capacity will be installed. This responds to the social conditions of the Guajira region that is mainly populated by indigenous settlements. Third, restrictions to install more Wind power plants. In the case that the first 1450 MW of Wind power be installed, the chances to install the missing 1681 MW would be narrow. Fourth, there are limits to installing more renewable projects. In the case that all or part of the Wind power capacity being installed, limitations of space and indigenous decisions would restrict the installation of Solar power. Fifth, CO2 emissions tax, which implies that all of the liquid fuels will be taxed by each Ton of CO2 emissions emitted 13. Figure 1 summarized the main criteria for each scenario.
Finally, to identify the marginal technology, the step wise procedure proposed by Weidema et al., (10 and Ekvall and Weidema 11 is adopted as follows:
Defining the time horizon of the study.
Identifying whether the changes in production volume affect specific process or if it is a market effect.
Identifying the trend volume of the affected market. Whether is affected, the identification of the relevant market segment must be carried on.
Identifying whether the technology has a potential to provide the desired capacity adjustment.
Identifying whether the technology is the preferred object of the desired capacity adjustment
a. “El niño” phenomen
“El Niño” (south oscillation ENSO) is a climatic phenomenon that involves changes in waters temperature in the central and eastern tropical Pacific, with cycles between 3 and 7 years. This phenomenon alters air currents and affects both rainy and dry seasons during the course of a year. Some consequences of this phenomenon are reductions of rainfalls leading to a decrease in flow of rivers, an increase in fire frequency in vegetation cover, water deficit problems affecting municipal and rural aqueducts, rationing in the power sector, and adverse effects on agriculture, health, and environment 3.
In Colombia since 1950 and up to now, “El Niño” phenomena have been presented twenty-two times: eight of weak intensity; eight of moderate intensity and six of strong intensity 14. The period 1991-1992 caused a reduction in level of reservoirs, during this period the small thermal power capacity caused a "power outage" with a whole series of impacts in different productive sectors calculated in 563 million dollars 3,15. The period 1997-998 has been considered as one of the strongest that Colombia has witnessed and the reduction of the rains was more noticeable. However, in this period there was not rationing of energy, yet a large increase in spot prices 15. During 2009-2010, low hydrology occurred, resulting in an increase in energy exchange prices. In this period, there was no rationing for the efficient use of generation resources and coordinated work of electricity and fuel sectors, in addition to implementation by energy sector of different measures, such as: maximizing availability thermal, assurance of fuel supply, rationalization of energy exports, among others 16. Finally, during 2014-2016, Colombia experienced a greater reduction in rainfall, affecting reservoir levels, as in previous events, which resulted in an increase in stock prices, but did not reach rationing due to the importation of energy, the plans for saving energy and water, proposed by the current government 1.
These climatic variations put in continuous stress the power grid due to high water dependency. Although thermal power plants serve as a backup for the system, it has been shown that some of them are not financially viable due to prices that are paid for current regulatory framework, therefore, it is necessary that the energy grid be diversified with no conventional renewable generation technologies such as: solar, wind, biomass, among others.
b. Circular economy general concepts
Although Colombia is a rich country in terms of natural and energy resources, the current global trends such as, the volatility in prices for different commodities, e.g. oil, copper, and agricultural products, water scarcity and depletion of groundwater reserves, loss of biodiversity, the high levels of pollutants released into the atmosphere with increasing humans illness and climate changes have put in discussions whether the current economic model (lineal economy) has been successful in guaranteeing wealth and an environmental healthy for the populations and the future generations. Such trends have provoked a deceleration in the national economy due the falling of prices in commodities such oil, coal and coffee that represent around 70% of the total exports, causing an increasing in the current account deficit from $ 6 billion (2.9% of GDP) in 2007 to $ 18,8 billion (6.4% of GDP) in 2015 and, the loss of around 40.000 jobs 17, Furthermore, related with environmental matters, the biocapacity of the country has decreased being the extractive sector (mining and energy) the main contributor to this issue; moreover, the population and urbanization growing has been increasing the amount of pollutants released to the air, water and soil, threatening the aquatic and terrestrial ecosystems. World population is expected to growth 20% by 2025 and the living in urban areas will reach the 80%, which means an increase in the generation of wastes (1.5 Kg waste/person/day). This last issue is quite alarming since Colombia does not have proper infrastructure for waste treatment, in which the 92% of the wastes end in the landfills, 7% is dumped in uncontrolled sites and only 1% is recovered 18. In consequence, the human health and the biodiversity have been losing quality. 19
Therefore, it is evident that Colombia needs strategies to overcome the current environmental impact while powering the sustainability and the national economy. One strategy that has been gaining importance over the time to overcome such problems is the so called “circular economy”. The circular economy has its roots in the ecology back in the 19th century and has been powered by different fields such as: industrial ecology Cradle to Cradle® design, the blue economy, among others. The concept of the circular economy can be summarized by three principles: First, to preserve and enhance natural capital by controlling finite stocks and balancing renewable resource flows; Second, to optimize resource yields by circulating products, components, and materials at the highest utility at all times in both technical and biological cycles; Third, to foster system effectiveness by revealing and designing out negative externalities 18. In simple words, the circular economy seeks to close the economy and ecologic loops reducing the production of waste and reintegrating the wastes into the loops imitating the ecologic systems in which the waste produced in the ecosystem is reused as raw materials to produce goods and ecological services. This new economic paradigm can only be a reality if materials, products, services, processes, and business models are completely redesigned to the extent that the materials used in new products can be recovered or sustainably disposed. For detailed information on the circular economy see 20,21.
General speaking, the circular economy is a suitable model to reduce the dependence on the extractive sector, by empowering a diversified economy that add value in their goods and services. This model creates new economic opportunities through innovation to develop bioproducts and circular business models. In this sense, one the most affordable tools to achieve a succeed transition to lineal economy through circular economy is the Life Cycle Assessment LCA. The Life Cycle assessment is an approach that has been gaining importance amount the environmental impacts assessment field since it appears for first time in 1965. The LCA is a quantitative environmental assessment tool to quantify the environmental impact the extraction, production, and disposal of products or services during their entire life cycle, this means from the extraction of raw materials, the production, manufacturing, use and disposal or recycling or in other words to (cradle to grave) 22.
c. Consequential Life Cycle Assessment
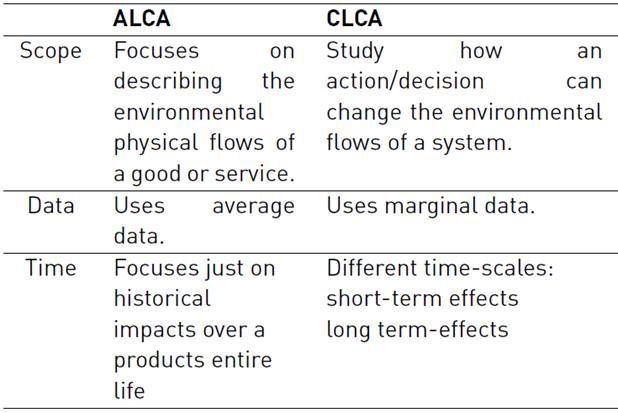
Life Cycle Analysis (LCA) is a holistic approach developed to assess the environmental impacts caused by a product or service during the entire life of cycle, from the extraction of raw materials until the disposal or recycling (cradle to gate). The LCA is ruled by the ISO 14040 22 and has two different approaches: (1) Attributional Life Cycle Assessment (ALCA) and, (2) Consequential Life Cycle Assessment - CLCA. See Table 1. While the ALCA attempts to describe the physical flows through the entire cycle of the product, the CLCA aims to describe how theses physical flows will change as result of an action/ decision (e.g., energy or environmental policy implementations). This distinction was formally adopted since 2001 9.
The CLCA emerged in the 90´s as an answer to the claim of different authors to include economic information into the LCA studies, to get a more accurate measure of the impacts caused in the systems under study, 10,11,23. Since then, the CLCA approach has gained importance and different methodologies and tools such as: The Partial Equilibrium model (PE), the sophisticated Computable General Equilibrium (CGE), and the input-output analysis (IOA) have been combined with the LCA approach to describe the environmental consequences caused by technological, environmental or economic decisions 24,25. This aggregation makes the CLCA methodologically more complex than the ALCA 26.
In LCA studies, electricity consumption plays an important role since every product or service demands certain quantity of electricity to be made it. According with 26, the use of marginal data can be relevant for the modeling of electricity production. In this sense, the data applies into the LCA studies has a key factor when the practitioners are modeling or comparing the studies 12. This issue has become complex since usually the electricity can be produced by different sources e.g. (coal, gas, hydropower, solar, wind) and in different combinations e.g (80% hydro and 20% coal) which makes the results vary considerably among studies 11. Depending on the type, goal, and scope of the study either an ALCA or a CLCA would be used.
d. Marginal technology
According with Weidema et al., 10 the marginal technology is one capable of responding to small changes in demand on the market. This marginal technology data is more suitable than data on average technology for modeling energy systems, however, the use of marginal technology is often avoided because identifying properly the marginal production has been seems as a difficult task, thus the use of average data has prevailed. To overcome this issue Weidema et al.,10 proposed a procedure to identify the marginal technology into power systems, this methodology is argued to be less intensive in time consumption. Besides average data reduce the risk to misleading conclusions, while the average technology may be used only as approximations of the results.
Two different times horizons are commonly identified. The short- term with a temporal scope usually of 5 years and the long- term that support much longer periods, often 10-15 years 27. The long- term marginal technology according to 12 is commonly identified by three different sources: First, the current and future power generation. Second, the energy regulation and Three, the energy system development. In this study, the long- term was modeled based on the data available in the UPME until 2030 7. According with 12, this methodology is also suitable to identify the actual marginal technology using statistics of the historical electricity capacity and the sources consumed data since 2000. The system boundary determined what technology and markers can be affected. According with 28 the electricity market has four segments: electricity mix, high, medium and low voltage. For this study, the national market is analyzed.
The trends identified over the period 2000-2016 show a predominance of the Hydropower resources while the trends for the period 2016-2030 will face an increase in the Thermal installed capacity, Wind and Solar power depending of the scenario studied. The next step is to identify whether the Hydropower, Thermal, Wind or Solar power are constrained by one or more of the following causes: Natural capacity constraints, Quality constraints, Political constraints or, Missing markets for co-products. Finally, since the demand for electricity has been increasing over the periods of time chosen, the preferred technology must be the most likely to be installed between the not constrained technologies identified. The next section provides detailed information.
3. Results
The following section presents the results of the actual long-term marginal technology and the expected long-term marginal technology in Colombia. Sections 3.1 and 3.2 present detailed analyses of the trends in the market over the years and provide information on the constrained technologies.
3.1 Marginal technology over the period 2000-2016
Before the regulatory changes in 1994, the Colombian electricity market was centralized and state owned. The main criterion for decision-making regarding the expansion of the installed generation capacity was the lowest cost 28,29. This approach led to different problems; lack of funding for new generation capacity, corruption, and differences between the price and the cost of electricity
At the beginning of the 90s, the power system had 8300 MW of installed capacity, of which 78% was Hydropower and 22% Thermal power. However, only 5830 MW (62% of the installed capacity) was fully operational due to lack of rain influenced by the “El Niño” during the period 1991-1992 and the bad shape of the Thermal power plants. These two conditions led to power rationing 30 and revealed the vulnerability of the power system to climatic variations and hydrologic conditions.
To address these problems, the power system was re-structured in 1994 to create an open market in which both public and private actor could participate in. In addition, the vertical structure of the power sector was eliminated and disaggregated in generation, production, transmission, distribution, and commercialization 31. With this change in 1995, the Wholesaler Energy Market (WEM) was created with the responsibility to the delivery of the electricity service, and the government assumed regulatory oversight of the power sector. During this period, the investment strategy focused on increasing the installed capacity of the system. In 1996, the government introduced the capacity charge with the intention of creating the required conditions to the expansion of the power grid 21,22. In consequence, over the period 1995-1999, the installed capacity of the system increased by 1529 MW, of which Thermal power accounted for 66% of new capacity 32. During the “El Niño” of 1997-1998, the price of electricity increased fourfold. However, power rationing was not needed during this period 33. Despite that, the thermal power plants added reliability to the system, and the operational cost was higher than that of hydropower plants under normal climatic conditions, which made them less competitive.
The first Wind power of the power system starts in 2004 as a pilot project in the Guajira region in the north of the country with 9.8 MW and an expansion to 19.5 MW of installed capacity in 2006. This project is at the date the only Wind power plant installed in the national interconnected system. Currently, three new projects with an installed capacity of 474 MW have been proposed 34. In 2007, the government changed the capacity charge by the reliability charge, which led to the development of new power plants, mainly Hydropower plants, this decision largely reversed the progress concerning energy diversification with thermal plants reached at the end of the 90s.
In 2014, the government approved the law 1715, which aims to promote non-conventional renewable energy sources in the Colombian power system. This law encourages the adoption of renewable resources to electricity generation in order to diversify the power grid thought a new legal scheme to increase the investment, develop and use of the non-conventional renewable resources such as: Wind, Solar, Geothermal and Biomass power with tax incentives.
Recently over the period 2015-2016, the power sector presented inconveniences to satisfy the electricity demand mainly for three reasons. First, the Hydropower plants were affected by the low hydrologic conditions of the environment cause by the “El Niño”. Second, the thermal power plants that serve as support in this situation were affected by the availability of fuels and their high costs. Lastly, technical restrictions on the power systems 35.
As a result, during the period 2005-2016 the power installed capacity was increased 24% from 13,348.44 MW in 2005 to 16,594.12 to 2016, with increases in the share of 28%, Hydropower, 42% thermal power by gas and 91% Thermal power by carbon. At the end of 2016, the share of Hydropower plants in the total installed capacity of the power system was 66%, in which the Thermal power plants account the 28% while the small generators, the co-generators and the self-generators account jointly the 6% of the total installed capacity of the power system. Under this period, the wind power accounts only 0.11% of the total installed capacity in the power system. The Table 2 shows the trend in the installed capacity of the power grid in Colombia over the period 1990-2016. During this period, Colombia was characterized by a high dependency on water resources, bringing with it different kind of issues: First, high vulnerability to climatic and hydrological variations. Second, increased operational risks and volatility of the electricity prices. Third, environmental restrictions for the construction of new Hydropower plants 36.
Table 2 Total installed capacity over the period 1990-2016
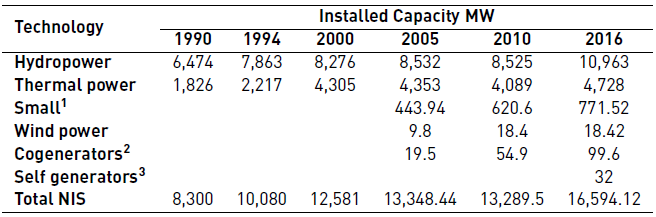
1Small refers to all power plants (Hydropower, Thermal, Wind or Solar power with less than 20 MW of capacity installed, 2all power plants that produce simultaneously electricity and heat, 3generator that produces electricity exclusively to satisfy its own needs. The self-generators start to produce electricity since 2016. Data was collected from reports published idem in 1,32,27.
3.2. Marginal technology over the period 2016-2030
By 2030, the demand of electricity in the national power system will be 103,705 GWh which means an increase of 57% respect to the 65,940.3 GWh consumed in 2016 13. The major economic sectors in electricity consumption was the Manufacturing industries with 9,348.1 GWh, mines and quarries with 4,948.5 GWh and services sector with 5,231 GWh, and the construction and Agriculture, forestry, hunting and fishing sectors with 1,274.4 GWh and 596.4 GWh respectably. The expansion planning by 2030 takes in account 1200 MW of Hydropower and 250 MW of Thermal power that actually are under construction and are planning to start in 2019 and 2017 respectively. To the previsions, the planning entity starts with a base scenario that includes the maximum capacity for Wind, Solar, and Geothermal power. The baseline scenario and the alternatives are presented in the Table 3.
Table 3 Planning total installed capacity by 2030
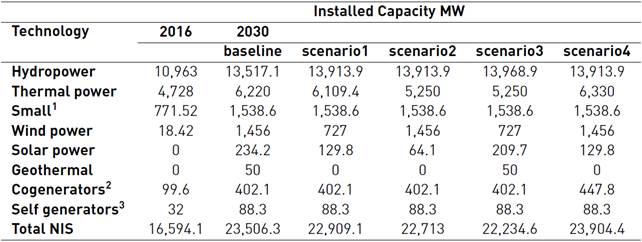
1Small refers to all power plants (Hydropower, Thermal, Wind or Solar power with less than 20 MW of capacity installed, 2all power plant that produce simultaneously electricity and heat, 3generator that produces electricity exclusively to satisfy its own needs. The self-generators start to produce electricity since 2016.
The expansion planning considers 23% of increase in the Hydropower capacity by 2030. While Thermal power would increase by about 11%-33%, small generators would reach an increase of 99%, and the Wind power will express a dramatic increase between 3847% -7804%. Otherwise the Solar and Geothermal will start to be part of the energy national system. Finally, the co-generators and self-generators will reach an increase between 304% - 350% and 176% respectively. The share of Hydropower in the total installed capacity is expected to be 62.83% - 57.50% lower than the actual Hydropower total installed capacity in the national system. The same reduction in the installed capacity of the national system is expected to Thermal power, to account 28% in 2016 to be around 23.11% - 26.46% in 2030. While the Wind power will experiment a dramatic increase in the share of installed capacity in the national system of 6.13% - 6.19% by 2030 respect to the 0.1% in 2016. Solar power will account in the best case scenario 1% of the national installed capacity, while the small, co-generators and self-generators, and the Geothermal will account jointly around the 8.52% -9.31% of the national installed capacity. The electricity productions from different resources are shown in the Table 4.
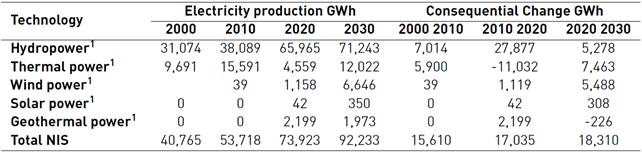
The data on electricity production in 2000 and 2010 was provided by the electricity market administrator XM and the UPME (7, 34). The capacities of Hydropower, Thermal power, Wind, Solar, and Geothermal power for 2020 are obtained from the expansion plan 2015-2020 37 and the data from 2030 are obtained from the expansion plan 2016-2030 13. The table excluded the information of the small, co-generators, and self-generators known in the government data as “others” because the projections of 2020 and 2030 do not contain any valuable information on these generators. The data of the others by 2000 and 2010 are 513 and 3170 GWh respectively with which the real demand of electricity by 2000 and 2010 was 41.276 and 56.888 GWh respectively.
4. Discussion
The results for the period 2000-2010 (all statistical data) revealed that the long-term marginal technology was Hydropower in line with historical precedent. During this period, 216 MW of Thermal power were phased out, whereas renewable sources, mainly Wind, barely reached 3% of invest. The only major Wind project was a pilot farm in the Guajira region.
The results for the periods between 2010-2020 and 2020-2030 were calculated based on information on electricity capacity and generation for the years 2020 and 2030 (outlook data) and described the consequential future, i.e., the long‐term marginal supply 28. The first period is characterized by a reinvestment in Thermal power, whereas the Hydropower continues to be the dominant marginal long-term technology. For this period, Wind and Solar power were taken into account for future projections. For the second period, the marginal long-term technology would be Hydropower for the baseline scenario and all the others scenarios. In the baseline scenario, Wind power was the technology receiving the highest share of investment among renewables during this period; however, Wind power is a constrained technology. The Thermal power is expected to face an increase in newly installed capacity due to the necessity to have a backup against climatic variations. The development of Solar power is constrained by the Wind power since all of the development of both resources are planned in the Guajira. Nevertheless is prognostic that in the future the Hydropower becomes a constrained technology by the social and environmental issues that large Hydropower plants face in the country. Furthermore, it is expected that the last large Hydro power project would be Hydro Ituango. A power plant under construction that faces serious issues and was expected to be fully ended by the end of 2022 with 2400 MW of capacity installed. The technology in the national power grid is presented in Table 5.
Table 5 Marginal technology in Colombia’s power generation sector towards 2030
1Small refers to all power plants (Hydropower, Thermal, Wind or Solar power with less than 20 MW of capacity installed, 2 all power plant that produce simultaneously electricity and heat, 3generator that produces electricity exclusively to satisfy its own needs. The self-generators start to produce electricity since 2016. The table was built upon the statistics and previsions of the XM and UPME ídem 7, 13 and 34.
The results are interesting since commonly the marginal long term technology identified is fossil fuels (co-generation). 10 found natural Gas power as marginal long term technology in the Nordic power system, while 38 from 10 studies reviewed the most commonly marginal long term technology identified was the coal and natural Gas combined heat power (co- generation). Furthermore, Wind power is mentioned as a potential marginal technology. One study used energy system analysis to identify the marginal long term technology as a mix of technologies in Sweden 39. In the same way, 40 used the energy system analysis to identify the marginal long term technology in Denmark.
According to the generation expansion plan of 2000-2015 formulated by the UPME the demand of electricity by 2010 would be around 60,467-74,127 GWh with a total generation installed capacity between 10,353-12,591 MW 41. The installed capacity by 2010 was 13,289.50 MW which was higher than the planned investments. In the generation expansion plan of 2006-2020, the total capacity installed by 2016 was planning in 13.678 MW 42. The actual installed capacity was 16,594.12 MW. The Hydropower capacity was planned to be 9,699 by 2016, which was actually 10,963 MW. The Hydropower will reach by 2020 12,334 MW and by 2030 would be around 13,517 -1,913 MW. The Thermal power was planned to be 4480 MW by 2016 and was actually 4,728 MW. While by 2020 is planned to reach 5156.3 MW until to reach a total capacity around 6,330 - 6,220 MW by 2030. In this period, the planned almost coincided with the capacity installed. While wind power is expected to reach 200.42 MW and 1456 MW by 2020 and 2030 respectively, Solar developments are expected to reach around 129.8 - 234.2 MW by the 2030. (13
Renewable sources will become the politically preferred technology to be installed over the next years; however, Wind and Solar power face technical, regulatory and natural limitations at least until to 2030. In terms of natural limitations, both Wind and Solar power plants are expected to be developed in the Guajira in the northern part of the country. The energy development in this region faces primarily three issues. First, the space to develop both technologies is limited, and the development of one resources will limited the other. Second, the Guajira region is home to indigenous cultures, which means that every project needs to be approved by the community to be developed. Third, the capacity of those resources to respond to change in demand and the transmission infrastructure needed to connect these resources to the national power grid. Geothermal power is still an immature technology in the country; therefore, is expected to be a constrained technology. Fourth, Thermal power technology is not the politically preferred technology. CO2 emissions taxes and the prices of the fuels, mainly natural gas, has made Thermal Power expensive compared to other resources; however, this technology will be needed as a support in the event of adverse climatic conditions for renewable energies.
5. Conclusions
An analysis of electricity production is a key step in LCAs studies, especially in the case of average of marginal data. Marginal data is often avoided, although marginal technology data are easy to collect and is more reliable and stable in time than average data. By using marginal data, several uncertainties are avoided. This paper showed that the methodology applied here is suitable and manageable and can be used to identify the long-term marginal technology in a given country. More specifically, the findings show that the current and future long-term marginal technology in Colombia for the periods of 2000-2016 and 2016-2030 will be Hydropower.
Although the projected capacity has matched the real capacity installed in recent years, uncertainties regarding with the prices of fuels, emissions taxes, cost of technologies, energy polices, and environmental and social pressures make it exceedingly difficult to predict how the power generation market is going to develop in the future. Because the marginal technology will have to operate as an integrated part of the total energy production, it is likely that the marginal long-term technology will involve a mixture of different technologies rather than only one 40. To address this issue, energy systems models should be combined with LCAs to identify a potential complex set of marginal technologies. (39
The findings of the study will be useful to both practitioners and policymakers in several ways. They allow practitioners to evaluate the use of actual and future marginal electricity technology in LCAs in Colombia. Moreover, the finding point the way to further research, particularly the necessity to identify marginal technologies as a mixture of different resources. The findings also help policymakers to anticipate the configuration of the future electricity power grid, to calculate the environmental impact of future investments, and to be prepared for the consequences of introducing renewable resources into the national power grid.

