


 Article in xml format
 Article references
 Send this article by e-mail
 Cited by SciELO
  Cited by Google
  Similars in
SciELO
Similars in
SciELO  Similars in Google
 Permalink
1. Introduction
Anaerobic reactors are widely used in warm-climate regions for low-strength wastewater treatment due to the advantages as low cost, operational simplicity, no energy consumption and low production of solids. However, the anaerobic effluent usually needs post-treatment to reach the discharge standards established by the environmental legislation [1]. Reactors as the upflow anaerobic sludge blanket (UASB) followed by activated sludge have been employed to treat municipal wastewater [2, 3] and this combination has potential to meet the effluent discharge limit.
Municipal and institutional wastewater has a low C/N ratio (C/N < 8.0) which is an important indicator that it can directly affect the anaerobic treatment. The optimal C/N ratio for anaerobic degradation depends on the substrate used, but a value between 20-30 is recommended [4]. When a substrate has low C/N ratios, it is considered to contain relatively high ammonium concentrations, inhibiting the microbial growth and the anaerobic digestion. Furthermore, anaerobic reactors treating wastewater rich in nitrogen tend to have high pH values [5]. At high pH values, free ammonia dominates and this form is more inhibitory than the ammonium ion (NH4) [6].
The C/N ratio and the pH play an important role in the anaerobic digestion process. The pH influences the chemical equilibria of NH3, H2S and Volatile Fatty Acids (VFA's), which could inhibit the activity of the microorganisms. The ideal pH range for anaerobic digestion has been reported to be 6.8-7.4 [7].
Wastewater with low C/N ratio and high pH need to be balanced to treat in anaerobic reactors. Combined treatment (anaerobic-aerobic) offer many advantages as the effluent polishing and a sludge treatment simplified because only the dewatering stage is necessary [1]. Furthermore, the excess aerobic sludge can be used as co-substrate to balance the C/N ratio and the pH.
To define the optimal sludge recirculation to balance the pH and the C/N ratio and obtain the maximum methane production is necessary to carry out tests with different mixtures of sludge and wastewater. The aim of this study was to evaluate the influence of pH and the C/N ratio on the biochemical methane potential of low-strength wastewater.
2. Material and methods
2.1 Substrate, co-substrate and inoculum
Wastewater from Pontificia Bolivariana University (UPB by its acronym in Spanish) and aerobic sludge from secondary treatment were used as substrate and co-substrate, respectively. Anaerobic sludge from wastewater treatment plant of soft drinks was used as inoculum. Physico-chemical parameters were evaluated to substrate, co-substrate and inoculum according to standard methods [8]. In addition, the following activities were performed to the inoculum: acidogenic (AA), hydrolytic (HA) and specific methanogenic activity (SMA).
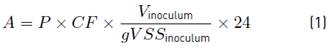
Glucose and starch were used as substrate for AA and HA tests, respectively. The tests were performed using amber bottles with 100 mL of working volume, which were filled with inoculum (1.5 gVSS/L) and substrate (0.15 gCOD/L). All the experiments (AA, HA and SMA) were carried out under the addition of macro-nutrients, micro-nutrients, yeast extract and bicarbonate [9] and were incubated at 37°C. Samples of the supernatant were taken to determine the remaining glucose or starch concentrations in the flasks. The starch concentration was measured as the difference between total sugars and reducing sugars. Glucose concentration was assumed as reducing sugars concentration. Reducing sugars were determined by spectrophotometry at 540 nm according to the DNS method [10] and the total sugar with Dubois method [11]. AA and HA were calculated with the Equation (1), where P is the maximum slope consumption, CF is conversion factor (gCOD/g glucose), V and gVSS are inoculum volume and mass added [12].
In the SMA test, a volatile fatty acids solution composed of acetic, propionic and butyric acid, was used as substrate. The test was performed using the Oxitop® system (WTW Germany) with 500 mL capacity glass bottles and the working volume was 400 mL. Bottles were filled with inoculum (1.5 gVSS/·L), substrate [13], macro-nutrients, micro-nutrients, sulfide solution, yeast extract and bicarbonate [9]. The pH was adjusted to a value of 7 after the mixing. The bottles were flushed with N2 gas for 3 minutes to maintain an anaerobic condition and NaOH pellets were dosed inside a plastic holder inside the OxiTop flask, just underneath the screw-cap to absorb carbon dioxide from biogas. The bottles were incubated in a water bath at 37°C and manual stirring (three times a day) was used. Biogas production was measured as pressure increase every two hours during the first week and gradually decrease until the end of the test. The pressure measured by the head was converted in accumulated volumetric methane production (L) with Equation (2).
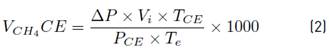
Where:
𝑉𝐶𝐻4𝐶𝐸: Volume of 𝐶𝐻4 at standard conditions (L)
𝑃: Pressure recording obtained in the OxiTop (atm)
𝑉𝑙: Free volume of the reactor (L)
𝑇𝑒: Temperature of the experiment (K)
𝑇𝐶𝐸: Temperature at standard conditions (K)
𝑃𝐶𝐸: Pressure at standard conditions (atm)
SMA was calculated with the maximum slope of the accumulated methane production curve (mL/d), divided by the amount of VSS introduced in the bottle using the proper conversion factor to report it as gCODCH4/gVSS·d.
2.2 Experimental Conditions
To evaluate the influence of the pH and C/N ratio on the biochemical methane potential a 32 factorial design was used. C/N ratio used were 4.9 (C1), 8.2 (C2) and 14.2 (C3) and pH values were 9.0 (pH1), 7.5 (pH2) and 6.9 (pH3) units. C1 and pH1 are the operating conditions of the wastewater treatment plant at UPB. C/N ratio was changed with the co-substrate addition, simulating the aerobic sludge recirculation to the anaerobic reactor, and the pH with hydrochloric acid 0.1N. Table 1 shows the operating conditions used.

2.3 Biochemical methane potential tests
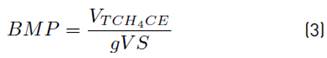
The BMP assay was performed using the Oxitop® system (WTW Germany) with 250 mL capacity glass bottles and the working volume was 200 mL. Bottles were filled with inoculum (1.5 gVSS/L), substrate and co-substrate, macronutrients and micronutrients. The bottles were incubated at 37°C and manual stirring was used. Biogas production was measured as pressure increase. Control test without substrate/co-substrate was used to measure the amount of methane produced by inoculum. The BMP was calculated by Equation (3), where VTCH4CE is the methane volume at standard conditions (L) and gVS is the volatile solids of the substrate. Three replicates were used for each operating condition [Table 1]. The BMP was calculated by subtracting the control results to each trial.
The influence of the pH and C/N ratio on the biochemical methane potential was evaluated applying the modified Gompertz model, according to Equation (4) [14, 15]:
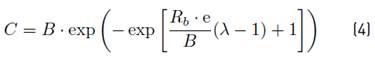
Where C is the cumulative methane production (ml) obtained at time t (d), B is the methane production potential (ml), Rb is the maximum methane production rate (mL·d-1), λ = lag phase time (d) and e is a mathematical constant (2.718).
3. Results and discussion
3.1 Substrate, co-substrate and inoculum characterization
The chemical characterization of substrate, co-substrate and inoculum is shown in Table 2. The pH value in the substrate was 9.03 units which is related to high urea content and the use of alkaline detergents in the institution. High values of pH cause instability of anaerobic digestion due to the rapid conversion rate of ionized ammonia nitrogen into free ammonia nitrogen. For limiting the inhibitory effect of free ammonia nitrogen on the anaerobic digestion process, it is suggested to keep the pH values close to 7 [6].
According to the results, the wastewater has low volatile solids (45% TS) and COD content. The COD/BOD was 1.95 showing that the biodegradable fraction is high and it is a good indication for biological treatment [16]. Total Kjeldahl nitrogen (TKN) was 118.08 mg/L and ammonium nitrogen was between 50 and 200 mg/L contributing to the necessary nutrients for the growth of microorganisms [6]. However, the C/N ratio was very low (4.9). The optimal C/N ratio for anaerobic degradation of organic waste is between 20 and 35. The low C/N ratio is regarded as an important factor limiting anaerobic digestion [7]. Because the substrate has a very low C/N ratio (4.9), co-digestion with carbon-rich co-substrate is widely recommended. The aerobic sludge from secondary treatment was used as co-substrate to increase the C/N ratio. The total COD, TKN and C/N ratio were 40000 mg/L, 180 mg/L and 220.
For inoculum, the VS/TS ratio (0.9) shows the presence of active biomass useful for the degradation of organic matter and the pH and alkalinity values has good buffer capacity [17, 18]. To evaluate the different anaerobic consortia in the inoculum, hydrolytic, acidogenic and methanogenic activity were made. Starch and glucose consumption were analyzed for 72 hours to determinate the HA and AA of inoculum, respectively. The maximum consumption rate of starch was in the first 4 hours resulting in an HA value of 2.79 gCOD/gVSS·d showing the ability of inoculum for degrading the substrate used. For glucose, the maximum consumption rate was between 7 and 12 hours and the AA was 2.8 gCOD/gVSS·d. According to [19], the hydrolytic and methanogenic activities depend on the type of biomass, type of substrate and/or the operational conditions. They found, for biomass from sugar industry AA and HA values similar to those found in this study. The SMA obtained was 0,14 gCODCH4/gVSS·d, indicating good capacity as inoculum [20]. However, hydrolytic and acidogenic activities were higher than the specific methanogenic activity, due probably to an imbalance in the syntrophic groups of inocula by the origin of the sludge.
3.2 Influence of pH and C/N ratio on the methane production
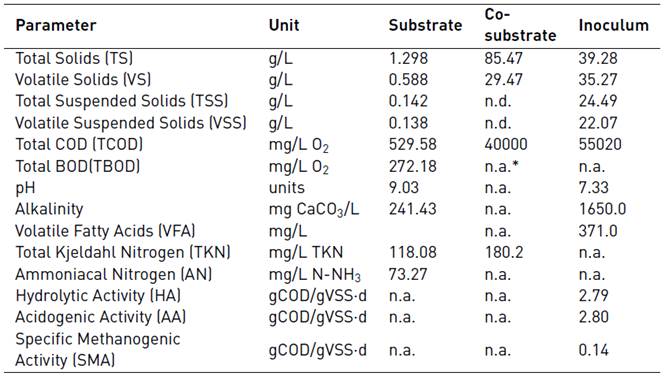
The comparison of experimental and predicted cumulative biogas production using the modified Gompertz model for each C/N ratio is shown in Figure 1. According to the results, the highest values of methane production were reached with pH2 reaching values of 27.3, 49.0 and 61.0 mL CH4 for C1, C2 and C3, respectively. Furthermore, the effect of pH on the methane production for C1 was not as strong as on C2 and C3 due to C1 is the ratio to which the treatment plant works. For C1, the methane production achieved with pH2 was 49% and 12% higher than those reached with pH3 and pH1, respectively. Conversely, the C2pH2 combination obtained methane production 98% and 238% higher than with pH3 and pH1, respectively. However, for C1, the lowest methane yields were obtained.
The ideal pH range for methanogenic and acidogenic microorganisms is different. Methanogenesis is most efficient at pH 6.5-8.2, being the optimal pH 7.0 and the activity of methanogenic bacteria decreased at a higher or lower pH [21]. Although pH3 was close to 7.0, the methane production was low for all C/N ratios, probably because the alkalinity was not enough to buffer the volatile fatty acid production, inhibiting the activity of methanogens. Furthermore, the optimal pH depends on the type of substrate, as well as on the type of microorganisms involved in the digestion process [1].
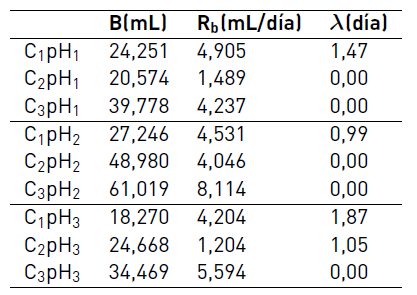
Table 3 shows the kinetic parameters obtained with the Gompertz model. The pH has a direct influence on the methane production potential (B) and the maximum methane production rate (Rb). It was found that the value of Rb obtained at pH2 was higher than the value obtained at pH1 and pH3. These results are in agreement with other authors who report that the optimal pH for methanogenesis is around 7.0 [7]. When the pH is high, the ionized ammonia nitrogen can be converted in free ammonia nitrogen and inhibiting the methanogenesis [6].
The lag phase of the Gompertz equation was not influenced by the pH, however, the C/N ratio was a relevant factor. For C1, the lag phase was between 1 and 2 days while the other ratios non-lag phase was observed. These results show the inhibition of anaerobic process with substrates with a low C/N ratio.
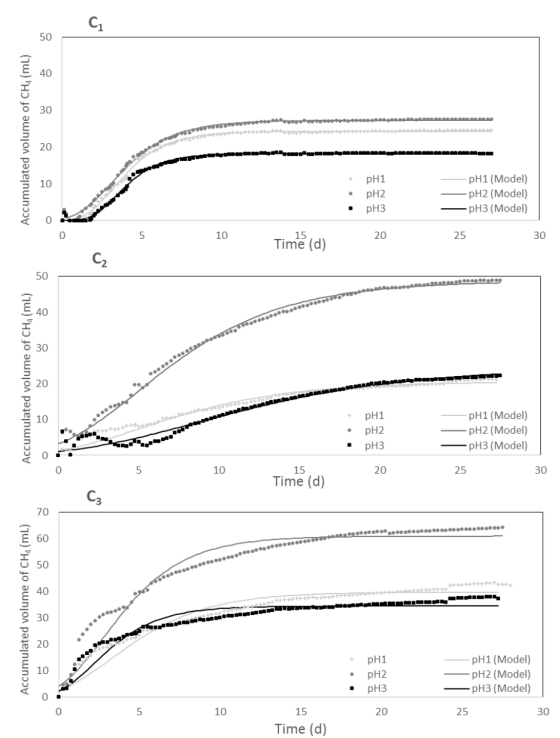
Figure 1 Influence of pH on methane production (mL CH4). The solid line represents the Gompertz model fit data
Anaerobic digestion is a process susceptible to environmental conditions, due to the interaction between fermentative and methanogenic microorganisms. C/N ratio is a relevant factor in methane production. When the C/N ratio is high in the substrate, nitrogen will be consumed rapidly by methanogens to meet their protein requirements, which results in low methane production and with low C/N ratio, nitrogen will be present in the form of ammonia which inhibits the methanogens metabolism due to its toxicity [22].
The comparison of experimental and predicted cumulative biogas production using the modified Gompertz model for each pH value is shown in Figure 2. All the C/N ratio had TKN concentrations between 127.9 and 119.4 mg/L, according to the nutrients required for the anaerobic digestion process [6]. As can be seen in the figure, for all pH value the higher methane production was achieved with the C3. Several authors suggest optimal C/N ratio between 20 and 30 [21]; however, other authors have reported different values for C/N ratio depending on the substrate. For the co-digestion of onion juice and wastewater sludge, it has been suggested that the C/N ratio be 15 [23]. In addition, it has been reported that lower C/N ratio promoted the activity of the methanogens in a long time when anaerobic semi-continuous digestion of food wastes/animal slurry wastewater was performed [24]. The effect of C/N ratio and organic loading rate (OLR) on the anaerobic co-digestion of high solids containing distillers grains and swine manure was evaluated [25]. The authors reported that maximum methanogenesis was achieved with the C/N ratio of 30/1. Other reports have shown that the benefits of improving methane yield from anaerobic digestion of multi-component substrates, based on optimized feeding composition and C/N ratio [26]. C/N ratios of 25:1 and 30:1 had similar highest cumulative biogas production, about threefold higher than that from material with a C/N ratio of 15:1.
According to the results, there was a first stage during the first 7 days of operation, in which the methane production rate was the highest in all the digestion time, and then those values decreased gradually to become almost zero. The average methane production rate in the first stage were 2.86, 2.01 and 4.83 for C1, C2 and C3, respectively, indicating a greater conversion of organic matter into methane for the highest C/N ratio evaluated. Considering the pH, the methane production rate in the first stage were 2.82, 4.57 and 2.32 for pH1, pH2 and pH3, respectively. The results suggest that the optimum conditions for maximum methane production were with pH2 (7.5) and C3 ratio (14.2). In this condition, the highest methane production reached was 61 mL CH4.
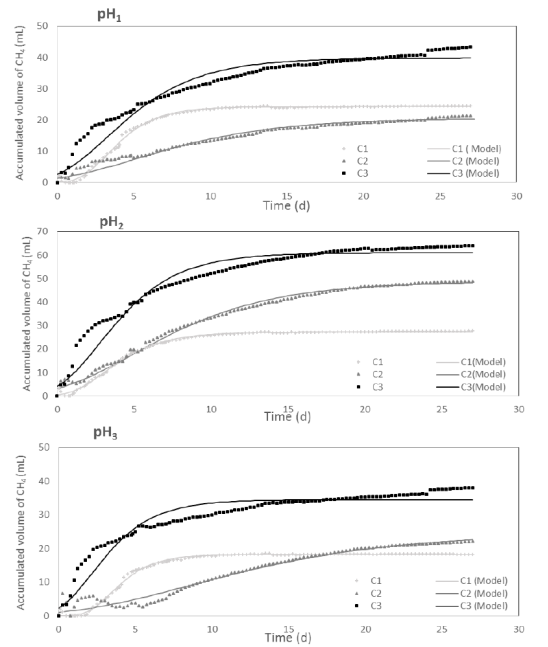
Figure 2 Influence of C/N ratio on methane production (mL CH4): (A) pH 9.0±0.5; (B) pH 7.5± 0.1; (C) pH 6.9±0.1. ). The solid line represents the Gompertz model fit data
The biochemical methane potential (BMP) test is the definition of the methane (or biogas) produced from a given weight of a certain substrate [27] and this has been used to determinate the energy efficiency of different wastes or substrates. Figure 3 shows the BMP results for each C/N ratio and pH evaluated.
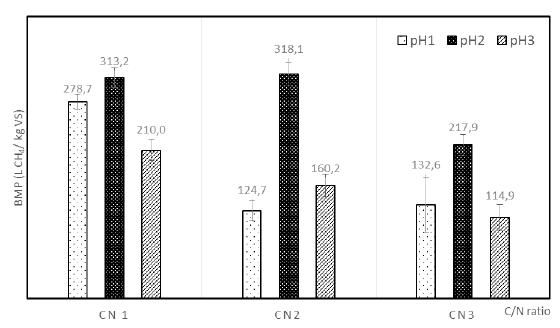
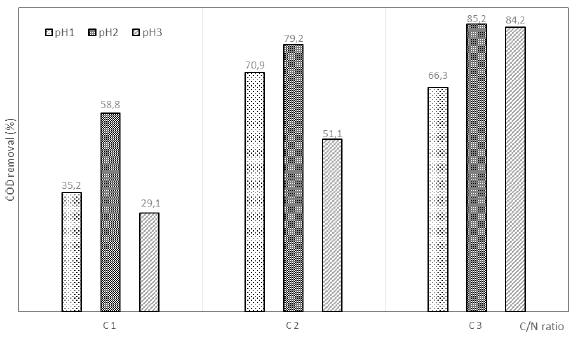
Figure 3 shows that for pH1 and pH3 the BMP value obtained was lower than for pH2 for all C/N ratios. The maximum BMP value was 318.1 L CH4 /kg VSS with initial pH2 and C2, with a COD removal of 79.2%, is a viable option to improve the anaerobic treatment. Furthermore, although the maximum methane production was presented for the C3pH2 condition (61 mL CH4), the BMP in this condition (217.9 L CH4 /kg VSS) was lower than the other C/N ratios. However, the COD removal was higher (85.2%) than other conditions as can be seen in Figure 4. This behavior is due to the carbon source used as co-substrate to rise the C/N ratio of the reactors since the use of aerobic sludge increased the VS content. For C3, the VS was 1.99 g/L while for C1 and C2 were 0.58 g/L and 1.08g/L, respectively, therefore the BMP value decreased causing the substrate loses energy efficiency [28].
According to Figure 4, the COD removal was above 70% for C2 and C3, however, the methane production rate of C3pH2 was twice higher than C2pH2 indicating that this condition is better to the wastewater treatment plant. Conversely, when the methane production of C3pH2 (61.02mL CH4) is compared with C3pH1 and the COD removal obtained (85.23% and 66.30%, respectively), it is evident that the anaerobic processes inside the reactor were affected due to an inhibition in pH1 condition [29].
4. Conclusions
To increase the methane production and the COD removal in the wastewater evaluated, the pH value must be lowered to 7.5 and the C/N ratio increased to 14.2 with aerobic sludge recirculation from secondary treatment. At pH values below 7.0 units, the methane yield could be inhibited probably because the alkalinity was not enough to buffer the volatile fatty acid production, inhibiting the activity of methanogens.
The BMP of wastewater was influenced by the carbon source used as co-substrate to rise the C/N ratio in the reactors since the use of aerobic sludge increased the VS content.

