


 English (pdf)
 Article in xml format
 Article references
 Send this article by e-mail
 Cited by SciELO
  Cited by Google
  Similars in
SciELO
Similars in
SciELO  Similars in Google
 Permalink
1. Introduction
Emerging contaminants can be present in different environmental compartments in concentrations ranging from ng/L to μg/L [1]. Many of these pollutants are components of commercial products that are used daily in domestic and industrial settings, including pharmaceutical products and personal care products (PPCPs) [2]. It is estimated that these substances, although found in low concentrations in the environment, could produce environmental impacts due to their frequent use, persistence and the risk they pose to aquatic life and humans [3].
One group of such emerging pollutants are parabens, which include Methylparaben (MePB), Ethylparaben (EtPB), Propylparaben (PrPB) and Butylparaben (BrPB) [4], which are widely used alone or combined in everyday products such as cosmetics or personal care products. They are used to retard the growth of fungi and bacteria through their fungicidal and antimicrobial properties [5]. Parabens have received increasing attention due to their possible long-term effects on human health and aquatic organisms [6]. Concentrations of MePB detected in wastewater treatment plants (WWTP) can be significant, with levels up to 80 μg/L being found in tributaries [4]. Due to their wide and continuous use parabens can enter the environment via domestic and industrial wastewater. [6]. As conventional wastewater treatment plants have not been designed to treat this type of pollutant [1], there is a high probability that these compounds reach the natural environment without being removed to a significant degree. For this reason, the development and optimization of physicochemical and biological treatment technologies that can solve this problem and ensure the safety of residual effluents has been evaluated in recent years. Among these technologies, biological systems (anaerobic and aerobic) are of great attractiveness because they can achieve high efficiencies at a low cost of operation. The Sequencing Batch Reactor (SBR) is a promising aerobic based technology due to its high efficiencies and great operational versatility, which has been used both for the removal of organic matter and nutrients.
Some studies have reported that micropollutants such as parabens were 99% biodegraded in less than 5 days [4], while [1], recorded MePB removal percentages greater than 97%. However, it is not yet clear if there are alterations in the operation of SBR system due to changes caused to the populations of microorganisms in contact with the micropollutant. Changes in the microbiota of the reactor could be associated with the prevalence of a certain group of microorganisms or with a change in the structure of the microbial populations, which could alter the dynamics of response and / or performance of the reactor against fluctuations in the treatment affluent. For this reason, this study evaluated the removal process of MePB present in a synthetic wastewater at different levels of concentration through the application of aerobic biological processes, in order to determine the effect of this pollutant on the behavior and evolution of microbial populations responsible for the removal of MePB and COD.
2. Materials and methods
2.1 Description of the SBR reactor
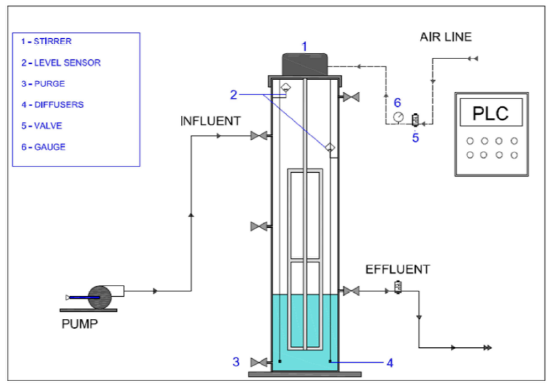
The experimental test was carried out at the GDCON group with an existing SBR system at laboratory scale, manufactured in acrylic, with a height of 70 cm and internal diameter of 15 cm. The phases of the reactor were automated by “batch” with a PLC (Programmable Logic Control) system developed by [7], which allows versatility and flexibility in the operation. The system, shown in Figure 1, has a mechanical agitator, peristaltic pump, six submerged air diffusers, and their respective valves.
2.2 Inoculum
The sludge used to inoculate the reactor was taken from the wastewater treatment plant (WWTP) of the recreational park “Parque los Tamarindos”, where an industrial-scale SBR system is used to treat waste mainly of domestic and recreational characteristics. The sludge has a concentration of total suspended solids (TSS) of 7220±66.6 mg/L, a concentration of volatile suspended solids (VSS) of 4945±6.1 mg/L, and a sedimentation rate of 2. 12±0.01 m/h”
2.3 Operational strategy
The operation of the SBR system was distributed over 14 weeks in three operation stages, which included stabilization and startup (Stage I), and the variation of the concentration of the study pollutant (Stage II = 300 μgMePB/L and Stage III = 600 μgMePB/L). Figure 2 shows the operation stages:
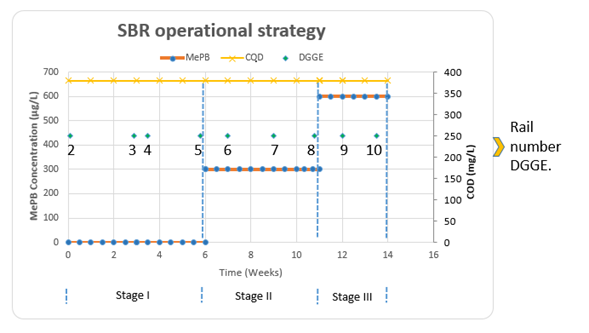
Figure 2 specifies the moments for each stage in which samples were taken for DGGE molecular microbiology analyzes, usually at the beginning and end of the stage. The number that represents each point determines the vertical band showing the result in the DGGE photograph.
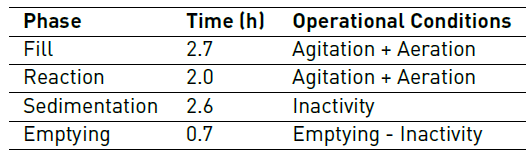
The COD concentration contributed by glucose remained constant throughout the experimentation. The hydraulic retention time was 8 hours, with a high sludge age of around 12 days, and F/M ratio (food/microorganisms) approximately ranging between 0.7 - 0.9. Each cycle was made up of the phases described in Table 1.
2.4 Composition of synthetic wastewater
For the reactor operation, wastewater was prepared in the laboratory according to the minimum requirements of the metabolism of the microorganisms, taking into account macro and micro nutrient solutions as reported by [8] and the COD: N: P ratio. of 100: 5: 1 reported by [1]. The main source of added carbon was industrial glucose and, to avoid its rapid degradation in the environment and the acidification of the mixing liquor, industrial sodium bicarbonate (NaHCO3) was added in a 2:1 ratio of glucose and bicarbonate, respectively. Additionally, the pollutant was added to the solution in accordance with the stage of operation.
2.5 MePB degradation kinetics tests
The degradation kinetics tests of MePB were carried out in 2L containers with continuous aeration systems that guaranteed complete mixing. The biomass was inoculated with micro and macronutrient solutions according to the dilution water conditions of the BOD5 method [9]. Additionally, glucose was used as co-substrate in a COD concentration of 250 mgO2/L.
Experimentation of MePB degradation was carried out at two pollutant concentrations. The first, of 179 ± 38 μgMePB/L, was established in two biomass concentrations with values of 1450 and 2016 mgSSV/L. The second concentration, of 472 ± 38 μgMePB/L, was degraded at biomass concentrations of 1467 and 2667 mgSSV/L. The MePB was tracked with periodic sampling to determine the kinetic degradation constant, KBiol, according to a pseudo-first-order reaction [10].
2.6 Calculation of K biol
The degradation of the MePB was calculated from the biodegradation constant, KBiol, following a pseudo-first order kinetic [10, 11] according to the Equation (1):
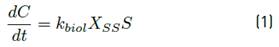
Where C is the total concentration of compound (µg/L), S the concentration of soluble compound (µg/L), t time (d), Kbiol the rate of reaction constant (Lg--1 SSd-1) and XSS the suspension of solids (gSSL-1) [12] .
2.7 Analytical methods
Monitoring of control and response variables, such as chemical oxygen demand (COD), dissolved organic carbon (DOC), dissolved oxygen, pH, oxide-reduction potential (ORP), volatile suspended solids (VSS), total suspended solids (TSS) and the volumetric sludge index (IVL) were performed in the GDCON laboratory of the University of Antioquia, according to the methodologies established by Standard Methods [9]. This laboratory has IDEAM accreditation (Institute of Environmental Studies of the Ministry of Environment of Colombia) for the analysis of these parameters.
The quantification of MePB was performed by liquid chromatography coupled to a mass spectrometry detector using ACQUITY UPLC H-Class equipment (Triple quadruple) coupled to a XEVO TQD mass spectrometer, through an internal method developed in the GDCON laboratory of the University of Antioquia.
The variation of the prokaryotic community in the SBR system was evaluated using the molecular technique Electrophoresis in Denaturing Gradient Gel (DGGE). Samples were collected once a week from the mixing liquor as follows: 100 mL of liquor was centrifuged at 6,000 rpm for 5 minutes (Eppendorf Centrifuge 5810R), the supernatant was discarded, and the pellet then maintained in Eppendorf tubes at -20°C until the time of analysis, at the end of the experiment. Only the representative samples were analyzed, usually at the beginning and end of each stage of operation. DNA extraction was performed with the commercial kit E.Z.N.A® Soil DNA (Omega bio-tek, USA) according to the manufacturer's instructions.
For the DGGE analysis, the DNAr 16S fragments corresponding to nucleotide positions 341 - 534 in the E. coli sequence were amplified using the 341fGC primers with “the GC clamp of 40 base at the 5` end and the reverse primer 518r. The Taq DNA polymerase (Thermo, Scientific #EP0402) kit was used for PCR. Each PCR reaction contained 25 μL of the mix composed of: 2.5 μL of Taq Buffer 10X, 1.5 μL of MgCl2 25 mM, 0.5 μL of dNTPs (final concentration 200 μM), 0.5 μL for each primer (final concentration, 0.2 μM), 0.1 μL of Taq polymerase (0.5 U/25 μL of reaction), 2.5 μL of 1% bovine serum albumin, 3 μL of DNA (~20 ng) and 13.9 μL of water.
The reaction was performed in a TM100TM thermal cycler (Bio-Rad, USA). The PCR was performed according to [13], with the following modifications: the annealing temperature at 65°C decreased 1°C per cycle instead of every two cycles, and 20 additional cycles were run at 55°C. The DGGE was performed at 6% (P/V) of polyacrylamide (Acryl/BisTM,37.5:1, AMRESCO®, USA), in a TAE 1 X buffer, at a temperature of 60°C, for 500 minutes, at a power of 110 V. The buffer contained a denaturing gradient of 30-70% urea and formamide (100% Urea 7 M and 40% formamide (P/V)). After electrophoresis, the gel was stained with Sybr® Green 1 X (Lonza, USA) at TAE 1 X for 30 minutes, before visualization (Labnet, EnduroTM GDS). The gel image was captured on an ENDURO GDS Touch gel documentation system (EnduroTM Labnet, USA) under UV light. DGGE banding patterns were analyzed using GEL COMPAR II (Applied Maths, Ghent, Belgium) software. The similarity matrix was calculated using the Pearson's correlation coefficient. Cluster analysis was performed using the unweighted pair group method with an arithmetic average (UPGMA). Similarity analysis was used to examine the significant statistical differences between the DGGE profiles and the results were finally presented as a dendrogram.
3. Results and discussion
3.1 Degradation kinetics
The degradation kinetics constant, KBiol (LgSS -1d-1), based on a pseudo-first-order reaction, is used to describe the exponential degradation of the contaminant with the concentration of suspended solids of the mixing liquor (mgVSS/L) [10]. Under this model, the results of MePB degradation are shown in Table 2.
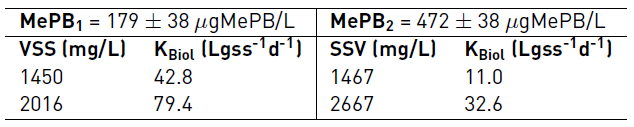
The results of the degradation kinetics of MePB showed an important effect of the biomass and initial micropollutant concentration on the pollutant degradation speed. This behavior can be observed in Table 2; when the MePB concentration is increased and biomass concentration remains similar, the degradation rate decreases markedly. The degradation constant (Kbiol) for the average biomass concentration of 1458 mgVSS/L presents values of 42.3 and 11.0 Lgss-1d-1 for MePB concentrations of 179 and 472 μg/L, respectively. This indicates that when the concentration of MePB increased from 179 μg/L to 472 μg/L, the degradation rate of the compound decreased by the order of 3.8 times, based on the value of the constant obtained for the lowest concentration of the contaminant (179 μg/L). This behavior is seen to be repeated for the average biomass concentration of 2342 mgVSS/L when the two MePB concentrations are evaluated.
On the other hand, when analyzing the variation in Kbiol for each concentration of the micropollutant, it was evidenced that when the concentration of the biomass increases, these values also increase significantly. In the case of the concentration of 179 μg/L of MePB, Kbiol values were obtained of 42.8 and 79.4 0 Lgss-1d-1 for VSS values of 1450 and 2016 mg/L, respectively. This indicates a favorable effect of increasing the sludge concentration on the degradation rate of MePB. This trend has been reported in other studies, in which it is indicated that there is a directly proportional relationship between the biomass concentration and the increase in the degradation rate of organic micropollutants. [10].
The values of the biodegradation constant (Kbiol) have been reported in a range that varies from 0.72 to 17.44 L.gSST−1.d−1 [14]. Values in this range that are above 10 L.gSST-1.d-1 present high biodegradation [1]. This indicates that the values of the degradation constants obtained during the experimentation are the result of high biodegradation of the MePB in the test conditions. However, the variation between these Kbiol values is explained by the concentration of the biomass, as well as by the initial concentration of the microcontaminant.
3.2 Analytical follow-up of the SBR
The operation of the SBR system begins with a period of acclimatization of the sludge to the new hydraulic and environmental conditions in the reactor. This aims for the adaptation of the microorganisms to the synthetic wastewater, taking into account that the microorganisms were previously in other conditions, of WWTP origin. The synthetic wastewater prepared for the experiment had a TKN level of 21.840 mgN/L and a phosphorus level of 5.78 mgP/L, meeting the minimum requirements for the metabolism of microorganisms according to the COD ratio: N: P of 100: 5: 1, recommended for aerobic processes by [8].
The inoculation sludge was recovered directly from the purification line of the WWTP of the recreational park Parque los Tamarindos, which had a total suspended solids concentration (TSS) of 5580 mgSST/L, of volatile suspended solids (VSS) concentration of 5020 mgVSS/L, and an adequate sedimentation rate, evidenced in the clarification of treated water.
The dissolved oxygen concentration of the mixture liquor under normal operating conditions ranged between approximately 4 and 5 mgO2/L. These values indicate that an adequate supply of DO for the oxidation process of the organic matter and to satisfy the demand of the microbial mass was present, with a residual above 2 mgO2/L being maintained [1].
The behavior of the pH during the experimentation was very stable, presenting values with a tendency to neutrality, between 6.5 and 8.5. These values are reported by [1], for the optimal performance of the aerobic biomass.
COD analyzes were performed to evaluate the removal percentage of organic matter during the experimental phase, the results of which are shown in Figure 3.
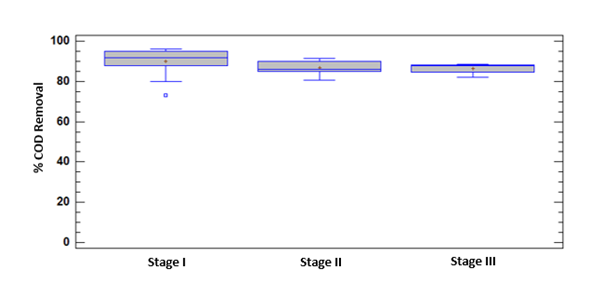
The maximum values of organic matter removal by COD in Stage I were greater than 96%. Such values are comparable with other suspended biomass SBR systems that can remove organic contaminants relatively well in terms of carbon removal (C). Thus, some studies report eliminations of more than 90% in Biochemical Oxygen Demand (BOD) [15].
The maximum values of COD removal in the experiment occur when a steady state is achieved in the biological system and a sludge age is reached with an optimum F/M ratio. However, during the experimental period this cell retention time showed small variations, which implied changes in the quality of the effluent and sedimentation of the sludge. Even so, COD removal percentages higher than 80% were obtained throughout the experimentation.
During Stage II, a decrease and recovery was observed in the removal of COD corresponding to contact with the first load of the pollutant. The removal behavior of MePB in Stage II showed an increase [Figure 4]; probably while the adaptation of the microorganisms to the contaminant to a new source of carbon for its metabolic functions occurs.
Removal percentages at all the stages of experimentation show no statistically significant differences. Even so, the small variations between stages can probably be associated with slight changes of in the microbial populations in the system, due to operational conditions or the impact of the pollutant itself.
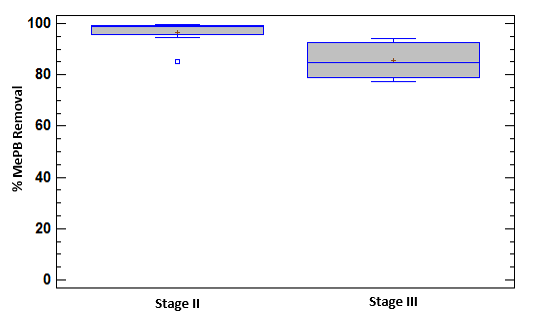
The results of MePB quantification allow the determination that the percentages of elimination of the contaminant are statistically different at the various stages, due to removal variations in time, which is probably caused by alterations in the microbial populations of the system in contact with the MePB or in the operating conditions.
Parabens have been described as easily biodegradable under aerobic conditions, such as in the case of biodegradation using activated sludge [4]. At Stage II the MePB removal percentages are greater than 95%. These results of high efficiency are comparable with those reported by [1]. Additionally, high parabens removal percentages with biological treatment systems have been reported (96.1 to 99.9%), but these pollutants persist in effluents at concentrations up to approximately 4 μg/L [4]. At Stage III, a change in the MePB removal percentage of 85.5 ± 7,6% is clearly observed. A marked effect on the system of increasing the pollutant concentration can be inferred. However, as time passes, the microorganisms increasingly tolerate the conditions of the pollutant in their environment and achieve removal percentages close to 90%.
The high removal rates of the microcontaminant are clear because MePB has shown almost complete biodegradation (99%) in less than 5 days, with a half-lie of no more than 3 days. This indicates that it is biodegraded in its entirety and that abiotic effects such as sorption are not relevant [4].
The sludge volumetric index (IVL) and biomass concentration, represented by mgVSS/L, is shown in Table 3 for each stage.
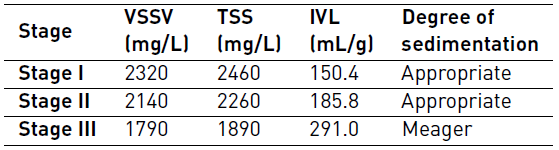
Monitoring of the IVL and the concentration of solids was carried out at the end of each stage. In general, a tendency to lose biomass between stages was observed, influenced by the decrease of the degree of sedimentation, which is due to the operational conditions such as the optimization of the sludge age. It is not possible to state that MePB is the cause of this.
3.3 Analysis of bacterial changes
The sludge samples analyzed with DGGE are specified in Figure 5, and correspond to the most representative of each stage of experimentation. These are: for Stage I Lanes (2, 3, 4, 5); Stage II (6, 7, 8); and Stage III (9,10). In the DGGE image in Figure 5, the results of the molecular tests for each sample, represented by vertical rails or bands, can be observed.
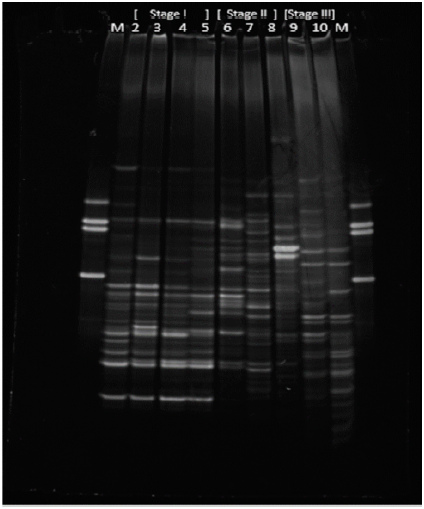
Figure 5 Photograph obtained from DGGE for the biomass of the SBR system at the different stages of operation
The lanes named as (M) in Figure 5 correspond to test markers or controls. These are presented as two identical profiles and must give a percentage of similarity of 100%, which marks a noticeable difference between the other bands and a relevant similarity between them.
At first sight, the results of the DGGE show profiles with highly diverse denatured fragments at all stages. Depending on the intensity of the band, it can be inferred that there is a greater population can be inferred at some moments than others. Although the banding pattern cannot indicate abundance, since DGGE is a qualitative test, high richness can be stated to be present throughout the experimentation, including at the highest concentration of MePB, which is characteristic of aerobic sludge. This may indicate that the microorganisms analyzed by DGGE did not suffer a very marked effect from the presence of MePB in their environment.
It is interesting to note that MePB, an antimicrobial compound, does not generate significant variability in the microbial populations represented by the 16S rDNA fragment, and how the aerobic biomass maintains high diversity characteristics throughout the time experimentation, in contrast to the high removal values of MePB during Stage II and Stage III.
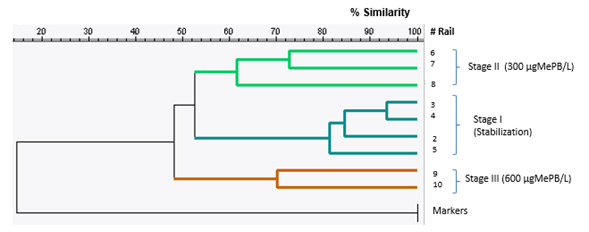
The results shown in the dendrogram in Figure 6 correspond to three main clusters, which group the samples in stages. The similarity percentage between the samples shows that the microorganisms did not suffer drastic changes between the different stages.
The samples from Stage I correspond to two periods of stabilization at different times. Even so, it can be observed that the four samples have a similarity percentage of 81.22%. It can be inferred that the biological system of the Tamarindos recreational park does not show strong changes in its microbial population over time under normal operating conditions.
The Shannon-Weaver diversity index for each of the DGGE profiles was calculated using the GelCompar® II program (Applied Maths, Belgium). The results are shown in Table 4.
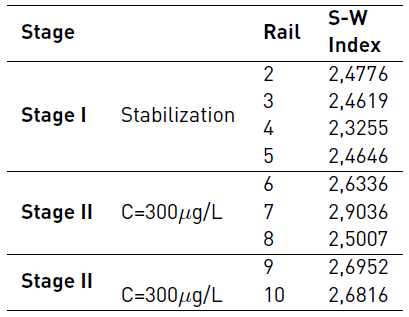
The diversity indices are expressed from mathematical formulations that take into account three components of the structure of biotic communities such as wealth, equity and abundance. Wealth refers to the number of taxa determined in a sample, equity represents the uniformity in the distribution of individuals in the taxa, and abundance refers to the total number of individuals counted in a sample.
The numerical results of the Shannon-Weaver Index indicate that the MePB did not have a significant effect on aerobic sludge diversity as the pollutant load increased. On the contrary, an increase in diversity is observed for the stages when it is in contact with the MePB.
The percentage of similarity shown in Figure 6 between all the samples of the experiment was 48%. This indicates a high variation between the first stabilization samples, and the last samples that are in contact with the MePB. However, considering the results of the Shannon-Weaver Diversity Index, the conditions of diversity over time were not disadvantaged. It is probably that the microbial populations that interact in the process are adapted, and those that are not are replaced by others that tolerate the conditions of the contaminant.
4. Conclusions
The SBR system is considered a functional technology for the removal of MePB and organic matter through aerobic biological activity, achieving removal efficiencies greater than 95% under optimal conditions.
Aerobic sludge is characterized by having a high richness and diversity of microorganisms. With the incorporation of MePB in biological environments, changes occur in microbial populations. However, diversity persists during the contact time at concentrations of 300 and 600 μgMePB/L, and the removal efficiency is not significantly affected.
The design conditions of a treatment system are established in stationary periods. An optimum sludge age must be maintained to reach high efficiencies. However, the dynamic behavior of microbial populations over time must be considered.

