


 English (pdf)
 Article in xml format
 Article references
 Send this article by e-mail
 Cited by SciELO
  Cited by Google
  Similars in
SciELO
Similars in
SciELO  Similars in Google
 Permalink
1.Introduction
Cities have advanced towards a new approach known as Smart City (SC), which must evolve towards new intelligent infrastructures, which will integrate new sensors and advanced communications [1]. These new SCs need to solve existing problems in transport, energy, energy efficiency, integration of renewables, mobility, citizenship, etc. [2]. The integration of high shares of Variable Renewable Energy (VRE) into energy systems requires the modification of policies, standards, and market and regulatory frameworks to effectively control the benefits that can be derived from renewables, while ensuring system reliability and security of supply [3].
Energy efficiency is key and fundamental in the SC. The population increase in cities means that the demand for energy is soaring, so it is necessary to achieve the same with fewer resources [4]. The improvement of the energy efficiency is fundamental in many areas of the SC, for example: lighting [5], actuators, electric motors of hydraulic pumps, electric motors of the industry, heating, elements of distributed generation, smart metering [6], etc.
The transformation of energy systems due to the increased deployment of renewable energy is occurring mostly in the electricity sector, where many countries have seen significant growth in deployment driven by the rapid decline in solar photovoltaic (PV) and wind power costs [3]. PV numbers during the last years show an undeniable landmark in renewable energies. The world added more capacity from solar PV than from any other type of power generating technology, and more solar PV was installed than the net capacity additions of fossil fuels and nuclear power combined, about 98 GW of solar PV capacity was installed both on and off the grid, accumulating 402 GW worldwide at the end of 2017 [3]. Sunlight based solar generators have been utilized as a part of the small-scale, low voltage levels of standalone systems and also in greatest-power establishments associated into network manner and working at any level of voltage in smart cities [7]. Some examples of building integrated PV systems are presented in Figure 1.
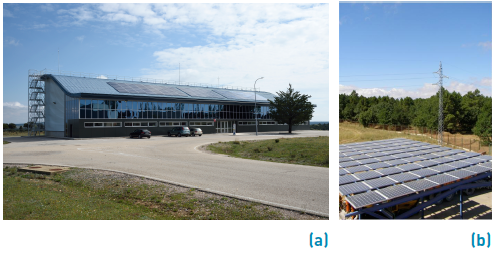
Figure 1 PV system in the offices’ rooftop (a) and in the parking area (b) of CEDER in Lubia (Soria, Spain). Image courtesy of: CEDER
However, regarding energy efficiency, the little transformation productivity is one of the issues the PV faces [7]. This transformation is not more than 20% for crystalline-based solar cell, reaching 30% in new exploratory cells. Additionally, PV configurations show nonuniform current versus voltage (I-V), and power versus voltage (P-V) characteristics [8-10], which affect the efficiency of modules and minimize their reliability. Being able to detect, to identify and to quantify the severity of defects that appear within a module or a string is essential to constitute a reliable, efficient and safety system. In this way, it would be possible to avoid energy losses, mismatches and safety issues, especially in case of building integrated systems (in roofs or façades), as overheated anomalies could generate a fire risk [11] or an electrical hazard [12].
Usually, faulty modules or cells within a PV plant have been located by applying electrical tests to the modules like the I-V curve test, manual electroluminescence and/or manual thermography, which are costly and time-consuming techniques. Furthermore, applying these practices for building integrated PV systems supposes an important risk. For this reason, newer inspection techniques are being developed, with the objectives of reducing human risks, easily implementing them and decreasing examination time in large installations, as aerial thermographic inspections using Unmanned Aerial Vehicles (UAVs) [13]. In these inspections, an enormous amount of thermal images is generated, in contrast to manual inspections in which the thermographer in charge of performing the inspection filters the information taking images only to the defects seen onsite. Therefore, specific research is being developed during the last months with the objective of automatically post processing the aerial thermal images, based on the knowledge of PV modules failure patterns. Aghaei et al. designed an alghorithm to perform thermal images analysis with the objective of determining specific defects and degradation percentage [14]. Dotenco et al. propose an approach for automatic detection and analysis of photovoltaic modules in aerial infrared images, firstly detecting the individual modules in infrared images, and then using statistical tests to detect the defective modules [15]. Tsanakas et al. propose two different techniques for advanced inspection mapping of PV plants; aerial triangulation and terrestrial georeferencing, using data obtained by aerial thermography [16].
The main objective of this paper is to perform an in depth onsite study of the modules defects of a PV plant, detecting every single defect manually, classifying them in different groups, studying the variance of the same kind of defect in different modules and the patterns of each group of thermal defects that can be used to develop a software to automatically detect if a module has an anomaly and its classification. The thermographic analysis for the identification of defects in this research is performed manually, as the spatial resolution of the thermographic images is higher than using UAVs [17]. Although new onboard thermographic cameras have first-rate resolution values, the fact is that the distance from the camera to the PV modules during the inspection is higher than during the manual inspection, thus reducing the final images resolution. A 3 MW PV plant has been chosen with the aim of gathering larger amount of data and different cases in comparison with the information which would be available in a small installation in the rooftop of a building. However, the results are perfectly extended for their subsequent application in aerial thermographic inspections and in small scale installations in roofs or façades of buildings, as same defects have to be identified in all PV inspections.
The present paper is an extension of the research presented in the Iberoamerican Congress of Smart Cities (ICSC-CITIES 2018) [18]. It is structured in four sections, starting with the introduction to the subject that shows the importance of the integration of reliable PV systems in SC and the objectives of the study, followed by the methodology, in which the tests performed and equipment used are analyzed, afterwards the results and discussion section presents the results obtained from the field inspection and the analysis of each PV module failure mode identified and finalizing with the main conclusions obtained.
2.Thermography of PV plants: related work and theoretical review
Today, hot spots’ detection methods are very varied and detection and effective diagnosis of PV faults is a challenge, specially considering large-scale PV plants. The main objective of investors is to maximize production and in order to achieve that, it is necessary to reduce, isolate or remove any source that reduces the production. This is the reason why research on faulty PV cells characterization is becoming more important during last years, aiming to increase PV plants reliability. Conventional plant inspections were based on the electrical chararacterization of modules. For example, in [19], they use I-V techniques for the early detection of hot spots, based on the cell production and climatic information. Other authors [20] use the impedance method for the detection of cell hot spots. I-V curves to arrays allow detecting the occurrence of defects such as cracks in operation, with the limitation of not determining the area and location distribution of cracks. The physical location of this fault can be identified only by performing further, individual electrical measurements to each module which is not a feasible or acceptable practice by PV plant operators [21]. Electroluminescence (EL) provides really valuable information about active and inactive areas within a module Thermography technique is simpler to implement, but the accuracy of the information is lower than with the EL technique, and does not allow the measurement of broken part areas in solar cells [22]. Advances in both EL and thermographic cameras allow the detection of the exact location of faults with high accuracy at affordable costs [13, 21]. However, EL requires connecting the modules to a power source, involving the use of very large power supply, which complicates the inspection of a whole site, especially in building integration for the power source logistics. On the other hand, thernography appears more suitable to overcome the aforementioned limitations with a high potential for fault diagnosis, especially in large installations, in which aerial thermographic inspections using UAVs is becoming a feasible fault detection solution. More details about aerial thermography equipment and procedure can be found in [13]. IR thermography was proved an effective and reliable tool for diagnosis of occurring and propagating defects, particularly revealing the existence of hot cells, hotspots on the busbars, and optical degradation in the form of colder bubbles (delamination) [21]. Classifying, characterizing and analyzing different faults is essential for assessing their behaviour and influence to the output generation, as well as for the scheduling of maintenance tasks.
2.1 Cell hotspots
Hotspots in cells can appear as a consequence of different failure modes. According to [23], hot cells usually appear due to breakage of front glazing, internal cell problems and external shading. Breakages of the front glass can be caused by heavy impacts such as hail or other extreme mechanical stress onto the module frame, causing the front glass of the PV module to be damaged and often creating broken hot cells in the damaged PV module. Cells with internal problems appear due to failures in the cell and module manufacturing process, as inaccurate cell sorting, local short circuits within the solar cell or insufficient electrical contact [23]. Cell cracks can also appear in crystalline silicon PV modules during their transportation from the factory to their place of installation, their installation itself, and subsequently to exposure to repeated climatic events such as snow loads, hailstorms or strong wind blows [22], which can derivate on disconnection of some parts of the cell, reducing the output generated and forcing the rest of the cell, being sometimes responsible of the appearance of a cell hotspot. Although the crack part is not totally disconnected, the series resistance across the crack varies as a function of the distance between the cell parts. PV modules may show several cracked cells. A cell crack classification is proposed in [24], grouping the cracks detected in the inspection of 574 PV modules in eight different groups, and the mean frequency of each type of crack proposed in [24] is calculated in [22]: no crack, dendritic crack (2%), several directions (24%), +45º (16%), -45º (16%), parallel to busbar (17%), perpendicular to busbar (5%) and cross crack (20%). In total, in this research it was found that 4.1% of the solar cells in the PV modules show at least one crack [24]. Finally, PV modules present similar patterns than the previous cases when they are affected by shading, as bird dropings, vegetation or buildings. In these cases, the entire generating capacity of all the unshaded cells in the string cells is dissipated in the shaded cell [23], reducing the production and creating different local Maximum Power Points (MPPs) in the I-V curve [10].
2.2 Bypass circuit
Configuration of cells within the module, and these in the overall photovoltaic generator is critical. Authors in [25] present a simulation work, with alternative solutions, and they demonstrate the improvement of efficiency of some models over others. Over heated cells should be avoided, and the main used strategy leads on the use of bypass diodes protecting a series of cells. Usual commercial modules are constituted of three 20-cell or 24-cell double strings connected in series. Each double string is connected in parallel to a bypass diode, which bypasses the current of a severely damaged string. Hence, power output of a module is differently affected if broken cells are located on the same string or on different strings, as described in [10, 22]. Bypass diodes do not avoid the hot spot, but they limit the power dissipation. Recent research is focused on the improvement of the bypass circuit to reduce or even suppress the power dissipation in the affected cell [26, 27]. This can be achived by introducing a series switch for breaking the circuit that is activated when a hotspot condition is detected (for example a shadow), cancelling the current. A bypass circuit is able to completely suppress the current flowing into the reverse biased solar cell, using a series MOSFET that cancel the current preventing the warming in the junction box as well [28].
2.3 Junction box
The PV junction box is a pre-installed attachment on the module where the PV strings are electrically connected and allows an easy interconnection between modules. It is attached to the backside of the module with silicon adhesive.
The main function of the bypass diodes present in the junction box is to keep power flowing in the desired direction and prevent it from feeding back to the panels when there is no sunshine, avoiding the effects caused by hot spots, mismatches and shading, which can adversely affect the performance of PV modules. In a situation close to the short circuit, it would cause the shaded cell to dissipate a high power, equal to that generated by the rest of cells, heating and producing the phenomenon of the hot spot. In order to avoid a power dissipation that could raise the temperature to the point of deterioration of the cell, it is necessary to insert bypass diodes in parallel with a branch of cells connected in series. In case of using bypass diodes, the less resistance to the flow of current in case of hot spot of shading is offered by the diode and not the cell which is a polarized diode inversely.
There are two different junction box production techniques, soldering/potting the foils coming from the panel to the diodes and clamping, which is a simpler mechanism that does not produce fumes nor needs any material inside the junction box for allowing heat transfer.
2.4 Connection
Another large field of research is the one concerning the design and topology of the connection between cells and connection box. The authors in [29] show the latest advances in simulation and implementation in this subject.
A busbar is a strip of platted copper that conducts electricity within a module. The size of the busbar determines the maximum amount of current that can be safely carried. Busbars can have a cross sectional area of as little 0.8 mm2 approximately in PV modules. The thicker bus ribbon is soldered so that it connects to the tabbing ribbon (fingers or cell interconnect ribbons) of each solar cell cluster. The tabbing ribbon collects electric current within its cluster of solar cells and delivers it to the bus ribbon (or bus wires or string interconnect ribbon) and then the bus ribbon conducts the cumulative electric power from all of the solar cell clusters to a junction box for final output. Bus ribbon is larger in cross section because it has more electrical power to carry. The width range of these ribbons goes from 3 to 6 mm, with a thickness range from 0.1 to 0.4 mm [30].
The influence of structural defects on ribbons has been studied from long ago. By 1981, the influence of defects in laser crystallized silicon ribbons was analyzed [31], categorizing defects into two groups, surface defects associate with turbulence effects and bulk defects as dislocations and stacking faults. Disconnected cells and broken or degraded string interconnect ribbons are classified in [21] as electrical mismatches, detailing that they can be generated as a result of physical stresses during transportation or installation, thermal cycling and consequent thermomechanical stresses, poor soldering and/or hot spots during long-term operation of a PV system in the field.
2.5 Module
The interconnection of photovoltaic modules for the shaping of the photovoltaic generator is of great interest. For example, [32] show that the serial or parallel configuration directly affects the loss of efficiency in photovoltaic production. In photovoltaic modules, only a small portion of irradiation is converted to electricity. The rest is converted into heat, which overheat modules reducing performance. Authors in [33] study how solar cell temperature, irradiation intensity, cooling fluid mass flow rate, humidity, and dust affect PV-module performance, quantifying how the efficiency of the solar cell decreases when cell temperature increases. The correlation between mismatching and aging is studied in [34], showing that a closed-loop link exists between aging and mismatching since aging causes mismatching among cells, whereas mismatching, in turn, mainly due to its thermal effects, leads to nonuniform aging. Delamination is one of the principles that causes of failures in photovoltaic modules, and it is a consequence of stress. When the PV panel is exposed to sunlight, the temperature distribution redistributes the residual stress. The themal stress in photovoltaic modules is anlysed in [35], determining its nature and magnitude. Overheating in modules is typically determined by thermal inspections, however, additional methods can be used for its detection. For instance, authors in [36] present an assessment of temperature approach based on the module current waveform, justifying how particular changes on the current caused by overheating may be processed and correlated with a certain temperature.
3.Methodology
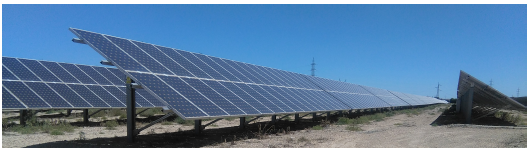
The PV site that has been analyzed is located in Spain, in Castilla y León region and it has a capacity of 3 MW, with 17,142 monocrystalline modules, model STREAM 175 W, and was commissioned in 2008. Each PV structure is composed of thirty-two modules, divided electrically in two arrays of sixteen modules, which are connected in parallel in the combiner box. PV structures have fixed 30º tilt structure and a general view of them can be seen in Figure 2. Each module has 72 cells (12x6).
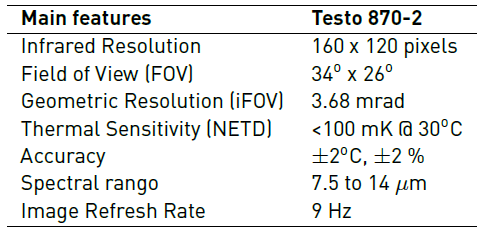
The thermographic inspection has been performed using the traditional manual thermography method, walking all around the PV site inspecting each module with the thermographic camera. The manual camera used was a Testo 870 [Table 1]. It is a precalibrated camera, in which a coded calibration data set is stored, but it should be recalibrated (on a yearly basis, as it is usual in this kind of cameras) by the manufacturer due to the possible degradation of the detector [37]. In this case, the camera has been just acquired to the manufacturer previous to the tests, so it was just calibrated. The manual camera used captures visual RGB images simultaneously to thermographic images, allowing certifying the detected failures during the post-processing steps and avoiding false positives. However, the presence of false positives is less significant in case of manual inspection, as specialists performing inspections on site can check the presence of shadows or dirt in modules during the inspection.
The site inspection performed in this research has been carried out by two specialists. Every single failure detected during the inspection regardless of its temperature, was registered, identified and reported. The time needed to complete this inspection has been 34 working days; subsequently, to post process and to analyze the results 26 working days. The defects have been analyzed using the thermographic camera software, IRSoft, obtaining the relative temperature of the defect, the mean temperature of the healthy area and the difference between them, which indicated the overheat of the fault.
4. Results and discussion
This section presents the results obtained from the field inspection and a review and discussion of each PV module failure mode identified, detailing different possible causes and analyzing each group in detail.
From the 17,142 modules thermographically inspected, the number of detected modules with some failure has been 1,140, which corresponds to a 6.65%. According to some recent research, it is predicted that 2% of the PV modules do not meet the manufacturer’s warranty after 11-12 years of operation [38]. The percentage of failures detected is over this rate because every single anomaly has been reported in this study, independently of the temperature difference between the overheated area and the healthy part. This means that not all the thermographic failures identified in this research will have enough impact not to meet the manufacturer’s warranty, but authors have considered relevant to report every single defect as all of them could derivate in a relevant failure with the degradation and time. However, according to [23], due to normal tolerances in cell sorting and module production, thermal abnormalities of less than 10 % of the recorded modules do not indicate a special quality issue regarding the used modules. Higher modules failure rates should be evaluated.
These hot spots can be caused in the cells, but they can also appear in other elements, such as in the bypass diodes [39]. Attending the results obtained, all these faults detected have been classified in five different thermographic defects modes: hotspot in a cell or in a group of cells, bypass circuit overheated, hotspot in the junction box, hotspot in the connection of the busbar to the junction box and whole module overheated. The distribution of defects among these five groups can be observed in Table 2.
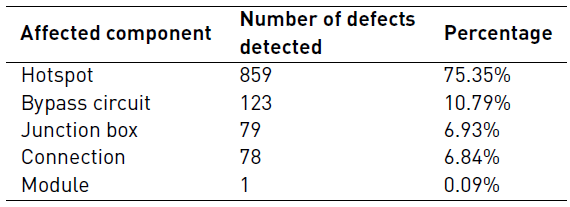
As it can be seen in Table 2, more than three quarters of the affected modules correspond to cell hotspots, presenting one or more cells overheated, followed by the bypass circuit overheated with more than a 10%, the junction box and connection hotspot, with more than a 6% and the whole module overheated, with only one defect of this type identified in the PV plant inspection. This prevailing number of hotspot failures in cells with respect to the rest of failures types is not an isolated case. Statistically, there are a greater amount of cells, 72 cells per module in this case, than of the rest of components, three bypass circuits, one junction box, four bus ribbons connection to the junction box and one module.
Additionally, there are a large number of causes responsible of the occurrence of cell hotspots, as cell cracks, snail trails, potential induced degradation (PID) or delamination [38]. Although some of the defects are slightly visible to the human eye, as snail trails, most of them are undetectable without the use of a thermographic camera [23]. Additionally, other defects within the PV module can be the result of a cell failure. For instance, a diode fault can be caused by a hotspot in a string of cells that forces the continuous operation of the diode, overheating it. Therefore, a correct characterization of this kind of failures is essential for a proper automatic detection of cell hotspot supported by software, as it represents more than three quarters of the defects.
The severity of each specific defect, its influence in the production or the risk of fire or electrical hazard danger should be individually analyzed with the objective of determining the action which may be appropriate in each case. In relation with the costs of arrangement of each defect, goes from a diode cost in case there is a broken diode in the junction box to the whole module cost in the rest of cases, as it would be more expensive sending the module to a specialized laboratory to replace some cells or the busbar, considering that the EVA encapsulant and the rest of module layers would have to be removed and replaced. Commonly, the severity of defects is given, based on the difference of temperature between overheated and healthy areas, ΔT, within a module. The absolute temperature of the defect is not used to determine the severity as it is strongly dependent on different weather conditions, as the ambient temperature, the irradiance or the wind speed. While higher values of ambient temperature and/or irradiance increase the temperature of modules, higher wind speed values refrigerate the surface and decrease its temperature. Therefore, the difference of temperature between two parts of the module, which are equally affected by the surrounding conditions, is used to determine the harshness of the defect. This ΔT varies significantly between different kinds of defects, as it can be observed in Figure 3, which presents a box chart showing the diference of temperature for each of the 1,140 defective modules detected, grouped by defect type. Throughout each of the parts of this section, delta temperature statistical results are included, as mean temperature, standard deviation, maximum temperature, median and first and third quartile. Although the default measure of centrality is the mean temperature, it has been also introduced the median. This is because when the distribution is skewed or is not symmetrically distributed, presenting outliers, the median can better match to the intuitive meaning of middle, as it is the point that minimizes the distance from it to any of the other points in the dataset. Additionally, the knowledge of the median and the quartiles for each of the defects can be useful to classify the severity of a new defect attending to four ranges defined by these values, as these statistical indicators split the data up into four equal-size groups.
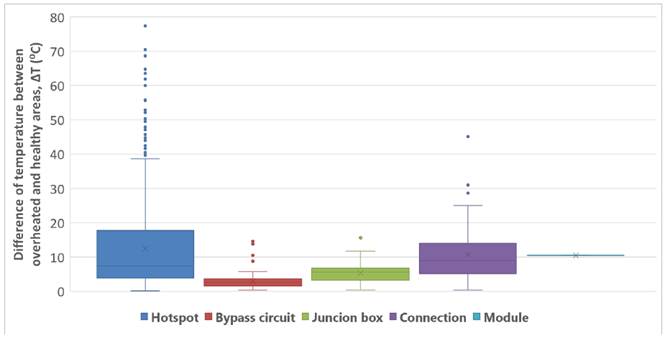
Figure 3 Box chart showing the difference of temperature between overheated and healthy areas, ΔT, grouped by defect type for each of the 1,140 defective modules detected
In this paper, three different comon ranges of temperature for all defects types have been defined attending the severity of the anomalies for manual thermal inspection proposed in [17]. Differences higher than 30°C are considered as severe failures, from 10°C to 30°C are considered as medium severity failures, and lower than 10°C as minor failures. According to [23], temperature gradients lower than 10°C are normally considered as unproblematic and do not have to be listed separately. Temperature gradients from 10°C to 20°C are unproblematic in the current stage, although they have to be reported and observed in subsequent regular thermal inspections as they can increase during the operation of the PV power plant [23]. Differences of temperature above 20°C are expected to cause degradations of panel output and eventually, the material compound may even degrade, resulting in a safety issue. Table 3 summarizes the severity of all defects detected, grouped by defect type or affected component.
Based on the results obtained in the tests performed, hotspot is the defect type that shows higher temperature differences, achieving up to 77.4ºC between the overheated hotspot and the healty area in one of the tested modules. The second type of defect that presents higher ΔT is the connection, reaching 45.1ºC. These two kinds of defects have some similarities. The defect area and consequently the overheated area are small, so the heat is concentrated in a smaller area. Hotspots typically appear in just one cell and the connection defects in a small busbar point. Additionally, these two kinds of defects are revealed in the front part of the module, so the thermographic camera captures direcly this temperature during a regular inspection, in which the front temperature of PV modules is revised. Some plant operators sometimes perform, in addition to the front thermography of modules, an extended analysis of the back temperature of the defective modules observed in the front inspection. Nevertheless, this is not viable during aerial thermography inspections, as it is not safe that unmaned aerial vehicles (UAVs) fly at this small altitude. Therefore, in this case it would be necessary to do the post processing of the images taken during the flight and afterwards, going back to the defective modules with a manual thermal camera. However, this is not an appropriated solution, as the ambient conditions would have changed during the analysis days and the back manual thermography will not be comparable with the front aerial thermography. Additionally, performing manual thermography in the back of modules is not an easy task, due to the PV structures’ tilt and to the structure posts, which covers part of the module. The angle in which the thermal images are taken will be distant from the recommended perpendicular angle and it will be difficult to capture the modules of the lower part of the PV structure, as they are not easily accessible. Following with the analysis of Figure 3, the third and fourth kinds of anomalies with higher ΔT detected have been the junction box and bypass circuit defects, which present a similar range of ΔT between them, with maximum ΔT captured of 15.6ºC and 15.1ºC respectively. Junction boxes are in the back part of the module, which justifies that the ΔT temperature captured from the front is smaller, as it is just measured the heat transfer that comes from the back. However, real temperature values achieved by the diodes in the junction box can be much higher than the temperature values expressed for this case in Figure 3. It will be more accurate measuring this kind of defect from the back, but it presents the inconveniences previously detailed. On the other hand, bypass circuit defects are revealed with lower temperature than other kind of faults, as the affected area in this case is larger. However, although they present less ΔT, their impact in the production and their effect on the rest of the string can be very significant, that is why typically, PV operators do not classify this kind of defect attending their temperature and just classify every defect affecting the bypass circuit as severe and their substitution is highly recommended [23]. Finally, the only module overheated identified during the tests present a temperature difference of 10.5 ºC, not representing enough sample to draw conclusions about the ΔT of this defect type. The different defects will be further analyzed in the following paragraphs.
4.1 Cell hotspots
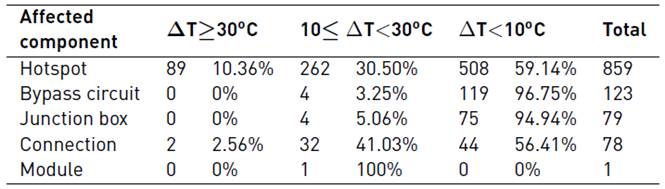
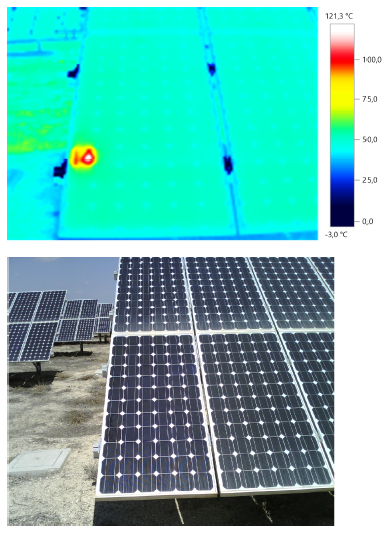
Cell hotspots, which are a serious problem in photovoltaic systems, are analyzed along these paragraphs. The following images, Figure 4, Figure 5 and Figure 6 show three examples of the 859 cell hotspots detected during the study, with a difference of temperature between the healthy area and the overheated cell of 71ºC, of 63.5ºC and of 71.2ºC, respectively. It has been noticed that optical degradation failures, understanding them as delamination, discoloration or glass breakage, which are usually perceptible with a visual inspection, are revealed as a hotspot in a thermography inspection. It is due to the modification on the optical properties of the module surface that creates a reduction on the penetrating solar irradiance, due to reflections, reducing the generated current in the faulty cell.
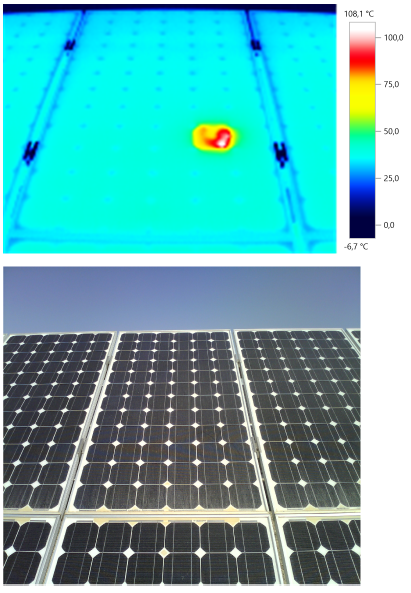
Figure 5 Two overheated cells within a module, one in the first bypass circuit and the most overheated in the second circuit, with a ΔT of 63.5ºC
Reviewing all cells hotspot defects, it has been concluded that the pattern of this fault is an overheated cell, of approximate 15 x 15 cm2 depending on the module manufacturer, located in any cell along the module. The analysis performed does not reveal any preference of appearance of the overheated cell in any of the three strings circuits. The following figure, Figure 7, presents the ΔT of each of the 859 cell hotspots detected in the inspection in descencing ΔT order, obtaining an average temperature of 12.4°C with a standard deviation on 12.8°C. Other relevant statistical values are the median, 7.4°C, and the first and third quartile, 3.8°C and 17.8°C, respectively.
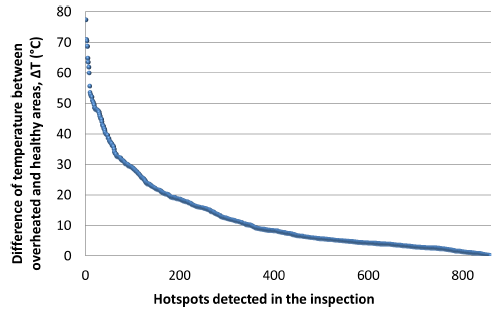
As it can be seen in Figure 7, the highest ΔT detected in the tests is 77.4°C, which supposes a cell hotspot temperature of over 130°C. Reaching high temperatures can generate a fire hazard. Authors in [39] determined that the maximum hot-spot temperature on rear surface of PV module reached to 347°C with bypass diode not turned ON condition.
4.2 Bypass circuit
The thermographic and visual image of one bypass circuit overheated with a temperature difference of 5.7ºC between the healthy area and the overheated bypass is presented in Figure 8.
In case of a full electrical isolation of a cell part in case of cracks, the current produced by the broken cell, and subsequently by all the cells connected in series with it, decreases [22]. When a cell part is fully isolated, the current decrease is proportional to the disconnected area. In this case, it will appear a step in the I-V curve that originates two different MPPs, and some of the current could be derived through the substring bypass diode when the Global MPP appeared at the high current step of the curve, which could be revealed as an overheated point in the junction box if this is forced or conducting the excess of current for a long time, or as an overheated bypass circuit in case the bypass diode could not recirculate the excess of current, as it can be seen in Figure 8. Reviewing all bypass circuit defects it has been concluded that the pattern of this fault is two mainly homogeneous overheated columns of cells, with total approximate dimensions of 180 cm x 30 cm for 72 cells modules and 150 cm x 30 cm for 60 cells modules, depending on the module manufacturer. The overheated area can be located in any of the three strings of the module. The analysis performed does not reveal any preference of appearance of the overheated string in any of the three strings circuits. The following figure, Figure 9, presents the ΔT of each of the 123 overheated bypass circuits detected in the inspection in descencing ΔT order, obtaining an average temperature of 3.0°C with a standard deviation on 2.3°C. As it can be seen in the figure, most of these defects present a ΔT under 4°C. Only 8 modules (which supposes a 6.5%) present a ΔT over 4°C and only 4 modules (3.25%) have a ΔT over 10°C. The maximum ΔT detected has been 15.1°C. Other relevant statistical values are the median, 2.6°C, and the first and third quartile, 1.7°C and 3.6°C, respectively.

Figure 9 ΔT of each bypass circuit overheated detected during the inspection in order from the highest to the lowest
As it can be seen in the figure, the maximum ΔT reached in the bypass circuit cells overheated is 15.1°C. High temperatures are avoided by using bypass diodes in the modules, as the power dissipated in the fault decreases with respect to the temperature reached in a longer series of cells. However, authors in [40] conclude that the reliability of the bypass diode function remain uncertain and it is recommended to use application of specific PV modules with custom design of bypass diodes for specific applications in which high temperatures can suppose a risk hazard, as hydrocarbon industries.
4.3 Junction box
Figure 10 shows an open module junction box in which the three bypass diodes are visible.
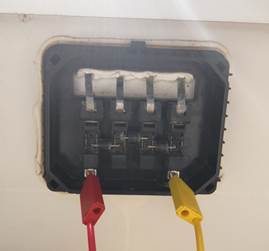
Figure 10 Module junction box open, showing conducting strips, which connect the bus ribbon to the bypass diode terminal, three bypass diodes and terminals
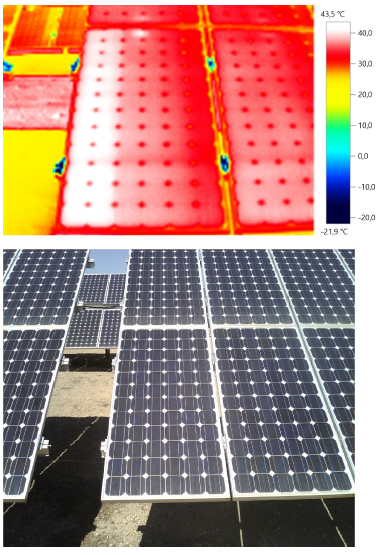
The main thermal abnormalities in that case are overheated bypass diodes, as the temperature of the diode when it is active is higher than the inactive diodes, reducing the power output of the module when the diodes are active. Two examples of overheat detected in the junction boxes are showed in Figure 11 and Figure 12 As it can be seen in the images, the defect is more pronounced in the back image than in the front, as the junction box is in the back and the difference measured in the front is only due to the heat transfer from conduction from the junction box. Therefore, to detect this kind of defects, it would be recommendable performing the inspection to the back of the modules; however, it is more complicated due to the PV structures tilt, as detailed before.
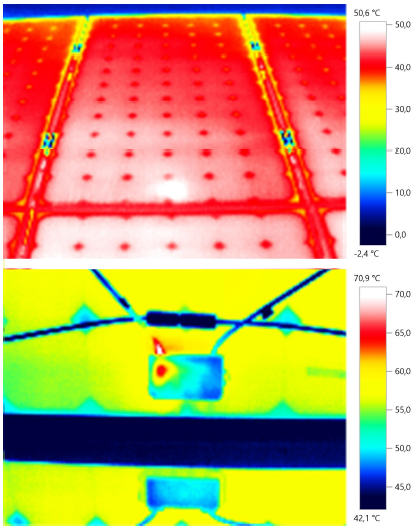
Figure 11 Front site of a module with a bypass diode overheated and of the junction box at the back of the module. ΔT is 6.7ºC and 22.6ºC respectively
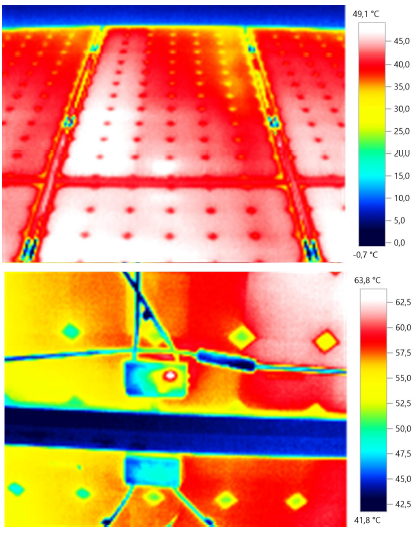
Figure 12 Front site of a module with a bypass diode overheated and of the junction box at the back of the module. ΔT is 9.3ºC and 17.2ºC respectively
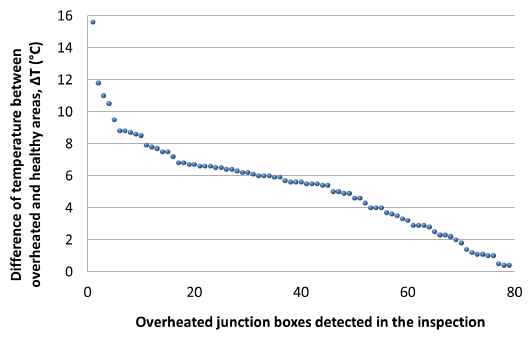
In relation with the pattern this kind of defects present, it has been shown that they are revealed as an overheated point in the middle part of the shorter side in which the box is located. This overheated point habitually appears in the middle of two different cells. In the PV plant in which the research has been performed, the modules of the upper row have the junction box underneath while the modules of the second row have the box in the upper part, as it can be seen in Figure 11 and Figure 12. The location of junction boxes along rows must be considered if a software must classify automatically the defects. The following figure, Figure 13, presents the ΔT of each of the 79 overheated junction boxes detected in the inspection in descencing ΔT order, obtaining an average temperature of 5.3°C with a standard deviation on 2.8°C. The maximum ΔT detected has been 15.6°C. Other relevant statistical values are the median, 5.6°C, and the first and third quartile, 3.3°C and 6.7°C, respectively.
4.4 Connection
An example of an overheated connection found during the analysis is introduced in Figure 14. As it can be seen, the overheated area is not in the junction box, but in the connection between bus ribbon or bus wires and the box.
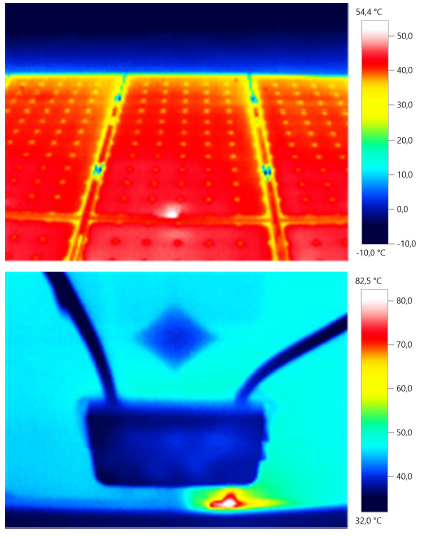
Figure 14 Overheated connection between the bus ribbon or bus wires and the junction box with a ΔT of 11.7ºC and 35.8ºC, at the front and back side respectively
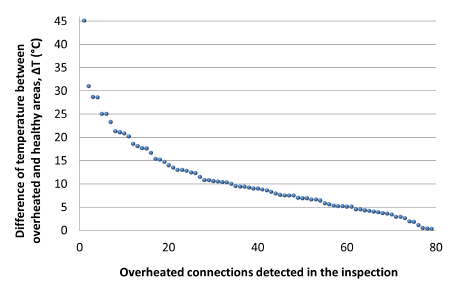
Reviewing all connection defects, it has been concluded that the pattern of this fault is an overheated point, generally smaller than a cell, located next to the frame in the same side in which the junction box is placed. The following figure, Figure 15, presents the ΔT of each of the 78 overheated connections detected in the inspection in descencing ΔT order, obtaining an average temperature of 10.9°C with a standard deviation on 8.1°C. The maximum ΔT detected in this case has been 45.1°C. Other relevant statistical values are the median, 9.0°C, and the first and third quartile, 5.2°C and 13.8°C, respectively.
4.5 Module
If one module or several modules connected in series have a higher temperature than the rest, the modules may not be connected to the system and the wiring should be checked. Figure 16 shows the only defect in the whole module detected during the site inspection.
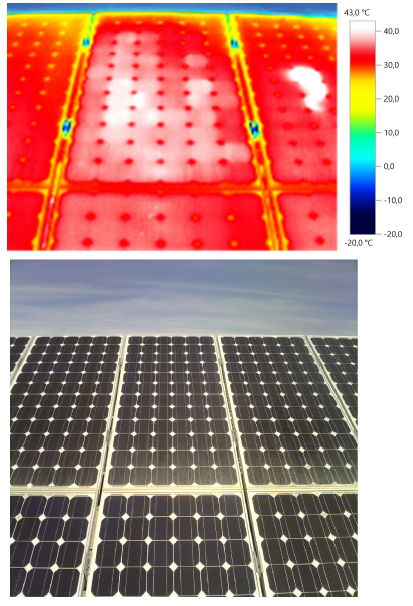
Figure 16 Overheated module with a ΔT of 10.5ºC between the mean temperature of the adjacent modules and the mean temperature of the overheated module surrounded in the figure
It has been noticed that differences in temperature between a module and the rest of modules of the same row or string could be due to an erroneous connection between them, mismatching or to internal defects of the module affecting all the bypass circuits. This kind of defect can be automatically detected as a difference of the mean temperature of one module with respect to the rest of the modules of the same PV structure.
5.Conclusions
The paper presents an onsite manual thermal analysis of 17,142 monocrystalline modules, in which every single existing defect has been detected and characterized, calculating the difference of temperature between the defect and the healthy area. All detected anomalies have been analyzed and five different groups of thermographic anomalies have been defined to classify the 1,140 defects found, studying the variance of the same kind of defect in different modules and the patterns of each group of thermal defects. Attending the results obtained, the percentage of occurrence of each of the five different thermographic defects modes have been calculated: hotspot in a cell 75.35%, bypass circuit overheated 10.79%, hotspot in the junction box 6.93%, hotspot in the connection of the busbar to the junction box 6.84% and whole module overheated 0.09%. An analysis of patterns of each of the different defects is included, studiyng location within the module, size and temperature statistical results, as average temperature, standard deviation, maximum temperature, median and first and third quartile. This study results can be useful as a base to develop the patterns of the different kind of defects in a software to automatically detect if a module has an anomaly and its classification.

