English (pdf)
 Article in xml format
 Article references
 Send this article by e-mail
 Cited by SciELO
  Cited by Google
  Similars in
SciELO
Similars in
SciELO  Similars in Google
 Permalink
1. Introduction
The compliance with the principles of the 1992 Earth Summit [1] -the international community Agenda 21-, a treatise where the goals for a sustainable future were set, is a call for each person on the planet, institution, science branch, ideology or believe. One of the possible contributions from the Acoustic field, is the development of acoustic-mechanic systems for acoustic conditioning and insulation [2]. In this paper, the research is about the design and implementation of an acoustic conditioning panel fabricated from guadua waste by-products, which evolved into a final product in [3].
In the literature, we may find several studies on the acoustic absorption of natural fibre composites. Some of them are summarized in [4], where it is stated that pretreatment of fresh natural fiber is necessary to overcome difficulties in the process, as well as the feasible ways to enhance low frequency acoustic absorption of the composites. [5] present a complete description on the acoustic absorption of natural fibres, with relevant applications as micro-perforated panels.
A recent research [6] shows the applicability of vegetal fibres for the development of solutions which can become sustainable in the social, economic and environmental sense.
In [7], the proposal of recycled materials for sound absorption is developed, due to their good acoustic behaviour, similar to traditional porous materials.
The aim of this research is to identify the acoustic characteristics of the fiber and of the guadua perforated, specifically, the absorption coefficients; it contributes significantly to the state-of-the art, since there is a lack of knowledge with respect to guadua applications in the acoustic field. Likewise, the acoustic behavior of the different acoustic absorbers made from guadua is described.
2. Experimentation
2.1 Techniques of data collection
In situ acoustic measurements were performed with the impedance tube (Kundt Tube), according to ISO 10534-2 Normative [8]. A power amplifier was used for the loudspeaker, a 31-band graphic equalizer, an audio interface, 2 measurement microphones and the software designed for data acquisition and processing. For the acoustic measurement of the perforated panel, two techniques were used, which correspond to the Reverberation Time measurement, according to ISO 3382-2 [9], and to the reflection method [10]. For these measurements, a dodecahedron loudspeaker was used, measurement microphones, a pistonphone, a sound level meter, an audio interface and a computer with the software Easera -for acoustic measurements, which performs Reverberation Time measurement and data processing in order to find the reflection coefficient.
The Easera software possesses a module which enables to calculate the reflection coefficient of a surface through measurements of the impulse response; such a method is based on the assumptions from Garai [11, 12]; the use of this method is suitable since it does not specify the amount of the material to perform the measurement, unlike other methods which require huge samples.
2.2 Procedure for the obtention of the guadua fiber
For the guadua assimilation, the alkaline method [13] was used, in order to separate the lignin bounds. Similarly, to keep the fibres separated for easier manipulation, the lignina is separated. There is a need to separate the small spaces in between the fibres and since the lignina does not allow this separation, then it is separated from the rest of the material. The solution is prepared with a 10% concentration which corresponds to 100 grams of sodium hydroxide (NaOH) per liter of water.
The guadua culmo (the false stem of the guadua) is conformed of a node and an internode. The node corresponds to the most rigid part of the guadua, difficulting the fiber extraction in this section [14]; therefore, it is decided to deal only with the internode, not only to facilitate the manipulation but because if offers more fiber in comparison to the node. Having as a goal that the fiber remains in more contact to the alkaline solution, then the internodes are cut vertically.
Based on the biologic characteristics of the guadua and of the NaOH concentration, the necessary time for the lignin separation is about 15 days; the guadua is submerged during that period. At the end of these 15 days, cuts are retired and washed abundantly with water, in order to assure that the solution used for the submersion do not keep deteriorating excessively the guadua mechanical properties. Afterwards, the fibers are obtained through a tool which facilitate the brushing of each section. Finally, the fiber is dried for about 3 or 4 days. This alkaline treatment is applied to the guadua fibres which further will become part of the guadua perforated panel.
2.3 Test tube assembly for the measurement of acoustic absorption
Tests for the impedance tube
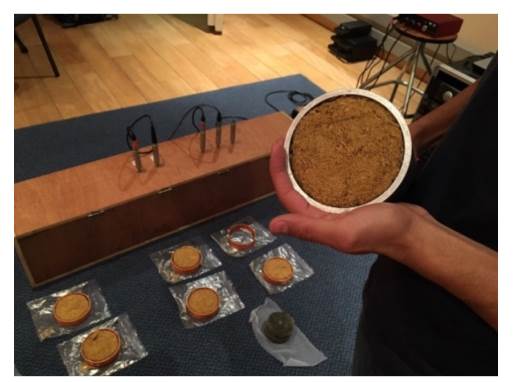
For the elaboration of the test-tubes, a digital analytical balance with 0.01 accuracy and 2,000 g max. range was used. This is an instrument that enables to set the precise amount of guadua necessary for the sample production; as a reference parameter was chosen an equivalence in weight of a material sample from a commercial absorption product, as the acustifibra, which corresponds to 20.5 g, guarantying equivalent densities among samples. For more precise results, 12 test tubes were created. The acustifibra is a conventional material used in the acoustic treatment of rooms.
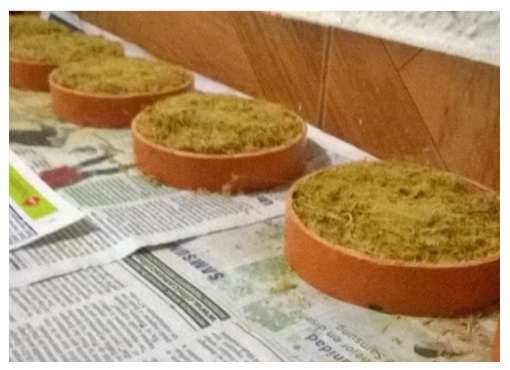
In order to cover, in an effective manner, the whole area of the sample holder of the impedance tube [Figure 1], it is necessary to use a mold that gives shape and consistency to the fiber, elaborated in a 10,16 cm PVC pipe (equivalent diameter of the impedance tube). In order to give the desired thickness, 2.54 cm sections are cut. Finally, sample compaction of fiber by pressing to conform test specimens was performed through wood pieces sealing the mold, and on top of them, 2 Kg weights were placed during 7 days [Figure 2].
Test tube for filling the perforated panel
For the immersion of the guadua fiber into the perforated panel, it is necessary to delimitate the amount of guadua that is required for having the same fiber density in the test tubes used for the acoustic absorption measurement with the impedance tube.
To achieve this, it is necessary to know the area which is to be filled, which is 100 cm 2, and it must have 1 inch thickness. Each test specimen has 20.5 g of fiber, where the radius r of each test tube is equal to 5cm; giving us an area value per test tube of 7,854 x 10-3 cm 2.
The knowledge of the test-tube area enables us to calculate the amount of test-tubes required for filling up 1m 2. The ratio of the area-to-fill with respect to a test-tube value, which is represented by No is deduced, as expressed by Equation (1):
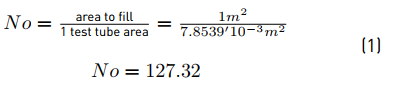
This indicates that the necessary amount of test tubes to cover 1m2 is equal to 127.32 test tubes, therefore to know the required fiber to fill the panel, the number of samples is multiplied by their unitary weight, giving as a result 2.6 Kg of fiber.
After obtaining the required amount of fiber for the elaboration of the filling material, fiber molding is performed to guarantee its uniform and compact placement into the internal area of the panel. For this, a wood frame was constructed with the inner panel dimensions, where the guadua fiber was placed. Afterwards, the frame is covered with an invisible acoustic veil, in order to facilitate the guadua fiber manipulation. For determining the effect of the use of the veil with regards to the guadua fiber absorption, measurements were performed in the impedance tube with and without the veil.
2.4 Design of the perforated panel based on guadua
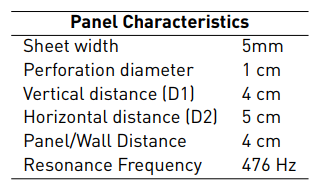
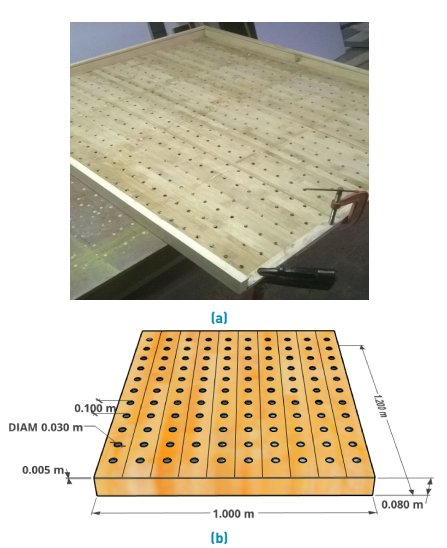
A perforated panel was designed with an objective frequency of 500 Hz, thus energy attenuation is at low frequencies. The guadua sheet that was used for the construction of the acoustic panel has a thickness D = 0.5 cm, and a surface of 1m x 1.2m.
Resonant frequency fo of the perforated panel and the other mentioned variables and distances are related. When the distance between holes and/or distance to the rigid wall increases, then fo decreases. If the radius of the holes increases, then fo also. The values of the resonant frequency and the sheet thickness have been fixed; for the determination of the leftover panel measures, an error and trial procedure is adopted. Afterwards, panel perforations are done with drill, so available broach sizes in the market are taking into account. Table 1 summarizes panel dimensions. From the experimentation with different variables, the most optimal dimensions for the panel design have a resonant frequency of 476 Hz.
2.5 Construction of the Perforated Panel based on Guadua
For the construction of the perforated panel, 10 tables of guadua were used, which were pressed to obtain a final laminate of 1.2 m length by 1 m width, with a thickness oscillating between 0.3 cm and 0.6 cm, obtaining an average thickness of 0.5 cm. It is worthy to clarify that a series of tables with the same dimensions is cumbersome to obtain, therefore the absorption coefficient will be affected because of the irregularities of the plate. The obtained sheet was placed onto a MDF wood structure as can be seen in Figure 3, and afterwards the opening of the perforations followed, corresponding to the chosen design. Consequently, a sealing system of the air cavity was implemented, through a triplex wood sheet, which is removable, facilitating the change of the filling material composed of guadua fibers. Finally, the panel was revised once again, in order to seal any hole that does not belong to the original system.
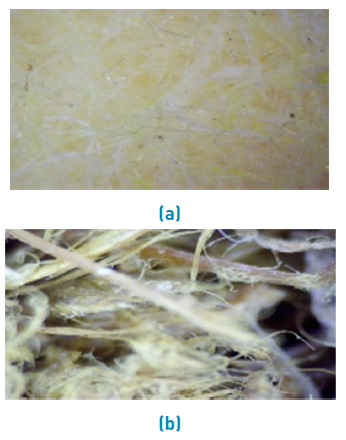
In this research, a comparison between the performances of panels made of acustifibra (fiber-glass) and guadua is made. In the Figure 4, taken with an electronic microscope, the structural differences between them can be seen. When the inner structure of the fiber is dense, then the inner paths which are generated inside the fiber are smaller, which blocks air flux movement, generating dissipation, increasing material temperature.
2.6 Description of the impedance tubes according to ISO 10534-2
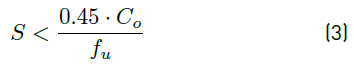
The ISO 10534-2 [8] defines that the distance between the sound source and the microphones has to be, at least three, times the tube diameter. This fact, guarantees the generation of plane waves at its interior. Both the diameter and the distance between the microphones determine the frequency range over which the measurements are performed; the upper frequency fu is mediated by the tube diameter (as Equation (2) expresses), suggesting through Equation (3), the minimal distance of microphone separation.
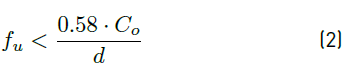
Where d is the tube diameter and Co is the sound propagation velocity in air.
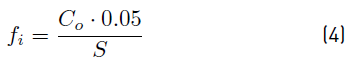
Where, S is the distance between microphones, which delimits the inferior frequency fi, S being the 5% of fi (Equation (4)].
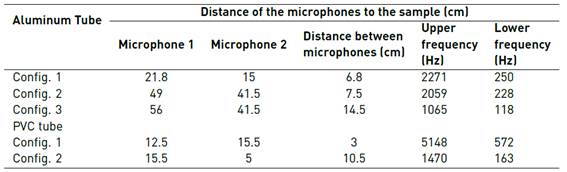
Two impedance tubes were used with different microphone configurations and lengths; the first tube has these characteristics: smooth tube in aluminum, 1 m long, with a 10.16 cm internal diameter, and a 5 mm thickness. The second one is a 60.5 cm PVC tube, with 10.16 cm in internal diameter and a 5 mm thickness. The configurations in each of the tubes are shown in Table 2.
According to the Normative, in order to check the operation frequency range, there is a need to assure the dependence upon the tube material. Also, the verification of the background noise is done with the wider tube (aluminium material).
2.7 Software development
With the aim to optimize the measurement process of the absorption coefficient, a programming code based on Python software was developed. The program has different graphic interfaces, which enable the user to select the capture and playback devices, to input the impedance tube parameters and finally, it concludes with the measurements visualization. A detailed description of the program is followed.
In the main interface of the measurement software, the real-time spectrum visualization may be found; at the same time, in this interface, the measurements of the absorption coefficient may be implemented; however, to make use of this variable, it is necessary to configure the software for recognizing the audio input and output.
After calibration is performed, some parameters may be modified, such as input device, sample frequency, bit depth and buffer size: these parameters have been selected according to conventional values used in audio. In the same manner, such an interface counts with a VU meter in dBFS (decibels Full Scale), for microphone calibration.
Microphone calibration is performed with the aim that the captured signals are in the same level in both channels, diminishing the errors in the measurement. It is performed through the microphone excitation at 94 dB SPL at 1 kHz. Both audio channels need to be calibrated.
Once the calibration process is finalized, the output device is configured: this is done with the toolbar menu and selecting the route “Options > Signal generator”, opening the interface of the signal generator, through which the output device may be chosen. The signal type, its duration, level and frequency range can also be selected. Among the available signal types, we may find pink noise, and logarithmical sinusoidal sweep; in the case of the sweep, the program generates 3 sweeps in the overall selected duration. This duration is the capture time for the measurement.
Once configured the input/output device, the main interface can be used. It has, as essential characteristics, the FFT in real-time, level in 1/3 octave band and SPL level (Sound Pressure Level) of each channel. In the same manner, this interface enables to activate or deactivate the audio capture/playback. It is also possible to modify the output level of the signal generator.
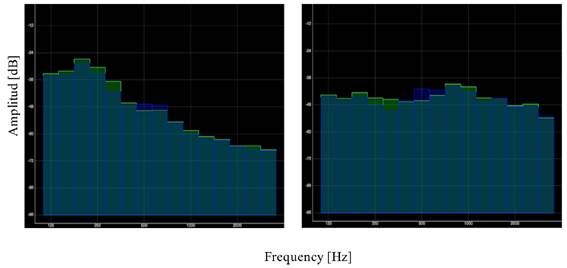
With the aim of optimizing the Frequency Response of the system, loudspeaker equalization is suggested; for this, a test-tube is required to be set with high values of absorption in the sample holder.
A pink noise is generated and through the 1/3 octave visualization and a graphic equalizer, the frequency response is adjusted, so to have a plane frequency behavior as Figure 5 describes.
After loudspeaker equalization, post-processing of captured audio is performed. For this purpose, the necessary data are entered for the calculation of the absorption coefficient and the type of measurement to perform. This, in order to enable the correct saving of the measurements; these data are entered in the toolbar, following the route “File > Input Data”. In the interface of data input, various parameters are entered, such as temperature, air density, tube diameter and distance between microphones with relation to the sample. Also, there is a need to select the type of measurement that will be performed (Calibration Factor or interplaced microphones), with the aim that the program stores the audio files with the proper nomenclature. Afterwards, the route for storage will be selected.
Once, the data are entered, measurements are followed. For doing this, it is necessary to take into account the correct positioning of the microphones according to the type of measurement to perform; pressing the button “Set Values”, the program generates automatically the audio and will start the capture, while in the inferior part of the interface, the measurement state can be observed. When the program has the necessary measurements for the absorption coefficient calculations, in the toolbar, with the route “Measurements”, tabs are generated for the results interface of each one. If the audio is available with the proper nomenclature, then these files may be open through the route “File>Open”.
Finally, while selecting each of the measurements, the results interface will be opened. Selecting each one of the measurements, the results interface will be opened for each one of them. In this figure, the data visualization of the absorption coefficient will be visualized, as well as the reflection coefficient and acoustic impedance.
2.8 Measurement Procedure
Impedance tube
For the measurement procedure, two (2) microphones for data acquisition are needed, and two (2) measurement techniques for correction of level difference and phase difference between microphones are performed. Such techniques were implemented in the measurement of the absorption coefficient in this research and they will be described afterwards.
Preliminary, a loudspeaker must be put into function, during at least 10 minutes, in order to stabilize the temperature inside the tube. Microphones calibration is required and finally, the adjustment of the loudspeaker Frequency Response through a graphic equalizer. The signal level at the measurement should be 10 dB greater than the background noise at the interests´ bands.
For the measurements, two impedances tubes were used. The main difference between these tubes are the distances between the available cavities for the microphones. These options enhance the bandwidth over which the measurements are made.
Interchanged microphones technique
This procedure requires two sample captures; it is usually used when it counts with a limited number of samples. Figure 6 presents a diagram of the standard assembly of the impedance tube, where all the cavities for the microphones are placed. The first channel must be in the cavity that is the furthest from the sample and the second is closest to it.
Once, the microphones have been calibrated, and the source properly equalized, the test-sample is inserted into the sample-holder. First capture is performed. With this capture, the HI 12 will be obtained.
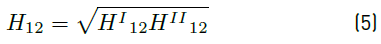
HI 12 is the Transfer Function obtained with the standard microphone positioning. Afterwards, the microphones positions will be interchanged and a new capture will be performed, acquiring in this manner, the transfer function HII 12. With Equation 5 and the captures performed previously, the corrected Transfer Function H12 will be obtained, by which the reflection coefficient will be calculated.
Calibration factor technique
This technique uses a calibration sample, which is made from a highly absorbent material, with the aim to minimize reflections inside the impedance tube. From this sample, the calibration factor, Hc, is obtained. This calibration factor is used for the correction of the Transfer Function, enabling in this manner, faster measurements, due to the fact that they only require one single capture per sample. This technique is used when a high number of samples is available.
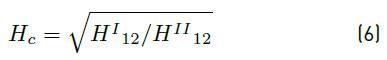
For the calculation of Hc calibration factor, it is necessary to obtain the Transfer Functions HI 12 and HII 12 from the calibration sample; such functions are acquired in an analogue manner as the procedure performed previously. An emphasis is made having in mind the correct location of the microphones, when performing the captures; the Hc calibration factor is obtained through the Equation (6).
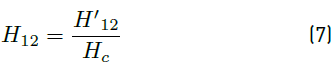
For the rest of the measurements, the standard configuration of the microphones is used, acquiring the Transfer Function without correction H’12; this one operated with Hc in the manner expressed in Equation (7):
The remainder of the process is analogous for both techniques.
Procedure for the measurement through reverberation time
Due to the lack of a Reverberant room, and the lack of prime material for the elaboration of enough huge samples (required for the determination of the absorption coefficient through the ISO 354 standard), an alternative method -where the reverberation time was measured in an empty room (non-normalized), following the protocols stipulated in the ISO 3382-2 Norm [9]; the different configurations are introduced and then through the variation of the reverberation time, the absorption coefficient can be calculated.
The measurement was performed in a room with 5,6 m long x 4 m wide x 3 m high dimensions, obtaining a total volume of 67.2 m 3 and a superficial area of 102.4 m2. In this case, it can be considered that the sample is not significant, due to the fact that is has only 1.2 m2. The room was chosen for its high reflective area, this with the aim of resembling it to a reverberant room.
After recognizing the room, the microphone-source positions are located. The Engineering method is implemented with 2 source positions and 6 microphone positions, and frequency ranging from 125 Hz to 4 kHz according to ISO 3382-2 normative. However, the minimal distance between microphones has to be 2 meters. At the same time, it has to be 1 meter, between 1 microphone and another surface, and at last, the minimal distance from the source to the microphones should be given by the Equation (8).

Where V is the room volume, c the sound propagation velocity, and T is the estimated reverberation time. Therefore, the minimal distance between the source and the microphone, calculated with an estimated reverberation time of 1.2 seconds and a sound propagation velocity of 343.2 m/s, is of 0.80 m.
After locating the microphones positions and connecting the measurement system, the software configuration and calibration in the Easera acoustic measurement software, is performed. For this, a 2-channel input and 1-channel output configuration is set, and afterwards, the pistonphone is calibrated to 94 dB SPL. A measurement of the background noise is performed, following normative recommendations. This normative states that the measurement signal must be at 45 dB above of the background noise. However, the background noise registered a 58 dB level; therefore, it is adjusted to the output level until it gets a 103 dB level.
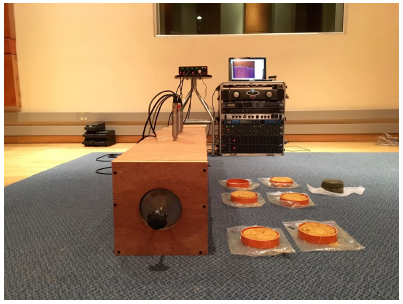
Afterwards, the reverberation time of the empty room is measured with the Impulsive Response method [Figure 6]. This measurement will serve as a reference to determine the absorption coefficient of the implemented samples. After this, the reverberation time is measured, placing the different sample combinations: acustifibra, guadua fiber, perforated panel, acustifibra panel, and guadua fiber panel, as it can be observed in the Figure 7.
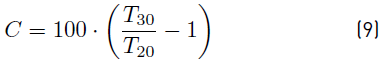
With the aim of determining the modal influence in the reverberation time measurements, the Normative ISO 3382-2 presents the C parameter, calculated through the Equation 9, which relates the evaluation ranges of 20 dB and 30 dB; in this way, the decrease of the curve linearity can be determined, and with this parameter, the reverberation time may be calculated.
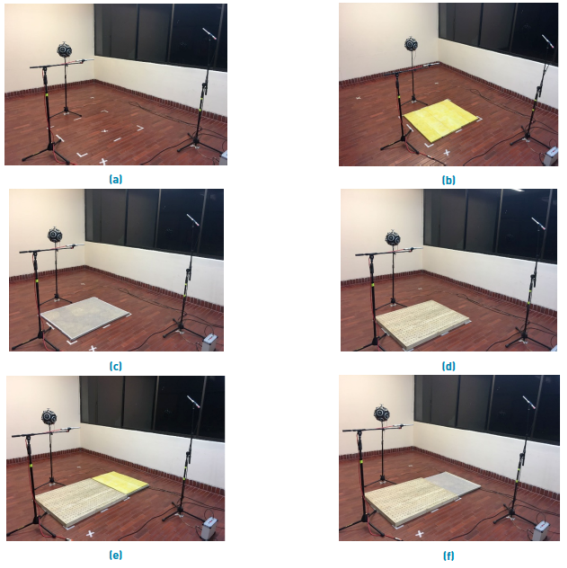
Figure 7 a) Measurement of the reverberation time with the empty room. b) Measurement of the reverberation time with acustifibra. c) Measurement of the reverberation time with guadua fiber. d) Measurement of the reverberation time with perforated panel. e) Measurement of the reverberation time with acustifibra perforated panel. f) Measurement of the reverberation time with guadua perforated panel
The non-linearity of this curve is due to different decay rates, showed by the modes [15]; even more, the normative establishes that, the common values of the decay parameter are between 0% and 5%; values higher than 10% indicates non-precision in the measured reverberation times. The Equation (9) shows the curvature parameter:
The reverberation times are averaged in each position, and then, the absorption coefficient is calculated.
Measurement according to the reflection method
Impulse response acoustic measurements are performed with the Easera software. Absorption coefficient calculation is performed, with the reflection method, through the module “in situ measurement processing”. Easera calculates the complex Transfer Function of the measurements by which the complex reflection coefficient of the material is obtained.
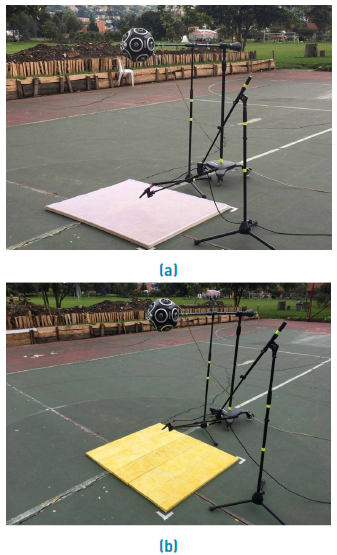
Analogously to the reverberation time measurement, system configuration and electroacoustic calibration are performed. The measurement of the background noise registered a 64 dB level and consequently, the source level was adjusted until 109 dB level, approximately. The measurements of the impulse response were held at free space, with the aim of minimizing the parasite reflections presence in the measurement. For this, the same configurations of materials implemented for the reverberation time, placing the samples over the floor (plane and rigid surface), in order to capture the reflection in an optimal manner [Fig. 8]. The loudspeaker-microphone array was positioned in the center and perpendicular to the samples, locating the loudspeaker at 1.10 m and the microphone at 10, 20 and 30 cm from the ground respectively. Measurement process is shown in Figure 8.
3. Results and discussion
After obtaining the impulse response with the test-materials, then the impulse response measurement at free-field is performed. Because of the lack of an anechoic chamber, then the football playground is used. For this, the microphones are placed in front of the source at a 1.80 m height and replicating the previous measurements distances. Due to the fact, that the latency of the system is not constant, the measured impulse responses must be accommodated, adjusting to zero the impulse arrival time; in the same manner, it is convenient to perform signal windowing in order to eliminate the parasite reflections [Figure 10].
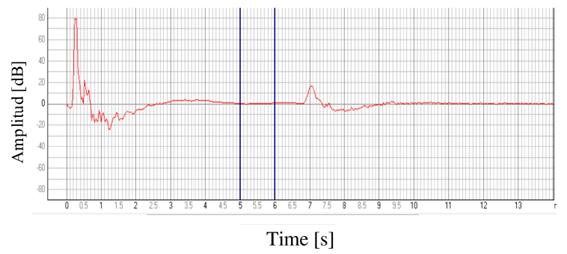
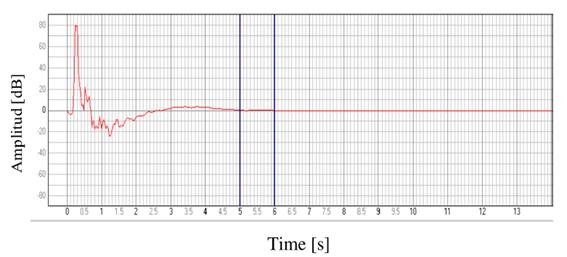
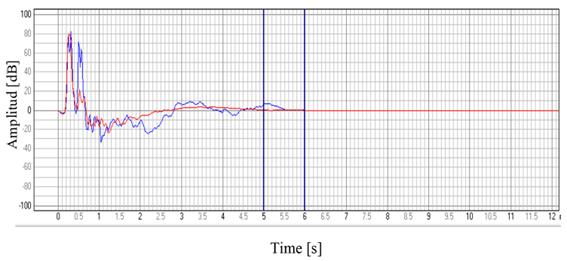
The interest measurements are overlapped (reference-reflection), verifying that they are aligned, and the reflection can be adequately visualized, as it is observed in the Figure 11. The red signal represents the reference and the blue one, the reflection.
Finally, the reflection coefficient calculation is performed. For this case, the visualization type is changed, in Easera, to magnitude. In the edition menu, the option “in situ measurement processing” is selected; this is achieved through an interface, where the measurements are verified to be in the correct order and moreover, the correction factor is included - mentioned before-. Followed, Easera presents the complex reflection factor in decibels; a reason why these values should be transformed to linear scale. Finally, the absorption coefficient is calculated.
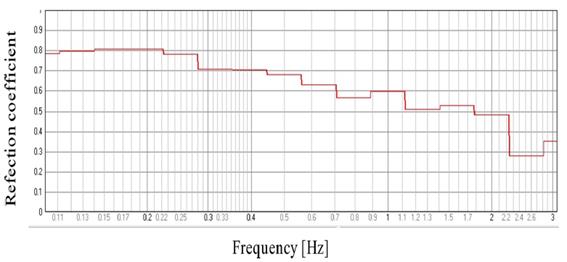
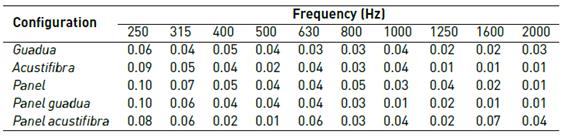
The results obtained through the tube impedance method, reverberation time and reflection method are presented in Figures 9 till 12. Results regarding the Reflection coefficient are presented in Figure 12. A comparative analysis with materials used in room acoustic conditioning, is performed.
3.1 Impedance tube
This section presents the absorption coefficient average, measured in the different configurations of the used impedance tubes. Taking into account the characteristic frequency ranges of these tubes, the whole frequency spectrum is covered. The absorption coefficient from 12 different samples was obtained, with exception to the 5.08 cm sample/measurement; two (2) overlapped guadua fibre samples were used and one sample from Black Theater.
A comparison between the interchanged microphones technique and the calibration factor technique was performed, stipulated in the normative ISO 10534-2. In the Figure 13, the guadua fibre absorption coefficient is observed (in blue) vs. the Black Theater fibre absorption coefficient (in red). Both curves were obtained by the two techniques, showing that both techniques are equally suitable. Due to the speed and the versatility of the calibration factor technique, this one is used for the performance of the remainder of the measurements.
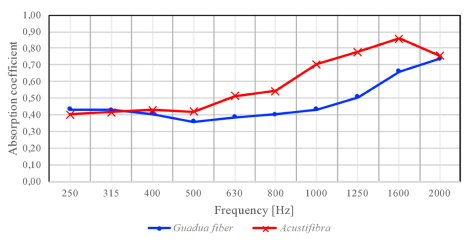
The Figure 14 describes the absorption coefficients of the guadua fibre (in blue) and the acustifibra (in red). Performing coefficients´ comparison, we can observe that at low frequencies, both materials have similar behavior, and from 500 Hz, the acustifibra begins to show a superior performance.
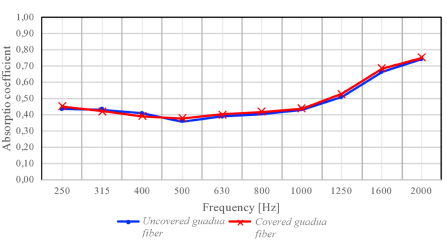
As it was indicated previously, in order to facilitate the guadua fibre manipulation (for perforated panel purposes), a wood frame -covered in veil- was constructed and in order to determine the acoustic influence of it, the correspondent measurement presented in Figure 15 is performed, where there can be observed that the variation in the absorption coefficient can be neglected.
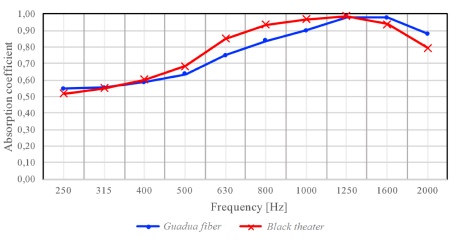
Through the Figure 16, it can be observed that the behaviour between such samples is highly similar, with subtle variations in the 630 Hz to 1 kHz range. Finally, in an experimental manner, the guadua fibre (in blue) -with 5.08 cm width- is measured, in a way that two samples of it are overlapped. Afterwards, a comparative analysis is performed with respect to the Black Theater (in red) -5.08 cm- sample, generally used in the acoustic conditioning of rooms. This material was used at the same time, as reference.
3.2 Method of the reverberation time
The ISO 354 normative stipulates that for a 200 m 3 chamber, the sample area must be between 10 m 2 and 12 m 2, which corresponds to 5% and 6% respectively of the total surface of the room. However, the used samples in this study, correspond to the 1% of the total area of the room: this may lead to systematic errors between the measurements.
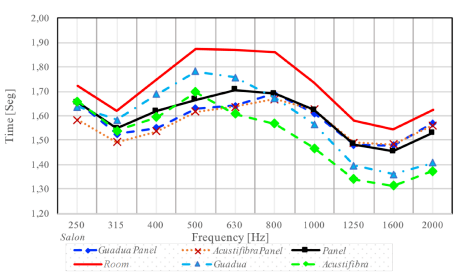
The Figure 17 presents the reverberation times (RT) measured according to the protocols stipulated in the ISO 3382-2 normative. As it was expected, the empty room has longer reverberation times: these are used as reference for the calculation of acoustic absorption.
Here we can see that, in the empty room, the RT is the largest, since it behaves as a huge cavity with a large acoustic compliance (related to the elasticity of the free particles that are responsible for the sound propagation phenomenon). The perforated panels, on the other hand, behave as Helmholtz Resonator, and finally all the filled panels besides their resonant character, have absorbent properties, since the air passing through the fiber has a larger resistance.
As observed in Figure 17, all-of-these techniques (based either on resonant elements, perforated panels, filled panels, or on fibres alone) present similar performances with respect to the reverberation time, which is the main indicator of acoustic conditioning.
When modifying the room surfaces, introducing the different materials configurations, the reverberation time is changed, highlighting that, the variation of RT presented by the perforated panel is inferior, with exception of the 500 Hz band; here in this frequency band, the guadua fiber is slightly superior. On the other hand, the guadua fiber and the acustifibra configurations reduced to a great extent the RT, above the 1 kHz band (high-frequency). On the contrary, the panel/guadua and panel/acustifibra configurations present a greater reduction at low frequencies (until 500 Hz).
With the aim of determining the modal influence in the reverberation time measurements, the 1/3 octave band curvature parameter was calculated.
Table 3 Curvature parameters of reverberation times. Conf. 1: Empty room; Conf. 2: Guadua Fibre; Conf. 3: Acustifibra; Conf. 4: Perforated panel; Conf. 5: Panel filled with Guadua; Conf. 6: Panel filled with acustifibra
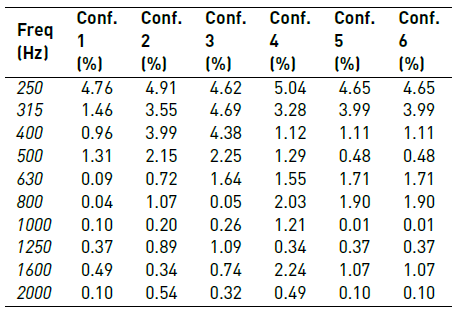
The Table 3 describes the curvature parameters of the measurements, indicating high fidelity and low modal incidence in the measured reverberation times. From the reverberation times previously described, the absorption coefficient of the different configurations is calculated. In Figures 14 to 23, the guadua fiber and the acustifibra performance may be compared. As it is expected, such materials do not have significant values of absorption at low frequencies. Also, even though the absorption increases in both materials, the acustifibra presents more efficiency compared to the guadua fiber.
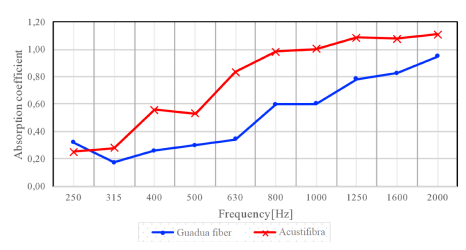
From 1,000 Hz, the acustifibra presents absorbent coefficients greater than 1; this is a systematic error due to the non-fulfilment of the ISO 354 requirements; on the other hand, taking into account that the calculation method is based on the theory developed by Sabine [16] and Cox and D´Antonio [17], those formulations become inexact for high absorption coefficients.
The absorption coefficient above 1,000 Hz increases due to the fact that the internal cavities of the material, its porosity and internal configuration makes it more efficient from this frequency. The largest amount of energy is dissipated beginning from this frequency.
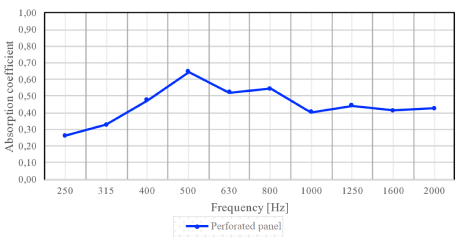
With the aim of having a wide frequency spectrum, a perforated panel was designed at middle/low frequency and as it was previously described, the resonant frequency to which the panel is tuned is 476 Hz. Consequently, the Figure 19 presents the absorption coefficient of this panel, and as it was expected maximum absorption at the 500 Hz frequency band is achieved.
On the other hand, the bandwidth of the resonator can be distinguished: this is between the 400 Hz and the 600 Hz bands, according to the behaviour of the absorption coefficient with respect to the central band of the resonator.
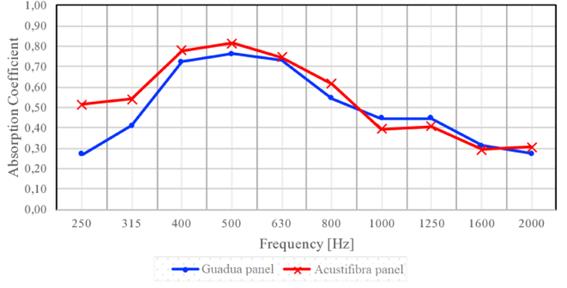
At last, the measured absorption coefficients are presented, for both, the incrustation of guadua fiber samples, and acustifibra samples (into the perforated panel). Figure 20 presents these results, where the effective bandwidth of the resonator increases considerably, comprising the frequency range of the bands between 315 Hz till 800 Hz. This behaviour is in accordance to the theoretical bases. With respect to the absorption level at the resonant frequency, there was an increase in the configurations with filling material.
It may be highlighted that, if the behaviour of both configurations, generally, is similar, the configuration with acustifibra filling has superior absorption coefficients with respect to the guadua fiber panel, with except from the 1 kHz and 1,250 Hz bands. However, those configurations present a significant difference in absorption in the 250 Hz and 315 Hz bands.
3.3 Reflection Method
[9] suggests that, for the absorption coefficient measurement through the Reflection method with normal incidence, the size of the sample under study must have a surface greater than 4 m 2, nevertheless, the samples used in this study count with dimensions between 1 m 2 and 1.2 m 2, which can give place to systematic errors within the measurements. Standard deviation analysis of the measurements on this method is presented in Table 4.
With the intention to improve the precision in the measurements, it was decided to use two different microphone positions, and for each of them, three measurements were done. The positions were selected strategically, having microphones distanced away. The first distance was 15 cm; this number is coincidently to ¼ wavelength, and to this number, the perforated panel was tuned. The second distance was chosen taken into account the size restrictions of the sample, so that it was decided to measure it in the highest degree of proximity; that is to have the microphone 5 cm from the sample.
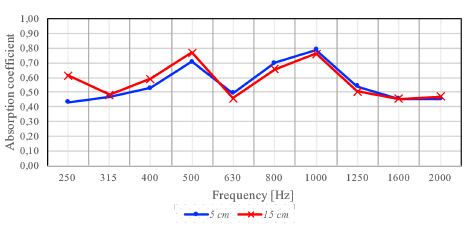
The Figure 21 presents the absorption coefficients of the perforated panel, measured by different microphone positions. It is possible to observe that, the coefficients of both measurements have the tendency to behave in a similar manner.
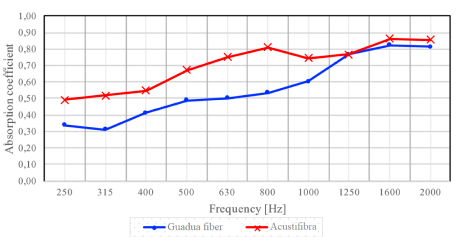
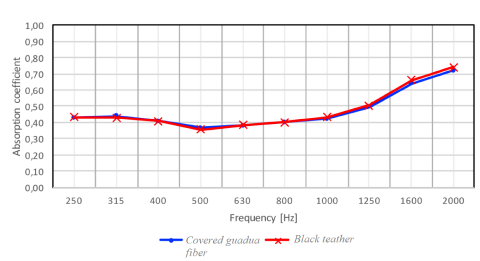
The Figure 22 describes the absorption coefficients of the guadua fibre and the acustifibra, in which the parallel behaviour between both materials is observed. It is worth to mention the proportional increase of the absorption coefficient with respect to frequency. However, greater absorption coefficients are noted because of the acustifibra, except from the 1,250 Hz band, for which the absorption is equivalent.
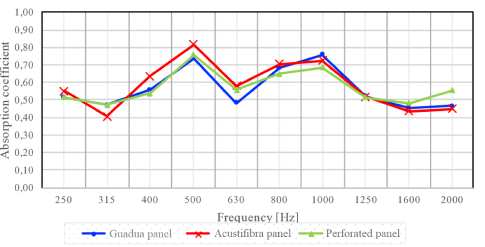
Figure 23 presents the absorption coefficients of three panel configurations. It may be appreciated that the resonance of them can be found in the 500 Hz band, satisfying the design objectives.
On the other hand, it is possible to observe a sudden increase in the absorption coefficient, which reaches a maximum in the 100 Hz frequency, suggesting a second resonance in the panel, which corresponds to the first harmonic of 500 Hz; in this case, such a resonance is notable due to the proximity between the microphone and the sample. This proximity enables the capture of pressure differences in that particular harmonic, a phenomenon, not seen in reverberation time measurements.
Taking a look to all the results, elements which may serve as acoustic absorption are a panel, a material (fiber) or a resonator. Whenever a reflection coefficient may be obtained, as the ratio of the reflected energy to the incident energy, absorption properties may be experienced. In the case of the geometry of the holes in the perforated panel, their dimensions as well as their distribution play a role in the acoustic absorption phenomenon. Since, in this research, different materials were tested (with different inner fibres and therefore with different resonant, resistant and porous properties) then, different absorption characteristics were measured.
4. Conclusions
The presented paper presents the results of an implementation of an acoustic panel made from typical Colombian fiber: Guadua Angustifolia. All the correspondent steps for the fabrication and validation of the panel are described. For the measurement of the acoustic (absorption) properties of the fiber, three methods were used: (1) the impedance tube method, (2) the reverberation method, and (3) Mommertz reflection method. The acoustic behavior of the panels made from guadua also were analysed and afterwards compared to other commercial panels.
Results show that the guadua panel is a potential product for the acoustic conditioning market. Its massive implementation would contribute to the principles of Sustainable Development.