


 English (pdf)
 Article in xml format
 Article references
 Send this article by e-mail
 Cited by SciELO
  Cited by Google
  Similars in
SciELO
Similars in
SciELO  Similars in Google
 Permalink
1. Introduction
Flash distillation is a conceptually simple process, but operationally complex due to it exhibits a strong non-linear behavior inherited from the thermodynamic equilibrium conditions governing the components separation. In addition, the typical operation of the flash without mass recycling, as it occurs in distillation towers, conducts the flash to operate in a point with high propensity to lose equilibrium. In spite of the brief treatment given to the flash in textbooks, sometimes those books put as the preamble to perforated-plate, considering that flash distillation has important applications at process industries. In chemical factories, a flash distillation assembly executes a gross separation before more sophisticated separation operations. This kind of distillation is used when a big difference between relative volatility of substances to be separated exists. One of the most documented application is the sea water desalination [1], but this process is extremely simple from a thermodynamic point of view when compared to separating liquid solutions of multiple components, as the process treated here. Therefore, advances in desalination modeling and control have little application in flash distillation of mentioned complex liquid solutions, normally present in chemical process industries.
The concept of feasible operation region evokes the linear programming results in which straight lines generate the borders of a zone containing possible solutions to an optimization problem. A similar FOR concept, but applied to chemical processes, has poor discussion, except during process design looking for providing safe equipment operation [2, 3]. A marked interest about a FOR is evident in theoretical approaches when process controllability is tested [4]. However, consulted works do not propose an efficient and direct way to determine the mentioned FOR for a process, except for controllability evaluation. On the other hand, the increase of available models for diverse processes gives an opportunity to explore the use of the process model to determine various characteristics of controlled process, including its FOR [5].
In spite of a single-stage flash seems a fairly simple task with an idealized adiabatic equilibrium, determining the FOR for T and P is not a common practice in industrial applications. Obviously, the reality is that none of the assumptions proposed herein to find the flash FOR are totally valid for a real flash, conducting to an idealized FOR. However, counting with this information provides design and control tasks with additional information. That new information can be used as a reference point for determining the operation point or the span of control actions. In this way, the major operative difficulty of a flash separator, recognized as the recurrent shut-down by reaching the unfeasible separation region after slight input temperature or feed composition disturbances, could be avoided. In this sense, this paper states a procedure to calculate the feasible operation region for a flash distillation through its model. This process, due to its dynamic complexities, is a good testing process for mentioned proposal, which can be applied to other chemical processes following the stated steps. In addition, a novelty control system is presented and compared with a traditional PID control scheme for a flash distillation process.
The paper is organized as follows. In Section 2, the flash distillation of a multi-component mixture is described and a phenomenological based semiphysical model (PBSM) for this process is obtained. In Section 3, the FOR for flash distillation process is identified and characterized. Section 4 presents in brief several possible uses of the FOR, finishing in Section 5 with the test of three control proposals, one of them using the FOR, all compared by simulation for analyzing their advantages. Conclusions close this work.
2. Operating principle, modeling and design of flash operation
The feasible operation region indicates a zone within which the process objective could be fulfilled at closed loop operation despite several bounded disturbances appear. Using a model of the controlled process for distinguishing feasible and non-feasible operation points is a good option. Obviously, to have a process model with good precision is the previous requirement. From current process modeling tools, the phenomenological based semiphysicial models (PBSM) have demonstrated their strong capability for representing processes [2, 6-8]. Therefore, this family of models is used here to represent the flash distillation process with good precision.
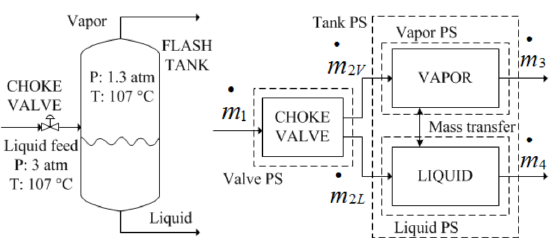
There are two kinds of flash separation, adiabatic and isothermal. In an adiabatic flash process, a choke valve produces the partial phase change due to the sudden pressure change at that valve. In isothermal process, a choke valve is not necessary because phase change occurs at the heat exchanger located previous to the flash drum. In both kinds of flash, two phases are formed previously to flash drum and, two streams are leaving the flash drum: vapor at the head and and liquid at drum bottom [9]. Therefore, the only function of flash drum is to allow the physical separation of both phases [10], maintaining the pressure reached at choke valve output. In this work, an adiabatic flash as the illustrated at left side of Figure 1, is treated.
The chemical equilibrium concept is used to flash separation analysis using thermodynamics [9]. In flash processes, the partial vaporization produces a vapor rich in the most volatile substances [11]. Liquid and vapor phases in contact inside flash drum reach thermal and thermodynamic equilibrium providing enough residence time into the tank for both phases [11]. A phenomenological based semi-physical model (PBSM) describing the flash separation process was deduced in detail in [10]. Here, by space limitation, only a brief description of the model for an adiabatic flash is presented in this section.
As example, the process shown in Figure 1 corresponds to the separation of a complex mixture of propylene oxide (PO), water (W), propylene glycol (PG), and sulfuric acid (SA), available at 3 atm and 383.15 K, using an adiabatic flash assembly. This mixture is for example, the exit of a chemical reactor as stated in [12]. At steady state the molar fluxes at choke valve inlet in  are 0.21436, 33.83968, 1.2147, and 0.644 for PO, W, PG, and SA, respectively. This feed stream is at liquid state but after passing choke valve the pressure falls to 1.3 atm producing partial vaporization. The flash drum has 1.7 m of height and 0.35 m of diameter, providing enough volume to consolidate the liquid-vapor equilibrium. Due to the difference among relative volatilities, the liquid stream exiting the drum contains a large concentration of PG, W, and all the SA, with a very low concentration of PO. On the contratry, the PO and W composition in vapor stream is high compared to the low PG concentration and the total absence of SA in this vapor stream. The flash objective is to minimize in vapor stream the PG (the product) concentration and maximixe the PO (raw reactive) content. Fulfilling these conditions, the vapor stream can be used as reactive source for the chemical reactor previously to the flash, where PG is formed [12].
At the right side of Figure 1, the process systems (PSs) taken to apply the modeling procedure described in [7] are illustrated. These PSs are: choke valve, flash drum, vapor phase into the drum, and liquid phase into the drum. The block diagram presents the PSs relations with labels to be used during model equations deduction. By applying the conservation principle, one total mass balance equation and n component mass balance equations appear. The momentum balance equation was used to evaluate the flow through the control valves. These equations conform the structure of the phemonological based semiphysical model (PBSM) to the flash distillation process. In all equations, sub-index i is used for components PG and W. Subindex L and V indicate liquid or vapor phase, respectively. 2V and 2L refer to vapor and liquid streams after choke valve. When double sub-indexes are used separated by comma, the second one indicates stream number taken from blocks diagram given in Figure 1. Used symbols are: w the mass fraction, P the total pressure, T absolute operating temperature, L liquid level, V volume,  molecular mass, R universal gas constant,
  mass flow rate, A
T
cross area of tank.
mass flow rate, A
T
cross area of tank.
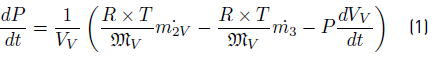
Balances over Vapor Process System (PS) produce Equations: (1) for vapor phase pressure from a total mass balance, and (2) for i composition using component mass balances. In both phases, no balances are stated for composition of sulfuric acid (SA), because all acid leaves the flash as a part of liquid stream. No balance is required for PO because the sum of compositions for each phase is 1.0. It is important to highlight that evolution thermodynamic equilibrium is made using molar concentrations, which are obtained by units conversion into the simulator.
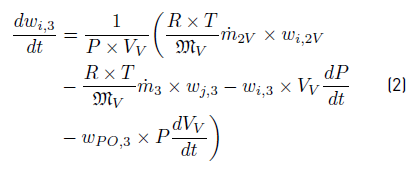
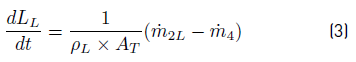
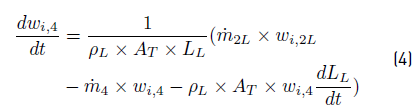
After applying conservation principle over Liquid PS, the obtained balance Equations are: (3) for liquid level from a total mass balance,and (4) for composition from component mass balances:
The differential equations found are the basic structure of the PBSM for flash separator. The extended structure is formed by the next constitutive and assessment equations, used to evaluate the model structural parameters:
• Thermodynamic equilibrium equation. In accordance to [11], the Wilson correlation can be used because the system operates at low pressure. This correlation is presented in the Equation (5):
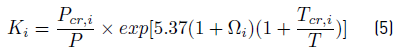
with K i the mass transfer equilibrium constant, P Cr,i , T Cr,i , and Ω i , are the critical pressure and temperature, and the acentric factor of component i, respectively.
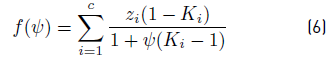
• Phase partition or separation parameter ѱ, which indicates the quantity of liquid and vapor formed after pressure drop applied by the choke valve. ѱ is calculated using the Rachford & Rice equation (Equation (6)] [11], where z
i
is the molar feed composition, obtained by unit conversions from values for 
• Flow through a valve. This value is required to calculate the vapor flow  and the liquid flow
  , leaving from the flash drum. The expression used is the Equation (7):
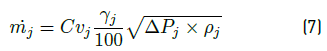
where Cvi is the coefficient of valve, γj the valve opening percentage, ΔPj the pressure drop through the valve, and ρj is the density, all for the current j.
• Pressure drop through a choke valve. The Equation (8) of Mankenberg [13], a valves manufacturer, is used here:
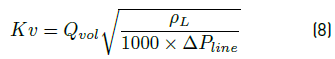
with Kv the choke valve coefficient, Qvol in  the volumetric flow, ρ
L
the density of the liquid circulating through the valve, and ΔP
line
the pressure drop in choke valve in stationary state.
the volumetric flow, ρ
L
the density of the liquid circulating through the valve, and ΔP
line
the pressure drop in choke valve in stationary state.
• Correlation for liquid and vapor densities. Adjusting to polynomial the data taken from Aspen Plus® between 353.15 K and 389.15 K and pressure data between 1atm and 5atm, the next equations allow the assessment of densities for treated substance, with T in K, P in Pa and density in  .
.
Propylene oxide: ρPO,L = 1322 - 1.595T - 2.931 x 10⁻¹⁹P.
Water: ρB,L = 1199 - 0.6498T - 1.914 x 10⁻¹⁹P.
Propylene glycol: ρC,L = 1297 - 0.8736T + 1.032 x 10⁻¹⁹P.
Vapor phase density. This property is evaluated considering this mixture as an ideal gas: ρc,V =  .
.
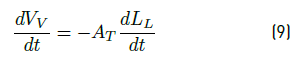
• Volume change of vapor phase. Using the known formulation for volumen and applying the derivative, the expression (9) is obtained:
• Sum of compositions in liquid an vapor phase. Mass fraction summation at any stream is ever 1.0. For liquid:  xi = 1, and for vapor:
  yi = 1.
In spite of this work is not dedicated to design, the flash drum design, it is important because final dimensions of flash drum change the dynamic response of vapor pressure and liquid level into the drum. Therefore, in the following part of this section, a brief of such a design procedure is presented for completeness of discussion about flash distillation process FOR. To design the physical dimensions for a flash drum, it is necessary to know: separation factor, inlet flow and molar compositions of each phase after choke valve. Using the algorithm reported in [14, 15], next flash drum dimensions are found: total height and diameter of the drum, and level or height of liquid into the drum. However, the designer should specify the liquid volume or liquid hold-up. The design nomenclature is illustrated in Figure 2.

At the beginning of flash drum design, the maximum permissible speed of vapor phase into the tank is calculated using the empirical Equation (10), converted to international unit system m/s using the given numerical constant:
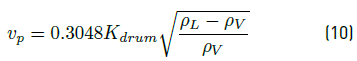
with v
p
the vapor velocity in  , Kdrum is an empirical constant, which is evaluated with the Equation (11):
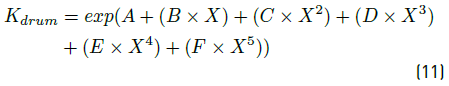
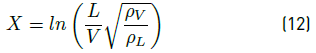
where the empirical constants are: A = -1.942936, B = -0.814494, C = -0.179390, D = -0.0123790, E = 0.000386235, F = 0.000259550, and X is the relation between the K factor for a vertical vessel (Kdrum) and (L/V )  which is calculated according to Equation (12):
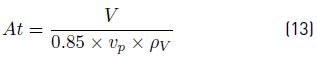
It is important to highlight that the design is based on a percentage of v p . It is recommended to use 85% of that value, because for values of vapor velocity greater than v p , the liquid entrainment is high. Using this recommendation, the cross-section area (m 2) of flash drum is calculated with the expression (13):
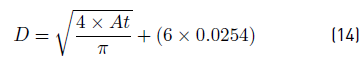
Finally, the drum diameter in m is calculated according to the Equation (14):
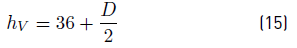
To evaluate the total height of flash drum, first the height from the feeding port to the top of the drum h V is calculated. It is important to highlight that the diameter would be given in inches, because the equations are empirical. h V is calculated with the Equation (15):
Moreover, the liquid level h L is defined by the designer in accordance with the process, with dimensions in inches too. Additionally, in [14, 15], authors suggest to take the separation between feeding port to liquid level, h f as 12 in. With all these dimensions, finally the total height of the drum is calculated with the Equation (16):
3. Feasible Operation Region (FOR) for flash distillation
The known approach to analyze dynamic behavior of processes is to consider one to one input to output (or to state) process behavior. Under this consideration, any value inside the span of each input variable could produce a valid process behavior. In this way, for two inputs a rectangular region in 2D could be obtained, with all interior points as feasible operation conditions. However, the effects of changes on multiple inputs on nonlinear processes can produce portions of that input space where a valid process response does not exist [16]. A valid process response indicates the process objective is being fulfilled. Therefore, two regions into the total inputs space can be defined: an operative feasible region, where the process meets the objective for which it was designed, and a non-feasible region where the process does not fulfill the process objective. This non-feasible region is totally useless and should be avoided during process operation. For some processes, when the operation falls into non-feasible region, the process should be shut-down and restarted, as the case of a flash distiller due to liquid flooding or total vapor filling. In addition, the FOR determination implies defining a zone where the available control actions are able to comply the process objective in spite of current and bounded disturbances acting on the process. During process operation in industrial equipment, the mentioned determination of FOR is performed by trial and error of the human operator. However, if a validated process model is available, that task can be off-line executed by simulation with the model under different conditions of input and disturbances.
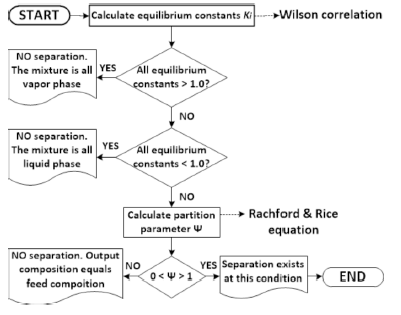
In a flash distiller, to reach an effective component separation strongly depends on pressure and temperature at choke valve output. Obtained separation depends on equilibrium conditions determined by operation values for temperature T and pressure P at choke valve exit supposed, which are maintained into flash drum. Therefore, all possible values of these two variables must be tested to detect the FOR by obtaining the equilibrium constants and the phases partition parameter ѱ for each given (T, P) pair. The common practice is to calculate the equilibrium constants through the Wilson Equation (5), taking into account temperature, pressure, critical properties and feed mixture composition. The phase partition coefficient ѱ is evaluated using the Rachford & Rice Equation (6). It is important to mention that there are more complete expressions, but looking for simplicity, in the current work the mentioned ones are used. Here, the multilevel decision tree illustrated in Figure 3 is recursively used with calculated equilibrium constants and ѱ factor to each taken pair (T, P). A binary conclusion about the grade of components separation is obtained and recorded with a label for each pair: feasible and unfeasible. By plotting these labels, the FOR can be easily detected.
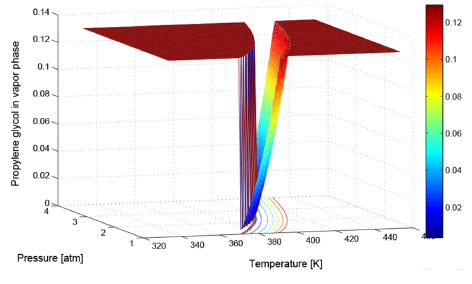
Applying the mentioned procedure to cover T from 343.15 K to 443.15 K using a temperature step of 274.15 K, and P from 1 atm to 3 atm, with a pressure step of 0.05 atm, it was possible to calculate the PG composition at vapor phase w PG corresponding to each (T, P) tested pair. A three dimensional plot of inputs (T, P) located at x, y axis versus output w PG plotted at z axis, produces the 3D-surface shown in Figure 4.
There, two operative modes are clearly distinguishable, one is the feasible operation region, represented by the curved and ascending ramp on the right side, moving from w
PG
= 0.0043 to 0.1295  . At any point over this surface there is an effective separation. The second operative mode is represented by two red planes located at both upper sides of FOR. Over those planes, any point represents a concentration into a single phase equal to the feed concentration, i.e., no separation is obtained. An apparently third operative mode is the abrupt step from minimum to maximum PG concentration sketched at left side. It should be noted that this is not a real region because points do not exist into this ascending wall. That wall is a graphical effect produced by the plotting instruction of Matlab®, which fills with lines those abrupt changes.
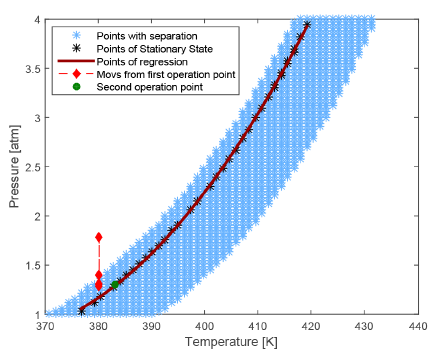
To improve the visualization of the FOR for process inputs (T, P), it is possible to plot the 2D projection (T, P plane) of the original 3D-surface, presented in Figure 5. The mentioned two operation regions are easily appreciated there. The FOR is marked here as a blue cloud of points at the center of the figure, where a discontinuous region in blank is viewed at both sides of the FOR. As a particular operation condition, one curve of equal-concentration is illustrated in red as a particular regression of points (black) into FOR. Those points correspond to constant Propylene glycol (PG) composition in the vapor. Such a kind of regression curves are useful to guide a model-based control during P and T movements to maintain the feasibility of flash separation, like it will be discussed later. The original operation point is marked in red, with a sequence of movements at constant temperature indicating a jump to the unfeasible region at the last red diamond. A proposed new operation point is marked as a green dot. All these characteristics and changes over operation points will be discussed in the following section.
4. Uses of the FOR for control structures
From the control theory point of view, the existence of a FOR result is contrary to the expected full range of operation in ℜ n for a process with n control actions. That expected full range could be obtained by combining all possible values of the n control actions inside their respective spans. The existence of a FOR different to supposed full range operation impacts process engineering tasks executed over the process: design, optimization and control [17]. In this sense, reviewing known textbooks about proposed control structures for flash distillation [3, 18], it was evident the lack of mention about the FOR. In addition, it is evident that to know the process FOR complements any simultaneous process and control design strategy [19]. In this case, the immediate FOR use is to include the FOR borders as a constraint into design procedure, in addition to controllability constraint. A mathematical formulation of the FOR borders is the main requirement to include this knowledge into simultaneous process and control design [2]. The mentioned mathematical formulation can help to any model-based controller to restrict its control actions to a known span avoiding the operation where there is no separation. In addition, to know the FOR allows a better determination of the set points to closed loop operation of the process. For this purpose, into FOR it is possible to determine equal-concentration curves, each one of them represented by a regression reproducing all the points with the same concentration, as it was sketched for a given value in Figure 5. This information helps a feedforward controller to find the right position of control action, knowing the value of measured disturbances, pressure or temperature. In the following part of this section, the control of the process is discussed, including the FOR information into on of the tested control structures.
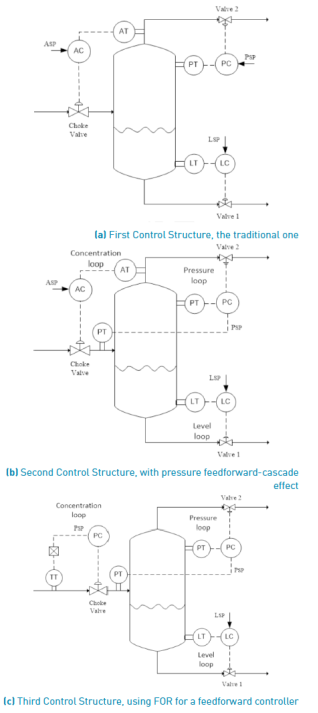
Regarding existing control proposal for flash distillation, the traditional one, called first control structure and presented in the top P&ID of Figure 6, was tested in [10]. This structure has three PID control loops, one for propylene glycol (PG) concentration, the second for pressure into flash drum, and the last control loop for liquid level into flash drum. The concentration loop uses an online analysis transmitter (AT) for PG concentration, which is a currently high cost instrument. These three control loops do not have communication about them. Using this proposal, the dynamic response of PG concentration loop in vapor phase resulted very slow [10]. This is due to the only way to drive the concentration to its set point after disturbances using a quite small proportional gain controller. Such a low proportional gain was tuned to avoid the separation interruption when the controller tries to return the concentration to its set point using wide valve movements. These control actions conduct the flash to operate outside the required thermodynamic conditions for proper separation. The mentioned traditional control structure can be modified, producing the two alternatives illustrated in middle and bottom P&IDs of Figure 6, both tested in present work.
The second control structure uses the same three control loops, but avoids the mismatch and delay between pressure inside flash drum and pressure at choke valve output, a non-considered dynamic condition in published works. That consulted works assume the immediate pressure equality at both points [20]. These mismatch and delay take place due to the vapor phase capacitance into flash drum. In this second control structure, a simple communication, acting as a feedforward-cascade signal from the pressure transmitter at choke valve output to the set point of pressure drum controller, improves the performance of control structure as a whole, as it was presented in [21]. Next section reconstructs those results but applied to another operating point for the designed flash distillation.
The third control structure maintains the feedforward-cascade communication of the second one, but the PG concentration loop is changed by a feedforward loop. In such a loop, the temperature of feed mixture is the measured disturbance. The regression of equal-concentration points obtained form FOR, corresponding to the concentration set point value, is used as the model into the feedforward controller to determine the right pressure drop at the choke valve. The equal-concentration curve was drawn in the Figure 5. The polynomial describing all plotted points with concentration equal to a PG concentration value of 0.021  , is presented in Equation (17):

with P the pressure after choke valve in atm and T the temperature of feed mixture in K.
It must be highlighted that this third control proposal does not need the PG concentration loop as previous ones. In this case, the feedforward loop is a pressure controller, in which the calculation block determines the pressure indicated to reject the measured temperature disturbance effect on PG concentration. Moreover, using this control proposal, it is possible to maintain the flash process operating into the FOR, which avoids the process shut-down when separation is lost.
5. Control simulation results
To determine the capabilities of the two last modified control structure respect to the traditional one, this section presents a comparison between the three structures, previously described and depicted in Figure 6. Regarding the first control structure, in Figure 5 two situations related to operation point location are illustrated: i) traditional location without considering the FOR, represented by the red diamond inside the FOR, corresponding to 380.15 K of temperature and 1.3 atm of pressure; ii) A new location, is determined using the knowledge the FOR, marked with a green diamond inside the FOR over the red curve of equal-concentration, Figure 5. In this figure, the movements of manipulated variable, pressure at choke valve output, after a temperature disturbance of +1.5% (381.7K) are marked with other two red diamonds. As it can be seen from this diamonds, the flash finishes outside the FOR, which conducts to a shut-down of the process. Considering this undesirable situation, the mentioned second operation point was located at 383.15K and 1.3 atm, increasing the robustness of the controlled process [21]. Operating with this condition, the obtained PG concentration is 0.021  . It should be highlighted that such a new operation point slightly changes the propylene glycol (PG) concentration, as it is evident from Figure 5, where red diamond inside FOR is not over the red curve of PG equal-concentration. This fact is due to the new combination of T and P change the separation factor (ѱ), conducting to a separation slightly different to the previous one. In the following, all the control structures are tested at the second operation point. The behavior of pressure and PG concentration are the considered state variables, because the third one, the level is easily maintained at its set point. All simulations apply a disturbance of +1.5% of stationary state temperature value at 600 seconds of total simulation time.
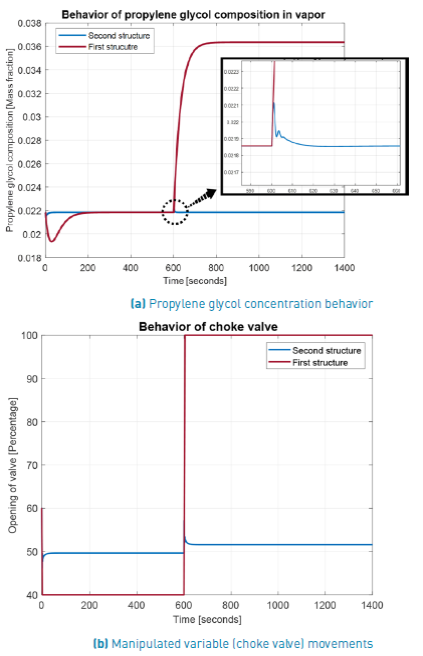
The initial comparison is between the first and second control structures behavior when controlling the propylene glycol (PG) concentration. From Figure 7, it is evident the best performance of second control structure because the first one (traditionally used) is unable to return the variable to its set point. The new stationary state reached by the PG concentration when it is controlled using the first structure is due to choke valve saturation, as can be seen from lower graph in that figure. The adequate performance of second structure is remarked in the zoom of upper graph, indicating a minimum overshoot and a fast return to PG set point.
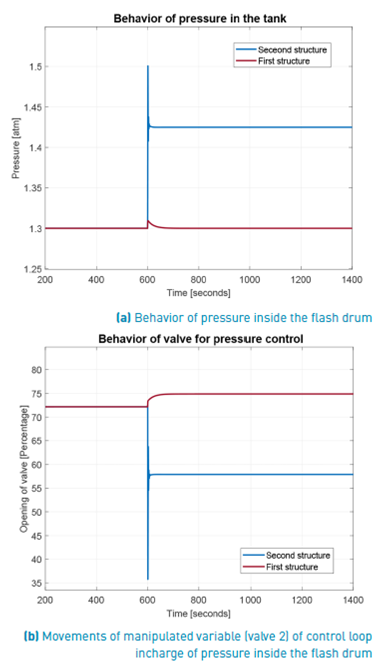
From Figure 8, and regarding the behavior of pressure inside the flash drum, which is manipulated by the exhausted vapor flow through the valve 2, it should be noted that for the first control structure the pressure return to its fixed set point (1.3 atm). In spite of the mentioned disability to control the PG concentration, this structure maintains the pressure at its set point value with the flash ever operating into the FOR, but far of desired PG concentration. This fact indicates the importance of knowing the FOR to determine a most robust operation point regarding shut-down but without guaranteeing the PC concentration. Contrary to this behavior, in the second structure the pressure inside the flash drum follows the measured pressure at output of choke valve. This indicates the importance of that communication between measured pressure at choke valve output and inside flash drum pressure loop. The better response of PG concentration justifies the change of pressure set point in the pressure loop.
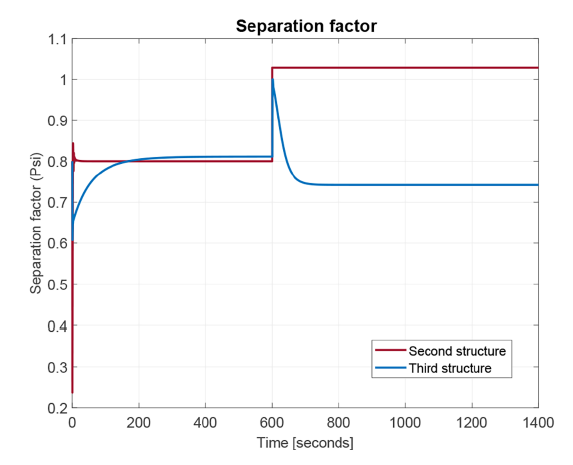
As it was presented in [21] and recreated here for a new operation point (see Figures 7 and 8], the second control structure has a good performance rejecting low magnitude disturbances on feed temperature. However, when this disturbance is higher, such a control structure loses its robustness. In addition, the use of an online analyzer (AT) in that control structure raises the implementation cost. To overcome these drawbacks, in the current work a third control structure is proposed (lower P&ID of Figure 6], which does not need the expensive AT. In this case, the knowledge given by the equal-concentration polynomial (Equation 17 and red curve in Figure 5] is used to find pressure at choke valve exit corresponding to the desired value for the PG concentration. To compare the second and third control structures, a higher disturbance of +6% (279.75K) of stationary state temperature value is applied at 600 s. The Figure 9 shows the PG concentration response for these two control structures. As it can be seen, the third structure maintains the flash process operating into FOR contrary to the second one, which drives the process outside the FOR under this higher disturbances. Moreover, propylene glycol (PG) concentration returns to values very close to the set point. The existing little stable state error evident in Figure 9 for third control structure is a consequence of polynomial adjustment error over the equal-concentration points (red curve in Figure 5]. On the other hand, the concentration is not affected in the second structure, because when the disturbance is applied, there is not separation as shown in Figure 10, where an index of loss of process separation capability is presented. There, the values of phase partition or separation factor for the process controlled using the second and the third control structures are sketched. As it was previously mentioned, a ѱ greater than one indicates no separation.
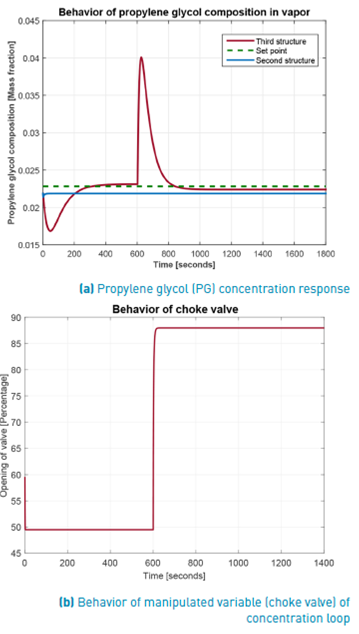
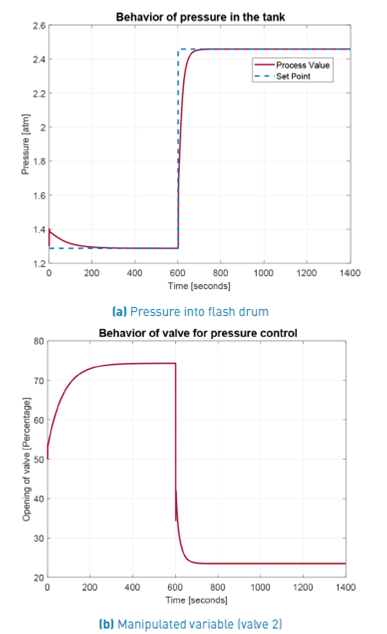
In Figure 11 the behavior of pressure at choke valve output (equal to the set point of flash drum pressure controlller), is presented in the top. At the lower part of this figure the movements of valve 2, the control action driven by this controller, are illustrated. Both graphs correspond to the third control structure operation. As it can be seen, that manipulated variable is keeping into an adequate range without achieving valve saturation.
6. Conclusions
A procedure for obtaining the FOR for a flash was proposed and tested, highlighting its applicability and easy to use characteristic. The use of FOR for design was evident by slightly moving the operation point far from the border, to gain robustness regarding typical disturbances. Additionally, the cascade control implemented in the second structure improves the controller robustness because it can reject more disturbances. However, when there are higher disturbances, this second structure could not reject them well. In this case, the feedforward control in the third structure has a better performance, because it can guide the system into FOR maintaining the PG set point. In this sense, the FOR into the feedforward controller is used to restrict control actions avoiding the operation where the behavior of the process is unfeasible, assuring a better closed loop response regarding disturbances. It is evident the impact of the proposed control structure on the currently available control approaches to the flash distillation process. Obviously, real implementation will allow improving some aspects that are not within the scope of simulation tests.

