


 English (pdf)
 Article in xml format
 Article references
 Send this article by e-mail
 Cited by SciELO
  Cited by Google
  Similars in
SciELO
Similars in
SciELO  Similars in Google
 Permalink
1. Introduction
The aquifers are the largest and sometimes the only source of water supply in the arid and semi-arid regions. The department of Sucre, Colombia, does not have available surface sources, therefore it depends on underground sources to supply approximately 1 million inhabitants, extracting 67 million m3 annually on average. Its main underground source is the Morroa aquifer, which supplies 52% of the population. Studies have been carried out on this, evidencing intense extraction, considerable decreases in water levels, high vulnerability and the risk of contamination by urban discharges in surface water currents. also for agrochemicals on soils [1-3]. For this reason, we see the need to undertake actions that contribute to the sustainability and protection of this important source.
The greatest contribution to sustaining the aquifers is through recharge; in this sense, the study of water regulation in the basins is very important. Among the most significant regulatory mechanisms is the storage of water in soils, of which infiltration is an important component constituting an interface for the recharge of deep aquifers. This mechanism is influenced by the hydrological conditions of the soil, climate, morphology and vegetation [4-6]. The study of these factors contributes to the sustainable management of aquifers by defining the capacity for capture, circulation and storage of water in the basin, helping to implement environmental management plans.
The morphology of the basins is evaluated through morphometric indicators that allow understanding the dynamics of the surface water flow, because it studies and analyzes the forms, the processes of evolution and modeling of the surface of the land. Its application is given by the calculation and analysis of quantitative indicators that have been developed through numerous studies and describe the characteristics of the surface, the relief, the composition of the water network and the flow patterns [7-10]. It is an indispensable step when carrying out hydrological studies.
The main methods to assess water infiltration in soils such as double-ring infiltrometers, tension disk infiltrometers and rain simulators require on-site interventions and generate point data, which requires a big investment of resources and limits the analysis at the regional level. The models used for the calculation of the infiltration are of two types, some based on mechanical models and others on experimental methods. The Curve Number method of Soil Conservation Service (CN-SCS) is an experimental technique that has been widely used to determine hydrological parameters such as Infiltration and potential runoff generated in rain events taking into account the characteristics of the terrain and its antecedent conditions, providing important results at the global and regional level [11-14]. Among the advantages is its application by means of GIS tools, which allows covering large areas, improving the analysis process, with greater precision and lower investment costs, in addition it can be considered as an indicator of the degree of affectation of soil infiltration in a basin [11, 12, 15].
The main objective of this article is to estimate the potential infiltration considering the geomorphological aspects that favor and enhance the recharge process in the Arroyo Grande basin. The morphometric indicators are used to evaluate the shape of the basin and the circulation of the currents; The curve number method (CN) was used to estimate the potential infiltration and identify the zones with the best conditions for the process. All activities supported with GIS tools.
2. Methods and materials
2.1 Study area
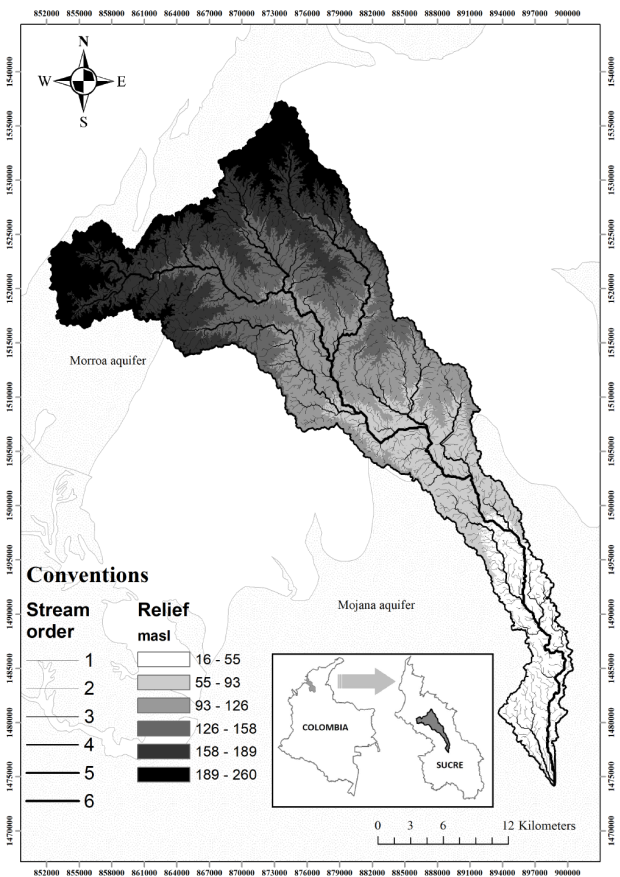
The Arroyo Grande basin is located in Sucre, Colombia [Figure 1]. Its use is livestock, dominating the landscape of hills and valleys on the banks of the streams. Surface flows are composed of seasonal streams that have a greater drainage dynamics in rainy seasons and have high contents of urban discharges. Its main channel runs through part of the department in a north-south direction, finally ending in the La Mojana wetland complex [16].
The study area is located in a semi-arid zone classified as an ecological system, Tropical dry forest [17-19]. According to hydrological data between the periods of 1943 and 2011, the average annual precipitation and runoff rate is 1,071 mm and 630 mm, respectively, for the northern zone of the basin [20]; There is a gradient of increased rainfall north-south. The average concentration time of 26 hours. The average temperature in the north of the basin is in the range of 26 to 28° C. To the south the highest average annual temperatures are recorded with more than 28° C [17].
The geology of the study area is made up of the litho-stratigraphic units Sincelejo, Morroa and Betulia. The Sincelejo formation is described as a powerful unit, consisting of fine-grained to conglomeratic sandstones, with crossed stratification and local variations to muddy facies, located north of the basin. The Morroa formation corresponds to the zone with the greatest aquifer potential, it overlies the Sincelejo formation and the Betulia formation. The population centers of Sincelejo, Corozal, Morroa and los Palmitos are located on it. It is constituted by layers of friable sandstones and unconsolidated conglomerates, interspersed with layers of arcillolites. The Betulia formation is located in the south-central part of the basin and is defined as a unit of fluviolacustrine sediments, composed of an alternation of friable sandy clays and siltstones, partly stratified and with notable facies changes [18, 21, 22].
The study area intercepts the Morroa and La Mojana aquifer systems. Morroa is the most exploited in the region, is located north of the basin and is made up of four hydrogeological units (UH), grouped by topographic, geological, hydraulic and chemical characteristics [1, 18, 23, 24]. The Mojana aquifer system is located to the south of the basin, it is made up of Betulia, Mojana, El Cerrito, Sincelejo aquifers and the San Jorge River alluvial deposits. Both underground sources are composed of free-flowing, semi-confined and confined aquifers [25].
2.2 Morphometric indicators
The morphometric indicators help to know the hydrological behavior of a basin. These indicators can be linear scale descriptive and dimensionless, both allow the comparison of topographically analogous units without size inference [26]. They can be classified as dimensional, surface indicators, the composition of the water network and the drainage pattern.
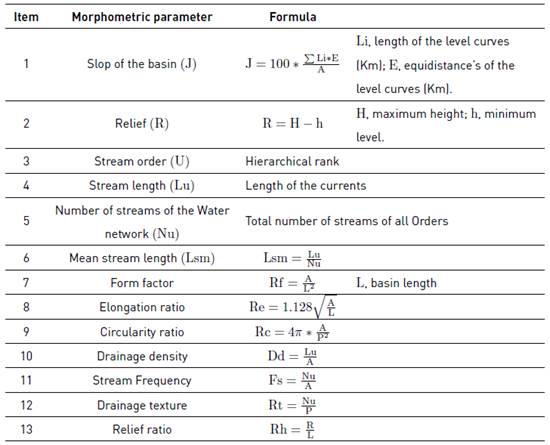
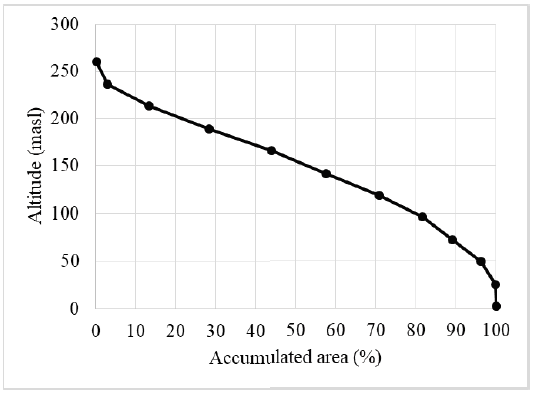
Dimensional and surface indicators are: Area (A), which is the surface that drains the projected basin in a horizontal plane [9]; Perimeter (P), is the linear measurement of the topographic limit divider of water, on a horizontal plane [27]; Appearance or orientation, is the location of the surface of the land with respect to the north; Slop of the basin (J), is the relationship that exists between the altitudinal difference and the length of the basin, it is calculated as a weighted average of the slopes of all the elementary surfaces [9]; Relief (R), is the height represented by the difference between the lowest point and the highest altitude of the basin; Hypsometric curve, is the cumulative curve of the area on the projection of the height in the plane helps make inferences of the degree of affectation by runoff and erosion on the surface is associated with the life stage of the basin that can be young, mature or old [7].
The indicators of the water network are: Stream Order (U), which corresponds to the assignment of a hierarchical rank to the currents of a basin, being the minor currents the low denomination and the current greater the high rank; Number of stream of the water network (Nu), corresponding to the total number of currents of all orders, including seasonal or continuous currents, the indicator defines the degree of development of currents and drainage capacity [26]; Stream length (Lu), is the linear measure of each current [9]; Mean stream length (Lsm), is a property related to the size of the components of the drainage network and the surfaces of its basin that contribute [7], is obtained by dividing the total length of the segments of the network by the number of currents [Table 2].
The indicators of the drainage pattern are: Form factor (Rf), which is the relationship between the area and the length of the basin. It is an indication of the responses to runoff and the shape of the basin. The ranges are between 0 and 1, the lower the value of the elongated form factor, the basin will be and the flows that will be experienced will be lower and of longer duration [9]; Elongation ratio (Re), is defined as the ratio between the diameter of a circle of the same area of the basin and the maximum length of the basin. The values close to the unit are associated with areas of low relief while the values close to zero are associated with areas with high relief and steep slope, can be grouped into three categories: Circular (> 0.9), Oval (0.9-0.8), elongated (<0.7) [28-30]; Circularity ratio (Rc), is the relationship between the area of the basin to the area of a circle that has the same circumference as the perimeter. The low, medium and high values indicate the young, mature and ancient stages of the life cycle of the basin [26]; Density of drainage (Dd), is defined as the length of currents per unit area. It is an excellent indicator of the permeability capacity of the basin. The values of the indicator help to define the permeability capacity in low (> 3.5), moderate (3.5-1.8), high permeability (<2.0) [9]; Stream Frequency (Fs), corresponds to the number of flows per unit area. It depends on the lithology of the basin and reflects the texture of the drainage network. It is directly associated with Dd [9]; Drainage texture (Rt), is the relationship between the number of currents of all orders perimeter. It is classified as thick (> 4), intermediate (4-10), fine (10-15), and ultra-fine (> 15) [27]; Relief ratio (Rh), indicates the general inclination of the basin and is an indicator of the intensity of the erosion processes, the high values of the indicator correspond to steep slopes and high relief [28-30]. Table 1 presents the parameters and the formulas to calculate them.
The determination of the morphometric indicators was carried out through systematic analysis with ArcGIS software, several thematic layers with necessary information were created. The process was carried out in the following manner: a) the study basin was delineated, for which cartography of the streams was used in Shapefile format (scale 1: 100,000 available at: http://www.siac.gov.co /) and digital elevation models DEM (available at: http://srtm.csi.cgiar.org/); b) DEM data from the delimited watershed was imported into ArcGIS 10.3 with which parameters were defined: slope, orientation and relief maps; c) with the drainage layer, the ordering of the flows was carried out according to the Strahler technique [26]; d) The characteristics of the basin as area, perimeter, length of the basin and length of the currents were obtained with the GIS tools. Morphometric parameters such as the mean slope of the basin, average length of the water network, Form factor, Elongation ratio, Circularity ratio, Drainage density, Stream frequency, Drainage texture and relief ratio were evaluated with mathematical formulas presented in Table 1 [9, 26, 28-30].
2.3 Curve number and potential infiltration
The Curve Number method is used to estimate the potential of Infiltration (S) and Runoff (Q) that is produced by a Precipitation (P) on a basin. Its foundation relates an equality between precipitation and runoff real with potential. It is applicable when the Precipitation is greater than the fraction of retained precipitation, that is when the precipitation sheet is greater than the initial capacity of soil retention (Ia); if P > 0.2Ia, the method is applicable; if P≤0.2Ia, then there is no runoff (Q = 0), the method is not applicable [31].
The Curve Number (CN) is a dimensionless value that is determined when evaluating fundamental aspects of the territory such as the uses and treatments of the soils, the type of vegetation cover, the hydrological condition of the soils and the previous moisture.
CN, has an inverse relationship with the infiltration (S), it has been possible to relate as shown in Equation (1):
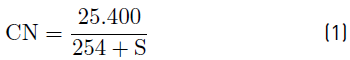
The values adopted by CN are between 0 and 100, which makes it possible to determine more accurately and easily than S, which can have values between 0 and infinity. It can be expressed numerically as shown in Equation (2):
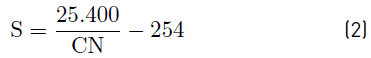
Representing the maximum water retention in millimeters due to the effects of soil capture related to its granulometry, effects of the vegetation cover and the existing moisture conditions [13, 32].
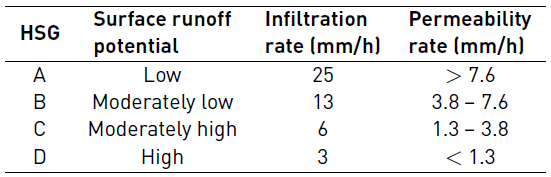
The method classifies the soil hydrological groups (HSG) into A, B, C and D, according to their infiltration rate. A refers to soils with coarse grains, sand type and sediments with a high infiltration rate, up to D, which correspond to expansive soils when they are humid. Table 2 presents a summary of the characteristics of the HSG [13, 31].
The coverage of the land and its uses have a direct impact on the hydrological response and the initial abstraction, refers to the type of cover that presents the soil layers and the mechanical treatments of the same for agricultural and urban uses. This factor is very changeable due to external conditions. The method defines the uses and coverage as urban areas, forests, pastures, meadows, crop soils, bare soils, among others. Forest-type forest cover improves water regulation conditions by improving soil moisture conservation capacity so that the water flow enters the subsoil, by increasing the surface's rigor, infiltration channels provided by the root systems of the soil, plants, likewise provides protection from rain, preventing erosion, in addition to the increase of organic matter in the soil, improving its structure [33].
In turn, land cover and uses can be classified according to their hydrological conditions. The hydrological conditions of the vegetation cover, is considered poor when less than 50% of the area is covered vegetation, average between 50 and 75% and good conditions with values greater than 75% [34].
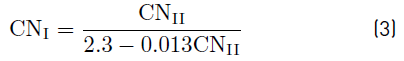
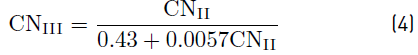
The antecedent moisture conditions (AMC) represent the hydrological response of a basin to precipitation when it has accumulated water from events that occurred five days before. The accumulated values that are between 0 and 36 mm are considered dry conditions, for the values between 36 and 53 mm average conditions and for accumulated events greater than 53 mm, they are considered wet. Equation (1) reflects a CN for an average condition (CNII), for dry and wet conditions Equations (3) and (4) are presented, respectively [13, 31]:
For the determination of CN and S, information layers in Shapefile format were used (scales 1: 100,000), obtained from the National Geographic Institute (IGAC) and the Colombian Environmental Information System (SIAC). The layers used were those of Drains, Hydrogeological Zones, Geology of Sucre, Coverage of soil, Land Uses (Available at: http://www.siac.gov.co/ and https://geoportal.igac.gov.co/). The methodology was carried out with the following steps: a) The information was processed according to the layers of land uses and covers delimit with the basin. With this layer, the respective classifications (Subclasses) were made according to the parameters of the method identifying the zones corresponding to urban areas, forests, crops, bodies of water, pastures, bare soil, secondary vegetation; b) On the soil types layer, the hydrological groups (HSG) corresponding to the lithological characteristics were defined; c) Defined the Subclasses and HSG maps, the geo process of intercepting both layers was performed to unify the information, by means of the ArcCN-Runoff extension of ArcGIS [35], the respective CN values were obtained, d) by means of the Equation 2 the respective S values were calculated and the thematic maps were elaborated. An average AMC was considered for the study area.
3. Results and discussion
3.1 Morphometric indicators
The results of the morphometric indicators of the Arroyo Grande basin are shown in Table 3. The water network is of the sixth order, classifying the basin as well drained and with good response to runoff. The number of streams in the water network is highest in the first order flows, and a decrease occurs as the order of classification increases. The shape of the water network is detrital or branched [Figure 1], this type of flow patterns is developed in areas with moderate to low slopes, of medium rainfall, with low vegetal cover, varied lithology with moderate permeability and homogeneity in the soils. The average slope of the water network has low values, which means lower water displacement speed, therefore a longer concentration time and contact with the soil, increasing the possibility of infiltration.
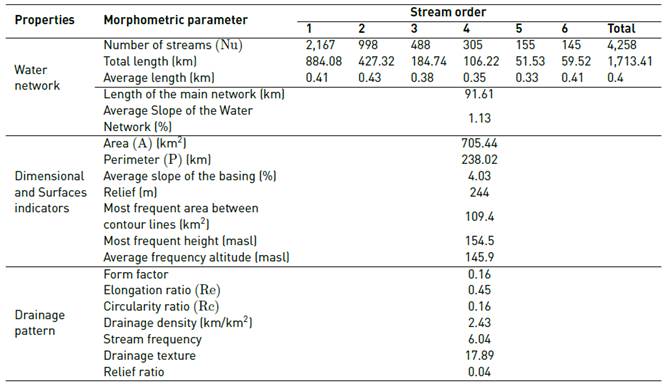
The properties of the surface indicate that the basin is of medium to big size according to the drainage area, with an average slope of the low to moderate terrain and a low relief, from which it is possible to infer that the basin presents homogeneity at a climatic and ecological level [Table 3]. The spatial variation of the relief presents in Figure 1. High inclinations towards the north are appreciated, indicating high erosive potential in that zone, on the litho-stratigraphic units Sincelejo and Morroa; At the same time, there are low ranges in most of the basin towards the south-central zone, on the Betulia formation.
The Hypsometric property is a convenient and objective way to describe the relationship between the altimetric characteristics and the surface of the basin. The hypsometric curve of the Arroyo Grande basin is presented in Figure 2, a normal mass distribution with respect to height is observed. The shape of the curve in S corresponds to a typical shape of a basin in equilibrium or mature stage. This condition is typical of basins developed on relatively homogeneous rocks. It can be said that the processes of erosion, runoff and the contributing slopes are stable; that is, a system of slopes, channels and slopes has been developed more efficiently by reducing the reduction of land mass by the available drag forces, which allows it to balance against the resistive cohesion forces maintained by the bedrock, soil and vegetable layer [7].
The indicators of the form factor, elongation ratio and circularity ratio, show values lower than 0.5 indicating that the basin has a pronounced elongated shape, with slow and long-lasting responses to maximum runoff. These conditions indicate that there is a potential capacity for water regulation and low vulnerability to flooding.
The drainage density (Dd) classifies the area as moderately permeable. This indicator along with a low relief ratio (Rh) shows high groundwater prospects, relating the basin to modestly steep or mountainous areas. This characteristic is presented to the North of the basin, towards the Central and South zone lower slopes are presented. The drainage texture is considered very thin (Rt> 15), indicating homogeneity in soil materials and sparse vegetation. Above the basin there are not zones of natural drainage controls, in addition there is low humidity and high evaporation with a marked west orientation, since the sun's rays are in that direction in the hottest part of the day. From the behavior of the drainage network, the values of texture and drainage density, moderate erosion characteristics are inferred due to the effect of dragging the surface of the land in the northern part of the basin and towards the middle and lower zone.
The results of Morphometry indicate that the basin has a good capacity to capture rainwater due to its considerable area. Similarly, its development stage indicates that there is a balance in the processes of runoff and infiltration that can favor the processes of water regulation, even so, if these conditions are affected, the responses to the hydrological processes will change. It is important to consider that the dynamics of circulation of surface water presents higher speeds in the northern zone, increasing in this area an erosion potential, where the soils with permeable textures are located; towards the center-south zone, the circulation is of low speed due to relief less pronounced. The vegetation cover is low and the soil types are mostly homogeneous of fine textures.
3.2 Estimation of CN y S
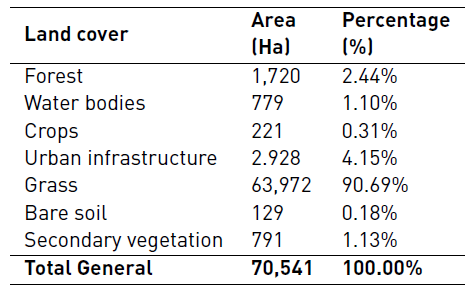
The information of the land cover in the Arroyo Grande basin was adjusted according to the CN method [34], in seven subclasses representative of the study area shown in Table 4. There is a predominance of pasture occupying approximately 90% of the area total area. The treatments and uses of the zone are of cattle and agricultural type in its great majority. These conditions do not allow the initial water abstraction processes to be favorably presented and allow the hydrological condition of the cover to be classified as poor. Within the subclasses, gallery-type forest formations are present in the margin of the water currents.
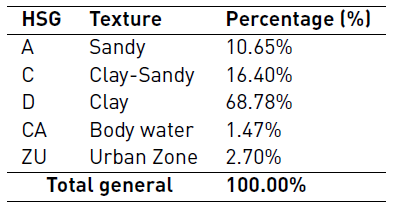
With the soil layer, the hydrological groups (HSG) were defined according to the lithological characteristics and their different infiltration rates. Table 5 shows the classification according to the method [36]. The composition at a general level is of clays, which were defined as type D with approximately 68% of the total area, and occur in the Central and Southern zones known as the Sabana subregion; To the North there are consolidated and little consolidated sandstone formations, which are classified as type A. This area is related to the Montes de María sub-region that make up the hills of the San Jacinto mountain range; other types of soils are arcillolitas and mixed sandstone that were classified as C. The rest of the area is defined as urban zones (ZU) and bodies of water (CA).
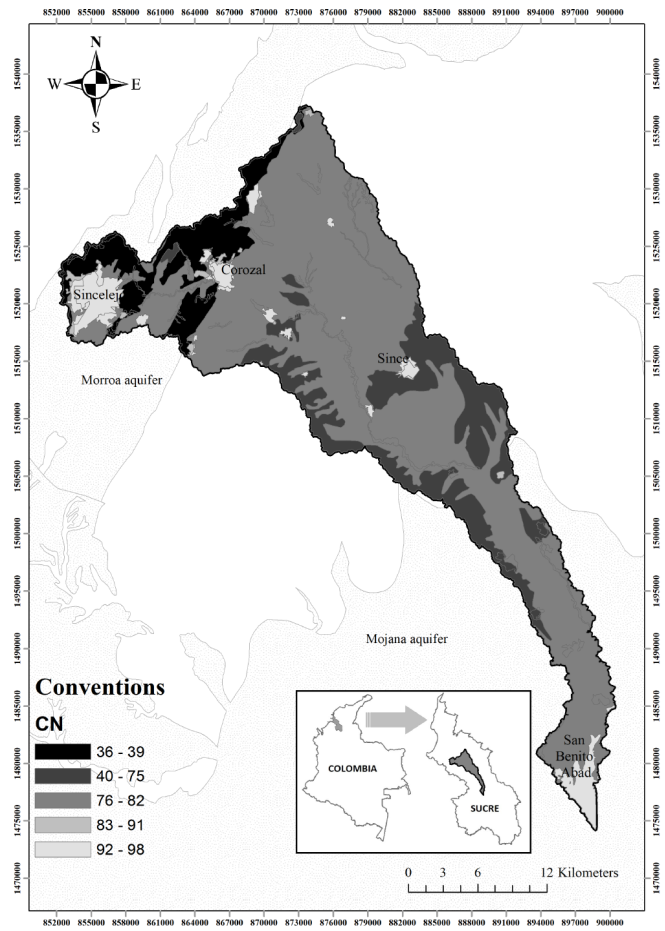
Performing the interception procedures between the information layers of Subclasses and HSG, the CN values were obtained, by means of the ArcCN-Runoff extension of ArcGIS. The results are shown in Table 6 and its spatial variation is presented in Figure 3. It is evident that in 73.21% of the area of the basin, corresponding to 51,639 Ha, it presents CN ranges greater than 80, which are detailed in the infiltration conditions product of the scarce vegetation cover as naked areas and pastures, as well as very fine HSG (C and D). Considering the CN as an indicator of the hydrological pressure of the area, it can be considered that the infiltration presents an affectation of more than 80%, enhancing the surface runoff, the risks of erosion and degradation of the soils.
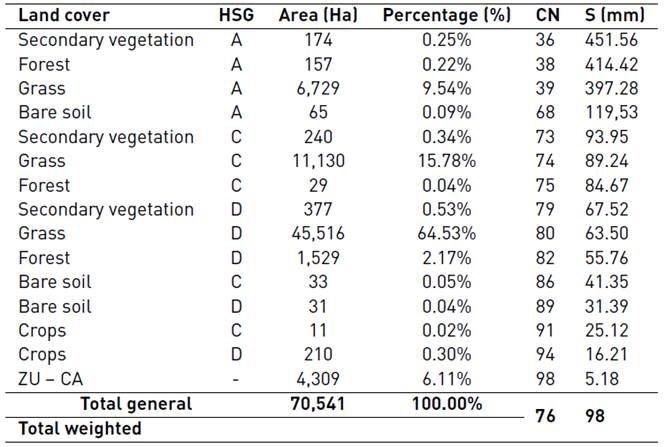
With the CN values, S was estimated for the study basin, the results are presented in Table 6. The variation of S is inversely proportional to CN. The North zone shows the best infiltration potential of the basin with ranges between 119.53 and 451.55 mm, corresponding to 10% of the total area (7,060 Ha), indicating a high potential for underground flow, over this area the Morroa aquifer is intercepted, where the areas that favor recharge are identified. HSG type A, generated the greatest influence on the results, although the conditions of vegetal cover are unfavorable. It is inferred that, by improving the coverage variables of the terrain with vegetation of the shrub zone (forest), the infiltration conditions are considerably improved and with this the recharges of the aquifers. It is important that the areas identified with high infiltration potential present land uses that do not affect the hydrological conditions and do not generate risks in the quality of both surface and subsurface water, therefore, plans for protection and social management for the care must be made.
The results obtained are comparable to those presented in previous studies by different methods. Punctual tests of infiltration and permeability rates showed moderate conditions towards the area of the populated centers of Corozal, Morroa, Palmitos and slow conditions towards the south of the center of Sincelejo [24]. Similarly, water balances indicate effective infiltration rates between 34 to 81 mm above the recharge area of the Morroa aquifer [18, 37]. Also, Hydrogeochemical methods present infiltration values similar to those presented by the method [20]. It can be said that the methods of Morphometry and CN, with the support of GIS tools, are efficient and complementary to perform analysis of the potential infiltration conditions in semiarid basins, showing a great advantage for being faster and more economical, as well as showing results in a more exact spatial and temporal manner, which significantly helps watershed management and territorial planning.
The results obtained from the infiltration are based on the information obtained from the cartography available in the national institutes. It is possible to expand the level of detail by analyzing the information of the vegetal cover, as the most changing factor, by means of available methods such as remote sensing and thus be able to make estimates of the variation of the factor in different climatic conditions, such as in winter or summer.
4. Conclusions
10% of the total basin has high Infiltration potential, therefore good characteristics of initial capture and storage of rainwater, specifically in the North zone, which intercepts the Morroa aquifer. The characteristic is given to a greater extent by the conditions of the soils, because the vegetation cover is poor. The highest speeds in the circulation of surface water are present in this area, so the water regulation process must be improved by carrying out actions that optimize the retention conditions.
The largest area of the basin (73.74%) has low Infiltration capacity, which favors surface runoff, generating low use of rainwater and promoting erosion in soils.

