


 English (pdf)
 Article in xml format
 Article references
 Send this article by e-mail
 Cited by SciELO
  Cited by Google
  Similars in
SciELO
Similars in
SciELO  Similars in Google
 Permalink
1. Introduction
The lateral acceleration of a vehicle, one of the most influential factors in road design [1] and road safety [2, 3], is influenced by three main factors: curvature, vehicle model, and type of road [4]. First, when a vehicle moves in a curved path, it experiments a centripetal force that acts toward the center of curvature. This force, as a conceptual convenience, is sometimes equated to centrifugal force, which is an imaginary force that motorists believe is pushing them outward [5]. Lateral accelerations are sustained by the roadway superelevation, by the side friction or by a combination of the two. Second, the lateral acceleration also depends on the vehicle model; for example, bigger cars have different performance and are subject to higher magnitudes of forces on curves than smaller ones. The behavior of the driver contributes to those differences [4] because they act according to the information that they get from the road, environment, vehicle, and themselves. Third, the values of lateral acceleration also depend on the type of road. Two-lane roads have higher lateral accelerations than six or four-lane roads [1]. Despite many variables involved, lateral accelerations represent the most direct [4] and objective measurement of ride comfort [1, 6].
The comfort of passengers is one of the most important advancements made in modern passenger transport [4]. It was studied in several modes of transportation: buses [6-10], trucks [11], light cars [1, 4, 12], and trains [13-15]. Comfort is a complex issue that varies depending on the country, culture, and physical condition of passengers [16]. For example, the results of a research conducted in China cannot be used in Ecuador, or studies based on one mode of transport should not be extended to another. It is therefore necessary to carry out local studies to estimate some variables such as comfort. Having an uncomfortable ride in a vehicle can negatively impact the passengers’ travel experience, affecting the mental and physical fatigue, and increasing the risk of traffic accidents [1]. Comfort depends on a set of different factors: human (as age and sex), environmental (as temperature, noise, and pressure), spatial (as legroom, seat shape, etc.), and dynamic motion [6, 17]. Considering all those factors, comfort can be a subjective state of well-being; however, numerous studies found a way to analyze it directly or indirectly using experimental instruments.
Usually, to obtain the comfort of passengers, studies collect data from the passengers and the vehicle. Passengers choose their level of comfort or discomfort, through a survey or other instruments (e.g., devices, mobile apps, appliances connected to passengers). From the vehicle, the following information is collected: speed data [6], accelerations data (longitudinal, lateral and vertical) [4, 6]], jerk value [7, 13], suspension [18, 19] passenger seat [7, 16, 20], vibrations [11], interior temperature [16, 21] or interior noise [16, 22]. Exterior elements influence this information such as pavement surface condition or superelevation; that is also crucial for road safety. From collected and processed data, several modeling techniques can be applied to obtain equations in order to estimate comfort.
Most of the modeling used constant models [7, 12, 23], linear regressions models [15, 20], or Structural Equation Modeling (SEM) [16]. Constant models generally use the Root Mean Square (RMS) value of the weighted-acceleration signal in three axes, which is described by the international standard ISO 2631-1. Linear regression models are mainly used for one predictor, since SEM is used for a more complex analysis or combining more predictors. SEM predicts the relationship between independent and dependent variables, and establishes if these are correlated to one another [24]. In current practice, the first two models are widely extended, while the equations used under the SEM model are under development; moreover, there is no known study in Latin America about comfort riding, especially on mountain roads.
Given the impact of comfort and lateral acceleration on road design, and considering ride comfort varies between countries; this paper aims to analyze the relationship between passenger's comfort and lateral acceleration in two-lane rural mountain roads in Ecuador. Two research questions led the study: Do the characteristics of the passenger (age, sex, stress level and physical pain level) influence comfort? Does the speed of the vehicle affect the passenger’s comfort? In the case of the first question, the study evaluated the age and sex [17] of passengers, as well as their sensation of pain [4], and its impact on their comfort. In the case of the second question, car speed could affect comfort because it is related to dynamic motion factors. As a result, eight models were calibrated using lateral accelerations; 5-points comfort values, stress and speed. Besides, some comfort differences were found between right and left horizontal curves.
To present the results, the rest of this paper is structured as follows: Section 2 offers an overview of the experimental development, describing the road selection, the subjects, the data collection and data processing. Then, section 3 presents the analysis between comfort and other studied variables. The final part highlights the principal conclusions, explaining the limitations and contributions of the study.
2. Experimentation
This study focused only on the forces and vibrations experienced directly and physically by passengers and ignored other factors (e.g., interior temperature feeling). Consequently, the notion of comfort in this paper will be limited to mechanical disturbances, due to driving or mechanical motion factors on a horizontal curve. The experimentation section describes the materials and methods used in this investigation. It begins with the road selection and details about the participants. Then, it refers to the data collection process, describing the used tools and the process itself. Finally, it explains the data processing to understand how to obtain the comforts, speed, lateral acceleration and curve radius.
2.1 Road selection
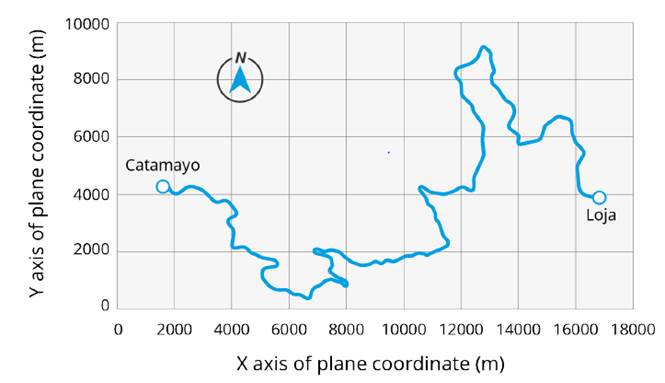
The chosen road was the two-lane rural road between the cities of Loja and Catamayo (see Figure 1]. It is located in southern Ecuador, in the Andes. Thus, the road has complex topographical, geological and hydrological characteristics. This road has a distance of 26.5 kilometers, two lanes of 3.65 m each, and a shoulder of 0.6 m on each side. The roadway surface has an asphalt binder in excellent conditions.
2.2 Subjects
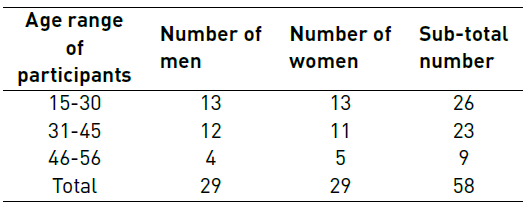
Sampling was not probabilistic and intentional. As a result, 58 subjects participated in the study, as seen in Table 1. Generally, it allocated three to four passengers on every trip, besides the driver. The 50% distribution between men and women was intentionally requested, given the sex population distribution in the city and the country [25]. Participants had a wide age range (15-56 years).
2.3 Data collection instruments
The test vehicle was the Nissan Frontier AX pick-up. The stability of this car was mechanically inspected (i.e., suspension, tires, fluids), and the seats were checked/corrected before performing the trips. The vehicle had onboard equipment for collecting the speed and acceleration data. Participants on the study vehicle made round-trips on the tested road while answering the survey.
Data collection included four groups of variables: car speed, car lateral acceleration, curve radius of horizontal alignment, and passenger comfort and its characteristics. It continuously recorded the speed acceleration and the trajectory during the trips with the Video VBOX Lite. This equipment has a DGPS signal receiver (antenna) which was located at the center of the car roof. The Video VBOX Lite links the receiver information to an audio-video system since it has cameras and microphones. It calculated the curve radius of the vehicle trajectory. There were 104 horizontal curves between 40 and 600 m of radii.
The survey was handed out on board and was self-administered. It assessed the comfort of the passenger by using a 5-point Likert scale survey: very uncomfortable, uncomfortable, undecided, comfortable, and very comfortable. It evaluated only the comfort in the horizontal curves of the route. This survey also included information related to the driver: age, sex, stress level and body pain level. Stress level also had a 5-point Likert scale: no stress, some stress, undecided, stressed and very stressed. Physical pain level had a similar scale: no pain, some pain, undecided, with pain, intense pain.
2.4 Data collection process
The Video VBOX Lite was installed in the test vehicle. It includes two cameras, two microphones and one antenna. Each participant knew about the academic purpose of the collection data. The survey was delivered to each participant. There were 15 round-trips with a maximum of 4 participants per journey. It collected the data during the daylight, with favorable weather conditions (sunny without fog or rain). During the trip, the car driver mentioned in advance which horizontal curve they were going to assess. Once they were in the middle of the selected curve, the participant picked their level of comfort or discomfort in the survey.
2.5 Data processing
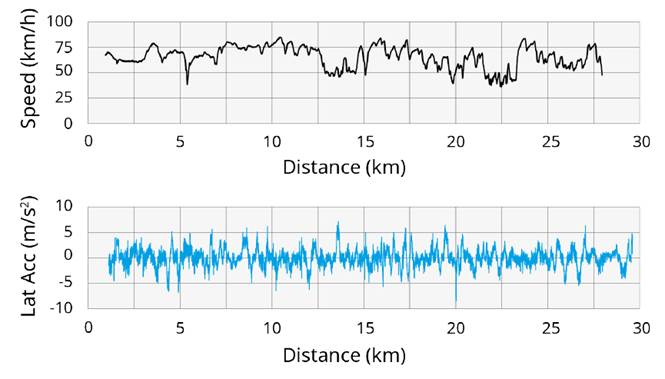
Every trip recorded speed and acceleration data (for example, trip N°1 in Figure 2]. It linked the horizontal curve to comfort levels, speed and lateral accelerations, by using the voice and video recordings of the equipment. The lateral acceleration data were quite variable within the curve; thus, it calculated the average accelerations as a representative value. Other studies used the maximum values in their analysis [1, 4]. It assigned numerical values to the answers in order to analyze the survey quantitatively. Regarding comfort: 1=very uncomfortable, 2=uncomfortable, 3=undecided, 4=comfortable, and 5=very comfortable. Stress level: 1=no stressed some stress, 2=undecided, 3= stressed, and 4=very stressed. Physical pain level: 1=no pain, 2=some pain, 3=undecided, 4=with pain, and 5=intense pain. Sex: 0=man and 1=woman.
3. Results and discussion
This section describes the results of the analysis between lateral accelerations and the passenger’s comfort. First, it evaluates the relationship between the characteristics of passengers (age, sex, stress level and physical pain level) with comfort averages. Then, it analyzes the lateral acceleration, the speed with comfort.
3.1 Lateral acceleration versus comfort using SEM
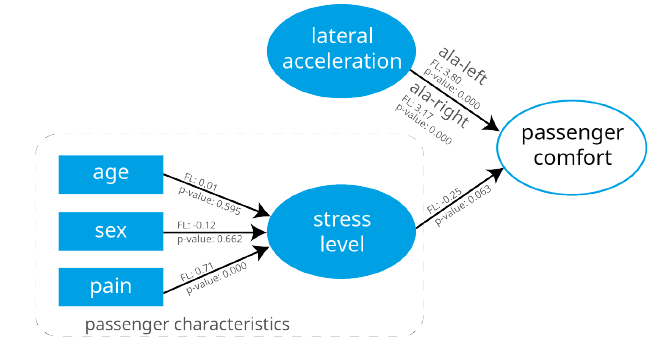
The SEM was used to analyze whether comfort depends on the characteristics of the passengers (age, sex, stress level and passenger pain level) and lateral accelerations. SEM has been previously used to model passenger comfort on railways [16]. The LISREL 10.2 software was used to apply the SEM [26]. Before this, an initial model was conceptualized, as shown in Figure 4, presuming relationships between lateral variables. In this case, the age, sex, and level of pain affect the stress level. This level, along with lateral acceleration, influences the participant's comfort. Lateral accelerations are the average of left curves or ala-left (horizontal curves that turn to the left in the driving direction), right curves or ala-right (horizontal curves that turn to the right in the driving direction) and both or ala. Other variables can affect comfort; however, they are beyond the scope of this research.
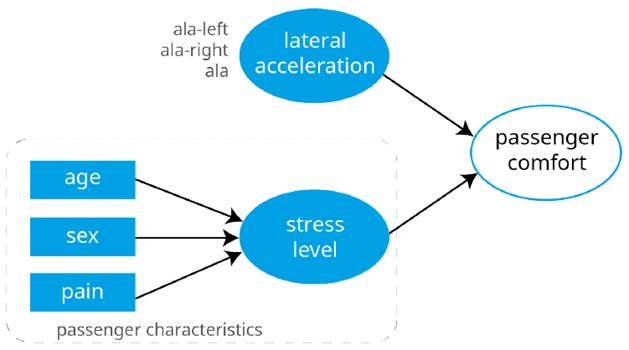
Table 2 shows the correlation and covariance matrix of the conceptualization variables. The variables that have higher correlation values (>0.8) are ala-left and ala-right with ala. In this case, there is multicollinearity, because the lateral accelerations in left or right curves are related to the average of the horizontal curves. Therefore, ala could not be with the other lateral acceleration variables in the same model. The variable age has the highest variance of 106.181. The total variance is 110.451 (largest eigenvalue = 106.438; smallest eigenvalue ≈ 0), generating a condition number of 971.427, which indicates multicollinearity (in linear regression).
Table 2 Correlation (upper) and covariance (lower) matrix of the variables
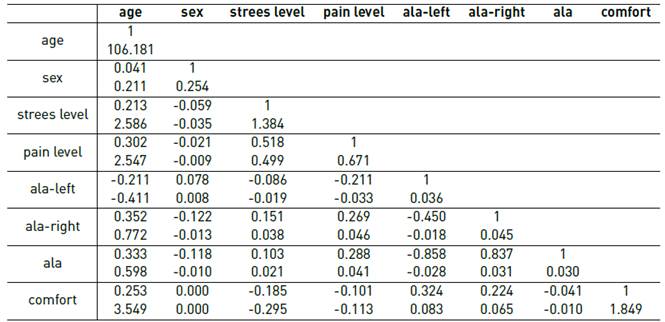
ala-left = average lateral acceleration in left horizontal curves, ala-right = average lateral acceleration in right, horizontal curves, ala = average lateral acceleration in horizontal curves.
Initial model-fitting process
To fit the initial model, the maximum likelihood method (α=0.05) was employed to estimate SEM using the LISREL 10.2 software. The average lateral acceleration (ala) was ruled out due to its low value of factor loading and T-value (-0.17) and presented multicollinearity with ala-left and ala-right factors. Therefore, Figure 5 shows the variables’ loading factors in each model and its level of significance (p-value). In the model of the stress, the age and sex have little statistical significance, but not with pain, which explains about 70% of the variance of that model. Another research found some differences between sex in the symptoms of motion sickness [17]. In the second model, both lateral accelerations are predictors of comfort. Lateral accelerations of left curves are negative; therefore, the factor will also be negative. On the other hand, the stress level is also significant for comfort, but in a more moderate proportion than the previous ones. This relationship makes sense: when the level of stress is low, the comfort would be high, and vice-versa. Based on this analysis, the initial model must be adjusted through the SEM.
Adjusted model fitting
To decide whether to accept a model, the Goodness of Fit Index (GFI) and the Adjusted Goodness of Fit Index (AGFI) were used. Generally, these factors were employed to verify the reliability and validity of a model in the SEM. Other statistics are also useful, such as the Root Mean Square Error of Approximation (RMSEA), the fit indexes, Hayduk's blocked-error. The initial model had a GFI of 0.91, while the AGFI was 0.489. A model is accepted when these two values are equal to or greater than 0.9. In this case, even though the model is reliable, it is not valid. The accumulated variance was 3.99, and the condition number was 11.69, removing the age and sex factors; therefore, there is no multicollinearity between the latent variables. In this new scenario, four analyzes were performed: 1) removing the age and sex variables, 2) adding the constant in the comfort equation, 3) excluding the stress factor from the second analysis, and 4) removing the constant from the third model. Table 3 shows the structural equations from these analyses.
Table 3 Structural equations for the passenger comfort
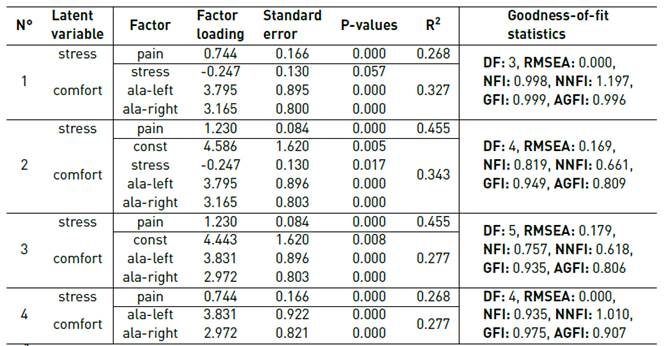
R2: Hayduk’s blocked-error, DF: the degree of freedom, RMSEA: root mean square error of approximation (it should be < 0.05), NFI: normed fit index (it should be > 0.9), NNFI: non-normed fit index (it should be > 0.9), GFI: goodness of fit index (it should be > 0.9), AGFI: adjusted goodness of fit index (it should be > 0.9), ala-left: average lateral acceleration in left horizontal curves, ala-right: average lateral acceleration in right horizontal curves.
As can be seen in Table 3, the structural equations that have the best fit correspond to analysis 4. Analysis 1 also has a good fit and even has a higher R2 value for the comfort model. However, the p-value of the stress factor (0.057) slightly exceeds the adopted value in this analysis; therefore, the models in examination 4 are reliable and valid.
3.2 Lateral acceleration versus comfort including the speed factor
From the previous analysis, it can be concluded that, mainly, the lateral acceleration of curves to the left and to the right influence passenger comfort. On the other hand, the speed of the vehicle on the horizontal curve could increase or decrease its lateral acceleration. The SEM could not be employed due to the multicollinearity between those two factors (speed and lateral acceleration). Therefore, an analysis was performed including the collected speed and grouped them by ranges in order to avoid multicollinearity. First, the database was organized according to the following speed ranges: 40-50 km/h, 50-60 km/h, 60-70 km/h and 70-80 km/h, and the driving direction (right or left). In each subgroup, the average lateral acceleration and comfort was calculated. Positive values belong to curves to the right of the driving direction, while the negative values correspond to left curves. It plotted the acceleration, speed, and comfort data in Figure 5. All statistical analyses were carried out with the Minitab 14.2 [27].
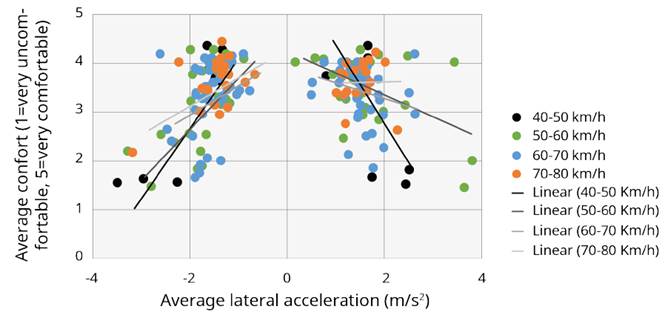
In Figure 5, the data shows that right curves have a different slope than left curves. Also, left curves have less dispersion than right curves. With this data, the lateral acceleration and comfort was adjusted to linear regression, as seen in Table 4.
Table 4 Lateral acceleration and comfort models within several speed ranges
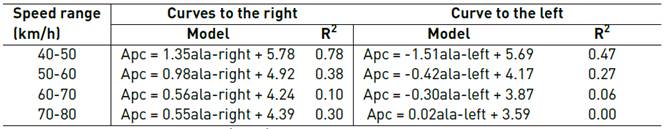
Apc= average passenger’s comfort (1 to 5), ala-left: average lateral acceleration in left horizontal curves (m/s2), ala-right: average lateral acceleration in right horizontal curves (m/s2), R2: coefficient of determination of linear regression.
As can be seen in the fitted models from Table 4, right curves have a smaller slope than left curves, according to the initial observation. Given the dispersion of data from left curves, the R2 values are lower than right curves’ in each speed range. The constant value of the equations in speeds between 40-50 km/h exceeds 5, which should not be possible because this is the maximum comfort value. It is interesting to note that, with the increase in speeds, passengers are unable to reach the level 5 of comfort (very comfortable), possibly due to the risk perception associated with the movement in horizontal curves at high speeds. The lowest R2 values are between the speeds of 60-70 km/h for both curves and between 70-80 km/h for left curves. The last model of left curves gives incoherent lateral accelerations (-129.5 to 70.5 m/s2), so it was discarded.
Using the equation from Table 4, the maximum lateral acceleration values can be obtained in every speed range and comfort condition (see Table 5]. For these thresholds, in the results of the equations, incoherent values were not considered; that is, the positive ones of the equations of left curves, the negative values of right curves, and the values outside the conventional lateral acceleration thresholds.
Table 5 Maximum lateral acceleration values using the equation from Table 4
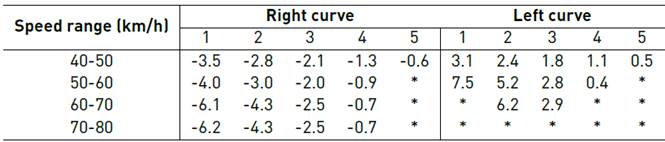
1=very uncomfortable, 2=uncomfortable, 3=undecided, 4=comfortable, and 5=very comfortable, *the result value was incoherent.
China has the following threshold: unbeareable: > 5 m/s2, uncomfortable: 3.6 to 5.0 km/h, relatively comfortable: 1.8 to 3.6 km/h, and comfortable: 0 to 1.8 km/h [1]. Using the absolute value from Table 2 for both curves, the following threshold can be calculated for the current research: very uncomfortable: 3.1 to 7.5 m/s2, uncomfortable: 2.4 to 6.2 m/s2, undecided: 1.8 to 2.9 m/s2, comfortable: 0.4 to 1.3 m/s2, and very comfortable: 0 to 0.6 m/s2. Some of those values are close to the ones from China; however, the numbers of this study are more detailed, since it separates the lateral accelerations of right and left curves.
AASHTO established three maximum values to avoid driver discomfort. These values, based on the Ball-Bank indicator measures, combined the effect of centrifugal force, roadway superelevation, and vehicle body roll [5]. These values are 2.1 m/s2 (30 km/h), 1.8 m/s2 (40-50 km/h), and 1.5 m/s2 (55-80 km/h). In this study, higher values were obtained: 3.5 m/s2 (40-50 km/h), and 7.5 m/s2 (50-80 km/h). This happened, possibly because the AASHTO policy used outdated results [3].
Theoretically proposed models of lateral acceleration versus comfort
Some of the models in Table 4 have an acceptable fit to the collected and processed data. However, they need theoretical adjustments to be used in practice (see Table 6]. In these new models from Table 6, the equations between 40-50 km/h have a maximum value of five. The constant of the models between 50-60 km/h was an average between the models for right and left curves, so they intercept in the same vertical comfort point. The same happened in the case of models between 60-70 km/h. In right curves, the equation between 70-80 km/h does not have a significant difference with the model between 60-70 km/h; therefore, just one of them could be used. Based on this assumption, for the last model of the left curve, the model with the highest value of R2 could be taken for both speed ranges: 60-70 km/h and 70-80 km/h.
Table 6 Theoretically proposed lateral acceleration and comfort models for this study
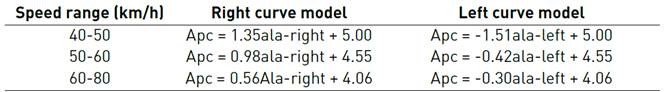
Apc= average passenger’s comfort (1 to 5), ala-left: average lateral acceleration in left horizontal curves (m/s2), ala-right: average lateral acceleration in right horizontal curves (m/s2).
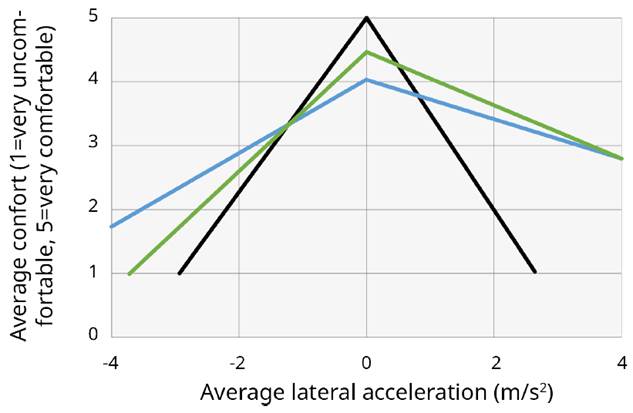
The results of models of Table 6 were plotted in Figure 6. The slopes get flat as the speed increases. In each speed range, the comfort values decrease, which was observed previously in the data.
4. Conclusions
This article aims to find the relationship between passenger comfort and lateral acceleration in two-lane rural mountain roads. In all equations, lateral acceleration was a predictor of comfort, which is consistent with previous studies. After analyzing the results, the following conclusions are presented:
Speed impacts passenger comfort. When the speed is low, passengers can reach the highest level of comfort, while at high speeds, they reported lower levels of comfort. In general, high speeds could be reached in curves with a big radius, so it is expected that the normal reaction of a passenger will be to feel unsafe. However, if the curve has a small radius and the vehicle drives at a high speed, the passenger will feel the centripetal force more and, consequently, more discomfort.
The direction of the curve influences the passenger comfort election. They perceived right curves differently to left curves. Left curves had higher lateral accelerations values than right curves, in speeds between 50 to 80 km/h. With these new results, the recommended threshold values for lateral acceleration should consider more than one value. On the other hand, the only passenger characteristic that was statistically significant was the stress level.
This study has several limitations. First, it was performed in just one mountain road, which would be different from another road with more complex alignments. Second, the results of this research apply for the study vehicle, since the lateral acceleration differs from one car to another. Lastly, it used the average values and not the maximum lateral acceleration values, which can modify the calibrated models.
Despite these limitations, this paper can help researchers, designers, and managers to understand the relationship between lateral acceleration, speed, the direction of the curve, and passenger comfort on mountain roads. Increasing comfort could lead to reaching significant levels of road safety. Even though comfort is a subjective concept, it can be linked to the objective measure of lateral acceleration. Finally, this research proposed threshold values for lateral acceleration in mountain roads in a Latin American country.

