


 English (pdf)
 Article in xml format
 Article references
 Send this article by e-mail
 Cited by SciELO
  Cited by Google
  Similars in
SciELO
Similars in
SciELO  Similars in Google
 Permalink
1. Introduction
The concept of smart cities involves the intensive use of technology in the city design aiming to connect people, information and urban elements, in order to develop sustainable, competitive and innovative urban environments, improving the population's quality of life [1-2]. To be classified as “smart”, several other factors besides transportation need to be considered in a city (such as education and governance). [3] claim that smart cities are based on three pillars of urban management: governance, energy and transportation. Regarding transportation, the authors explain that smart cities must ensure an effective “mobility” of people and cargo.
However, in Brazil, the freight transportation could hardly affect the adequate design of smart cites due to the challenges faced by this sector that influence the urban areas. The structural inefficiencies negatively impact on: (i) the economic dimension, by losing competitiveness, increasing of “Custo Brasil” index etc. due to logistics issues; (ii) the environment, since this sector, for instance, was the main source of anthropogenic CO2 emissions in 2017, accounting for 45.8% [4]; and, (iii) the society, directly (by congestion, for example) and indirectly as reflections of environmental issues (e.g. pollution increases public investment on public health), generating negative economic impacts (inefficiency reflects on employability and income distribution, for example).
In this context, scientific and governmental studies [5-9] point out the logistics integration centers (LICs) - i.e., facilities that mainly promote intermodality and may (or not) offer additional logistics services, such as transshipment terminals and logistics platforms - as key elements to improve the efficiency of the Brazilian logistics system. However, they must be located at strategic points of the national territory.
Therefore, we believe that the use of mathematical models dedicated to the facility location in the freight transportation system could help (even indirectly) the governmental planning and public policies propositions aiming to develop smart cities. Thus, this paper aims to determine the optimal location of LICs dedicated to the soybean transportation by the application of the [5]’s mathematical model.
It is important to highlight that facility location is a strategic decision that, from the transportation planning perspective, could allow modal shift and multimodality impacting in the efficiency of different supply chains (and urban areas, as well). As a result, the use of higher capacity alternatives could provide improvements in city planning design considering the transportation flows: for instance, it could reduce the traffic of heavy vehicles in the main soybean port zones and emit less CO2. Thus, the optimal location of LICs might support smart city planning in the Brazilian context. It is relevant to mention that this paper is an extended version of [6], presented at ICSC-CITIES2019.
The model was applied considering the Brazilian soybean transportation, due to the relevance of this product in the Brazilian economic matrix: according to the National Supply Company - CONAB, soybean accounted for 52% of total grain production in Brazil in the 2017/18 harvest and, as the production increased in the 2018/19 crop, the country became the world's largest soy producer, surpassing the United States [10]. The context of transportation is also justified by the fact that the logistics cost represents 12.3% of the Brazilian Gross Domestic Product - GDP, compared to a cost of 7.8% in the United States [11]. Transport accounts for the largest share of this cost [12], having consumed 6.8% of GDP in 2015 [12] and 6.6% in 2016 [11]. In addition, [13] argues that the improvement of logistics infrastructure is a key factor for the recovery of the Brazilian economy, given its systemic impact on other sectors, especially in the mining, agriculture and beverage industry.
Back to the literature, [14] perform a review comparing the development of Brazilian and Portuguese smart cities and show that, although it is a subject of interest, the development and design of smart cities in these countries are still limited. It reinforces the importance of studies that might contribute for the development of smart cities in the country, even if we are looking at only one dimension: the transportation (especially, related to facility location).
According to [15], the literature about smart cities usually focuses on the general concepts, internet of things or big data and hardly ever studies about planning of smart cities. Additionally, even “zoning and location” being pointed out as one of the key factors of smart cities’ design [3], a search made using Web of Science and Scopus databases, with the keywords “facility location” and “smart city” (and their variants), on October 6th 2020, at 6:48 p.m., has found only four papers published at scientific journals [3, 15-17] and directly related to the subject. Using Scopus, eight other papers published at international conferences were found.
About the papers published in scientific journals, [3] propose a mathematical framework aiming at optimizing the zoning, land-use allocation, location of new facilities (schools, hospitals and offices) and transport network design, in order to better conduct investments in smart cities infrastructure, from a sustainable standpoint. [16] tried to answer the following question: “how an integrated and landmark transport interchange contributes to a smarter, more sustainable and friendly city”? Then, the authors study the “Euraflandres” case, analyzing how intermodal transport infrastructures for passengers, such as city-hubs, can contribute to enhance urban mobility.
Similarly to [3, 17] present a method to support local authorities and state government’s decisions on optimal allocation of based public services and optimal location of new ones; while [15] propose two heuristic approaches to solve the Multi-Service Capacitated Facility Location Problem in the context of smart cities (these facilities to be located should provide services to the population).
Note that these papers are focused on locating urban services (as schools) and providing more efficient transport for passengers. Nevertheless, freight transport can negatively influence the smart cities performance, if the freight flow in urban area is not considered during the city planning. In Brazil, for instance, there are ports located inside the urban area, as Rio de Janeiro and Santos ports, that deal with import and export flows. These flows, when added to the daily traffic of vehicles, might increase the problems with congestion and mobility.
It is important to highlight that the model provided in this paper is also directly related to the “smart territory concept”, since it deals with the transportation planning considering the whole Brazilian territory, i.e., not being focused only on the urban area. Therefore, we are dealing with the challenge pointed by [18] related to leap “smart” planning from the urban to the regional scale.
At last, we emphasize that the facility location literature is largely studied in Operational Research area. State-of-the-art papers dealing with the main mathematical models and solution techniques can be found at: [19-31]. We also found facility location surveys focused on specific areas such as healthcare facilities [32], perishable agri-food chains [33]; and one dedicated to mapping the Brazilian context [34]. However, there is a scarcity of cases applying the models in the smart cities design or in the planning of smart territories.
From this introduction, this paper is divided into four sections: Section 2 presents a description of [5]’s mathematical model, Section 3 shows the parameters of the case study, Section 4 presents our application and discussions, and Section 5 shows the final considerations.
2. Mathematical model of Guimarães (2015) [5]
The location-allocation model presented by [5] is capacitated, multi-product and multi-echelon (although direct flows between origin-destination (O/D) are allowed, without the use of logistics integration structures), which seeks to optimize the total costs by installing LICs that promote intermodality. Besides, the following assumptions are adopted:
LIC is a simplified structure that only allows modal shift. Thus, there is no kind of value addition to the product (as processing, packaging, labeling, etc.);
LICs will be selected from a set of predefined candidates based on criteria established according to the case study;
The flow between the production and consumption zones will only be intermediated by a LIC, if this provides a reduction in the total cost of the network. Otherwise, it will be directly transported from origin to final destination, without passing through a LIC;
If no producer benefits from the installation of LICs with reduced total transportation cost, the LIC shall not be opened;
There is a minimum capacity established for opening a LIC to ensure the economic viability of this facility. Similarly, each LIC has a capacity related to physical and structural limitations; and
Regarding the direct flow, a product must be sent directly to a point of consumption from the point of production in a single way (unimodality). The flow through a LIC, on the other hand, must perform, at least, one modal shift (multimodality).
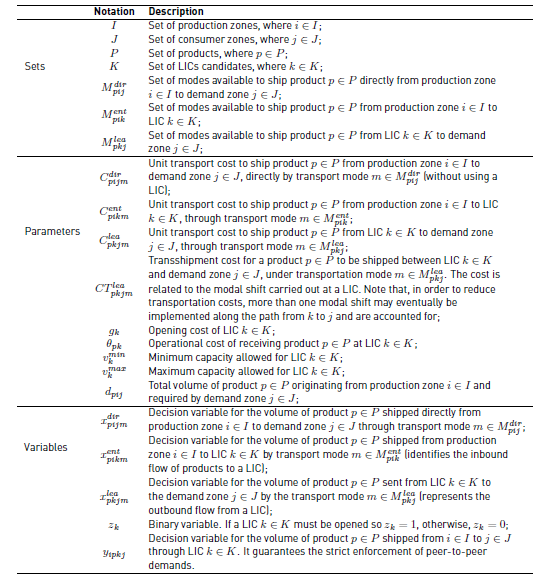
Once the assumptions underlying the development of Guimarães's proposal [5] are known, Table 1 details the sets, parameters and decision variables that compose the model. It is noteworthy that the mathematical model presented by [5] is a refinement of [7], as it imposes the explicit fulfillment of peer-to-peer demands, making it adherent to an economic reality in which suppliers of goods and services are concerned with respecting established contracts; and there may be a relationship of trust between producers and consumers, and customers are not willing to have their demands met by other suppliers [5].
The mathematical model proposed by [5] is described as follow.
Minimize:
Subject to:
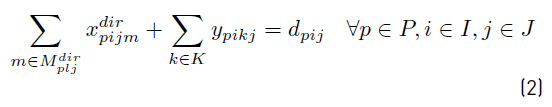
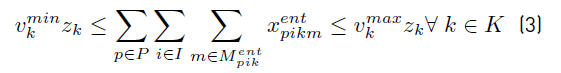
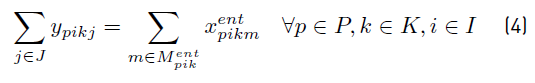
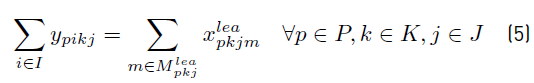
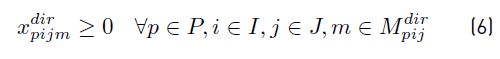
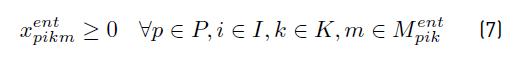
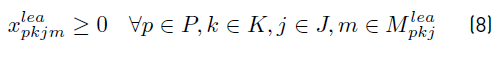

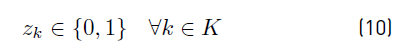
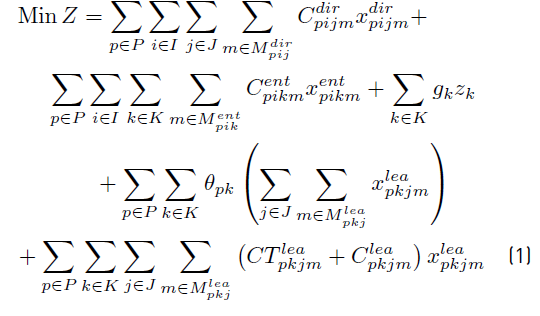
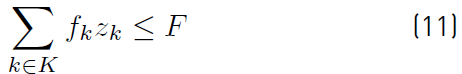
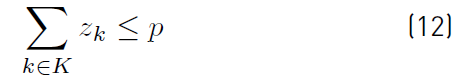
The Objective function (1) minimizes transportation costs, involving either direct shipment costs as well as costs for shipments carried out by LICs. Likewise, opening and operational costs related to LICs as well as transshipment costs are also considered. Constraints (2) ensure that the total demand of any supply zone i∈I must be met, either through direct shipments between corresponding origin-destination zones or through a LIC. It also guarantees that, regardless of using a LIC, peer-to-peer demands must be strictly satisfied. Constraints (3) set lower and upper bounds for the operational capacity for LIC candidates which direct impact the decision of opening a LIC. Constraints (4) and (5) ensure that peer-to-peer demands are strictly enforced. Such a goal is attained by disaggregating inbound and outbound flows at a LIC. Accordingly, the switching of origin-destination pairs at a LIC is thus prevented, even if that turns out to be cost attractive. Finally, the domain of the decision variables is given by Constraints (6) - (10). Besides, Constraints (11) and (12) can also be added to the model. Constraint (11) ensures that there is a maximum budget limit 𝐹 for investment on LICs where 𝑓 𝑘 is the investment to open LIC 𝑘∈𝐾, and Constraint (12) considers that a public policy can be applied where a maximum number 𝑝 of LICs must be respected.
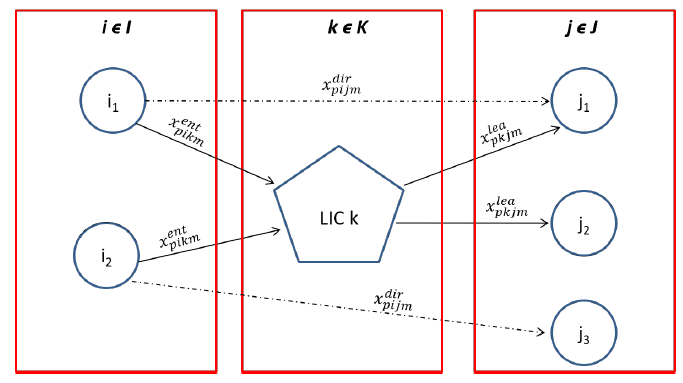
After presenting the mathematical model, Figure 1 illustrates the flows allowed between the echelons, according to assumption number six presented at the beginning of this section. The dashed line represents the direct flows, from a production zone i to a demand zone j. These flows are represented by variables
 in the mathematical model. The non-dashed line represents the indirect flows through a LIC, whose origin-destination matrix should be guaranteed. Then, it is represented by different variables in the model:
 and
and
 that are directly related to
 , as previously explained. Besides, a demand point can receive cargo directly from the production zone (as the pair i2 - j3 in Figure 1], through a LIC (for example i2 - k - j2 in Figure 1] or both (see destination j1 in Figure 1]. The decision will depend on the minimum cost of the network (see Objective Function), respecting the constraints of the model.
2. Case study: Brazilian transportation of soybean
The data were obtained from the georeferenced database of the National Plan of Logistics and Transport - PNLT planned for the year 2031, due to its relevance for Brazil. Developed by the Brazilian Transport Ministry [35-37], PNLT is considered as a key governmental planning that marks the restart of the integrated planning of the transportation sector in the country [8, 38, 39]. With characteristics of a Multi-Year Plan, PNLT estimates the production and consumption matrices of different Brazilian products for the year 2031, indicating the required investments in transport infrastructure to achieve a balanced and low cost transportation matrix [5].
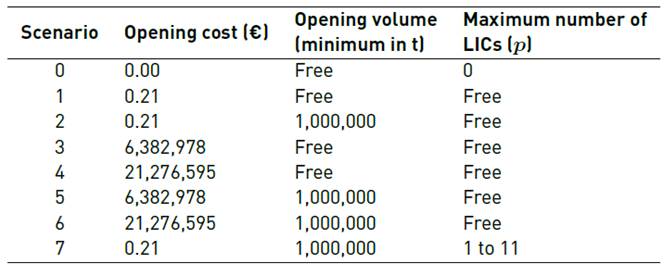
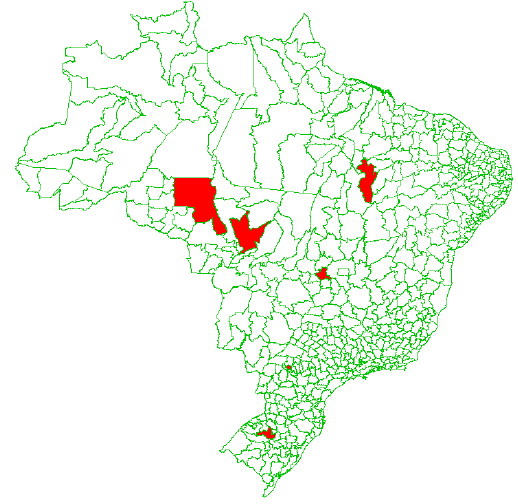
In PNLT, the Brazilian territory was divided into 558 homogeneous microregions (according to Brazilian Institute of Geography and Statistics - IBGE) and there was one additional zone to represent foreign trading (import and export flows), totaling 559 production and consumption zones. Eighty of these microregions (see Figure 2] were pre-selected to receive the LICs (known as candidate microregions). These regions were chosen considering two factors: (i) closeness to the production zone; and (ii) the existence of intermodal connections (i.e. places where transshipment and intermodality can be effectively performed).
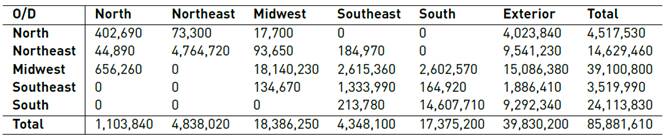
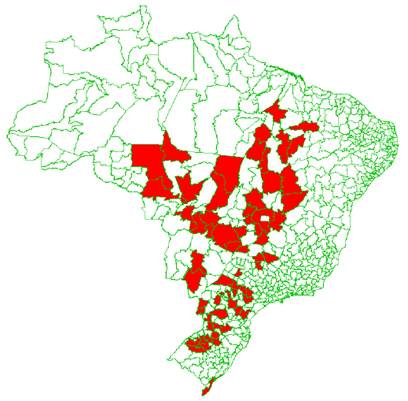
The PNLT multimodal network predicted for the year 2031 already considers the infrastructure projects foreseen in the plan. We established that road would be used as the unimodal alternative for the direct transport (without using a LIC), since almost 60% of the Brazilian freight transportation are done by this alternative, which is often used to transport soybean. In the case of transport through a LIC, the soybean would be destined from the point of production to the LIC by road and, when consolidated, would depart from this facility to the destination using an intermodal option. The soybean production and consumption matrix used in this study, also derived from PNLT, represents its projected production and consumption for the year 2031, based on domestic and foreign market growing expectations. Figure 3 shows the intern consumption and production zones predicted to 2031, while Table 2 shows the flows according to IBGE regions.
Transportation costs between O/D pairs (directly or through the facility) and the LIC operational costs were obtained in [5]. Operational cost was € 1.74/t, including transshipments in the facility. Maximum capacity was not considered, so we can evaluate the size required to the facilities that would be important in other stages of governmental planning. To perform the optimization, eight scenarios were established whose features are described in Table 3.
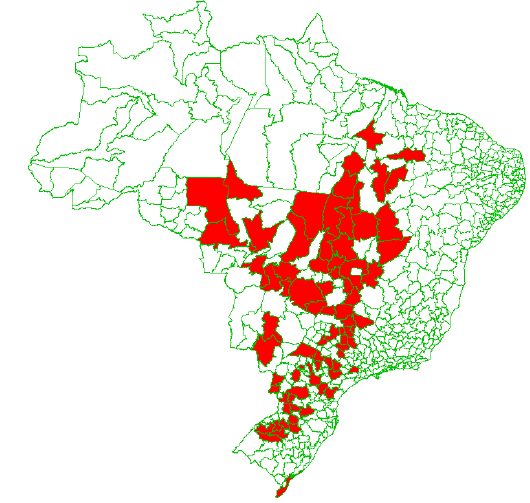
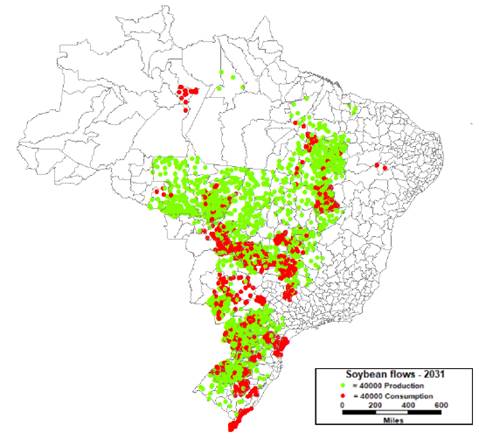
Table 3 Features of each scenario
Note: The costs were converted from real to euro, considering € 1 = R$ 4.70 (quotation from October, 2nd 2019).
To evaluate the reduction of costs obtained with the LICs usage, it is necessary to know the Scenario 0 where any LIC is located (i.e., 𝑝=0 in Constraint 11). It means that all soybean would be transported by road in 2031 with no investment on LICs installation. The environmental and social impacts of this scenario will not be evaluated in this paper, being recommended to future studies. However, we strongly believe that this situation increases the emissions of CO2, the number of accidents in roadways and the traffic in urban areas, implicating negatively in the design of smart cities (especially those that held ports that are main link in the soybean foreign market, as Paranaguá in Paraná state). The results of each scenario and the comparison to the Scenario 0 are presented in the next section.
3. Main findings
The mathematical model was implemented in the Mosel language [40] considering the parameters presented in the previous section (PNLT georeferenced base for the 2031 horizon). For solving each scenario, Xpress IVE solver version 1.24.24 was used on a Windows 10 machine with an Intel® Core ™ i7 CPU @ 3.40GHz and 12 GB of RAM memory. The scenarios took approximately 30 minutes to be solved and maps were created using TransCAD software to show the results. It is important to highlight that, although the [5]’s model is multi-product, the case analyzed here only considers just soybean flows. The results of the scenarios are summarized in Table 6 at the end of this section.
The difference between Scenarios 1 and 2 is that the last one imposes a lower bound to the facility capacity, which means that a LIC is opened if it receives at least 1,000,000 t of soybean (lower bound for the volume). In both of them, the initial investment to open a facility is symbolic, since it is believed that the government would locate the integration structure independently of its costs, because it is known as a key element of the logistics networks that would provide greater efficiency levels to the transport sector.
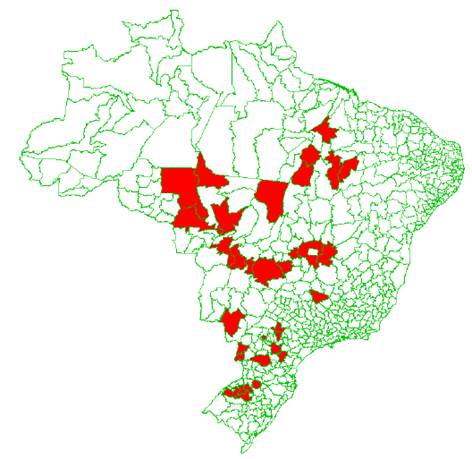
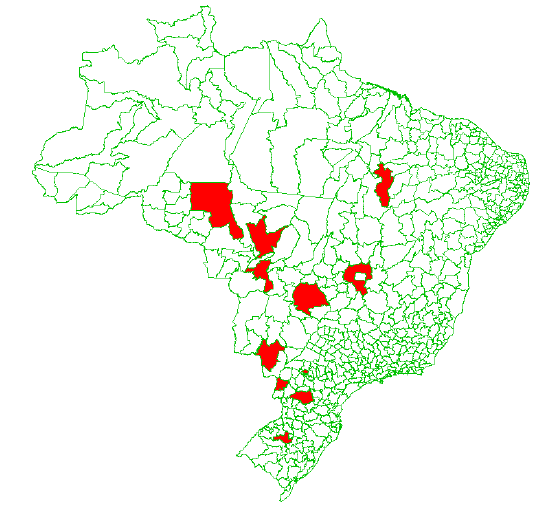
Figures 4 and 5 show the microregions enabled in Scenarios 1 and 2, respectively. In the first case, 68 microregions (of the 80 candidates) were indicated for opening LICs. This value was reduced to 37, when a lower limit was imposed for structures. This means that in Scenario 1, almost half of the facilities were opened to move less than 1 million t of soy.
Nevertheless, they might not be economically viable, as facilities have opening costs. Even though considering that initial investment was symbolic (equivalent to € 0.21) - it is known that sometimes public-private partnerships or public financing are made for financing this kind of governmental projects - the facilities need to attract sufficient quantities to enable the financial return of the project. Besides, considering smart cities design, the governmental budget should be shared between different areas to promote smart infrastructures as telecommunication, internet of things, innovation, human capital and so on.
Regarding the total costs, it reached € 931.914 million in Scenario 1, increasing to € 951.063 million in Scenario 2. A greater cost in Scenario 2 was expected since, by not allowing LICs to be opened attracting less than 1 million t, the cost of transport increases. It happens because the intermodal transport (through a LIC) would be replaced by direct road transport. Nevertheless, Scenario 2 reflects more the economic reality since, it considers the minimum capacity of the facility.
Scenarios 3 and 4 are based on Scenario 1 and consider initial investments to open a LIC. In Scenario 3, the cost for opening a LIC is € 6,382,978 and in Scenario 4 this cost is € 21,276,595. The results are presented in Figures 6 and 7.
As expected, by imposing LICs installation costs, the number of enabled facilities reduces to 11 microregions in Scenario 3 (at a total cost of € 1.085 billion); decreasing to 6 LICs in Scenario 4 (at a total cost of € 1.206 billion). Then, we decided to verify the behavior of the model considering increases in the initial investment to open a LIC. Table 4 compares the enabled regions when the initial investment ranges from € 6,382,978 to € 21,276,595, considering fixed intervals.
Table 4 Comparison of LICs enabled for Scenario 3 and 4 varying the investment in LICs
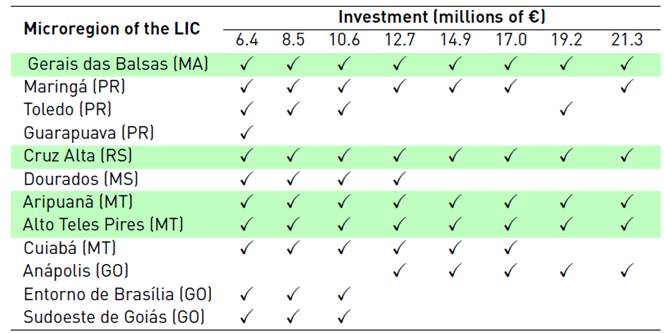
Note: The abbreviations refer to the Brazilian states: MA - Maranhão, MT - Mato Grosso, GO - Goiás, PR - Paraná and RS - Rio Grande do Sul.
We verify that only four microregions are indicated to open, independent of the costs associated to the LICs installation: Gerais de Balsas, Cruz Alta, Aripuanã and Alto Teles Pires (highlighted in Table 4]. Similarly, there are regions enabled only when the investment is low, such as Guarapuva. Anápolis, on the other hand, is only indicated to be opened when the installation cost is at least € 12.7 million (since it probably concentrates flows from other regions and LICs that are no longer open). Therefore, it was possible to verify the trade-off between number of opened LICs and the value of initial investment. This discussion will be better detailed in Table 6.
Regarding to Scenarios 5 and 6, they are based on Scenarios 3 and 4, respectively, but impose a minimum volume (1 million t) to open a LIC. As a result, the same regions were indicated at the same cost of Scenarios 3 and 4. It means that the opening cost is a strong factor in the facility location problem, imposing, even indirectly, that the opening of a facility would be feasible only to move higher amounts of soybean, whose economy from the use of LICs in the logistics network overcomes the initial investment. Therefore, although in Scenarios 3 and 4 no lower bound had been imposed for the volume in a LIC, the mathematical model indicated the opening of only structures that attract at least 1 million t.
The results obtained in Scenario 7 are presented in Table 5. This scenario evaluates how the network would behave if the government defined, a priori, the number of LICs to be opened due to some public policy to establish smart cities. It is noteworthy that the opening cost is also symbolic (€ 0.21) and there is a lower bound of volume to open facilities in this scenario.
Regarding the optimal locations, we verify that until 𝑝=5 LICs, the regions indicated previously remain among those enabled. For instance, the difference between 𝑝=4 and 𝑝=5 is that Guarapuava is indicated to receive a LIC, but all the other regions indicated when 𝑝=4 remain. When 𝑝=6, the mix of enabled microregions becomes different. Anápolis remains indicated until 𝑝=8. The microregions Entorno de Brasília and Sudoeste de Goiás compose the optimal results when 𝑝≥8, while Toledo is enabled from 𝑝=10. Guarapuava, by its turn, is indicated in two specific moments: 𝑝=5 and 𝑝=11. It is important to mention that the frequency related to how many times a microregion is indicated to receive a LIC can be used to create an investment plan, i.e., the highest frequencies can define the priority LICs.
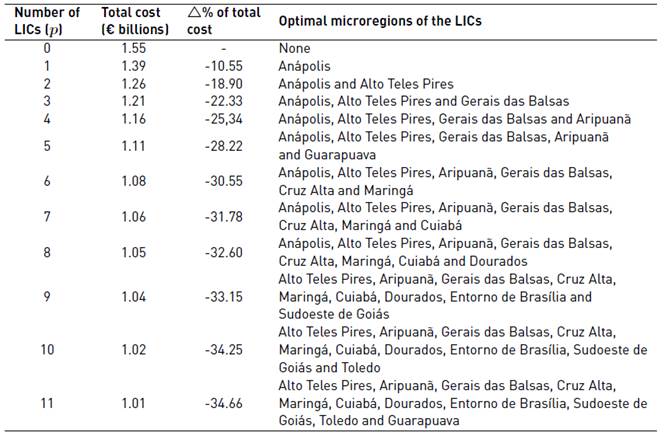
Considering the total cost, it decreases as the number of LICs indicated to be opened increases, varying from -10.55% to -34.66% in relation to the scenario where no facility is opened. Nevertheless, the inflection point (in which the opening of additional facilities would increase transport costs) was not evaluated. However, considering that the number of optimal LICs, in Scenario 2, is equal to 37, it can be stated that values greater than this, results in costs higher than the optimal. Table 6 summarizes the values obtained in all scenarios.
Table 6 Comparison of scenario
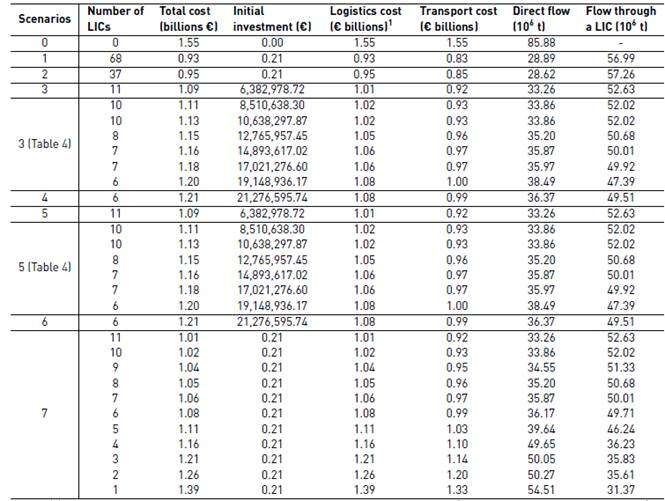
Note: (1) Logistics costs refer to the sum of the costs with transport direct and through a LIC (which means, unimodal and intermodal) plus the transshipment and variable costs at a LIC (when applicable). Therefore, it only excludes the investments to open the facilities. The logistics costs can be found by reducing the values of total cost from investment costs. We highlight that we considered only two decimal places in the Table 6, which can respond for some divergences in the expected value.
With results presented and considering that design smart cities requires a great amount of investments in different areas, the decision maker should evaluate properly the different scenarios aiming to choose a policy for freight transportation that supports the needs of sustainable cities and respect the budget limit.
Then, by analyzing the variation of total costs in relation to the number of opened LICs, it is observed that difference of costs when 11 (Scenario 7, 𝑝=11) and 37 facilities (Scenario 2 with 𝑝 free) are in operation is low to justify the construction and operation of new 26 LICs (especially because the initial investment is symbolic in both cases). When it comes to the transportation costs, this difference is almost negligible. Therefore, the decision maker might open only 11 facilities and apply the remaining resources on other infrastructures related to smart cities.
Evaluating Scenarios 3, 4, 5 and 6, the same findings are made when 6 or 11 LICs are opened. Given that the difference in transportation costs is around € 65.96 million, the decision maker should consider whether opening 5 additional LICs would be feasible or whether the funds should be earmarked for enabling other design-driven technologies and public policies related to smart cities.
Moreover, disregarding a minimum volume that guarantees the economic viability of each facility (as Scenario 1 and 3) is not realistic. As result, Scenario 1 has a similar cost of Scenario 2; however, it opens almost the double of LICs. When including the initial costs that were considered as symbolic, it becomes clear that the amount of facilities indicated in Scenario 1 would not be feasible.
Figure 8 highlights the deceleration in the variation in costs and savings generated from the increasing number of LICs, characterized by the horizontality of the curve. We emphasize that these curves relate the number of LICs opened in Scenarios 1 - 7 to transportation costs and the economy in relation to Scenario 0. The total cost is not considered, but the transport cost is, since the total cost might vary even if the same number of LICs is opened.
Figure 8 shows that the rate of variation in the economy related to the opening of an additional facility decelerates from the 6th LIC, considering only the cost of transportation (thus, ignoring the initial investment from opening the structures). By adopting the initial investment equivalent to € 21,276,595.74 (highest value investigated in the scenarios), only 6 LICs were indicated for opening. This suggests that in an eventual strategic plan, 𝑝=6 could be a starting point for government strategic planning.
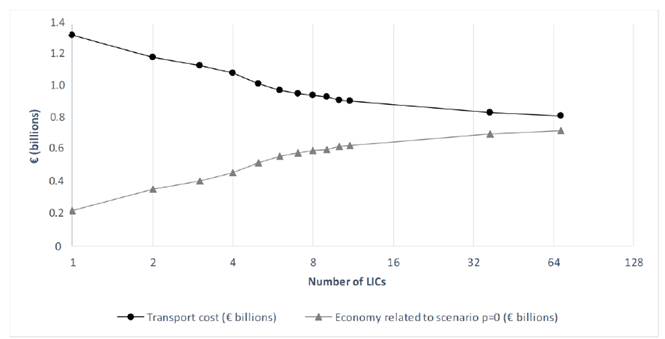
Figure 8 Relation between costs and economies and number of LICs opened (logarithmic graph - base 2)
Finally, it should be noted that several other factors are essential for the development of smart cities. However, transportation can be a key factor, especially in the Brazilian context: a country of continental proportions, whose transport matrix is mostly road - both for cargo and passengers [35-37], which suffers from inefficiencies [11, 41].
Besides, to achieve greener smart cities, we believe that the optimization model could include environmental factors, such as carbon emissions, in the decision of opening or not a facility. Therefore, for future studies, we indicate the application of the model proposed in [8] which considers logistics (including, here, the initial investments to open a facility when applicable) and emission costs in the decision of locating a facility dedicated to modal integration. Regarding the social aspects, it is harder to evaluate - as discussed in [34] due to the lack of consensus on how to measure social impacts. Nevertheless, we believe that by using LICs and reducing traffic and road flows, we are collaborating to reduce social impacts such as accidents, time spent in traffic, expenditures with health system related to transportation issues and injuries from accidents.
4. Conclusions
This paper presented a mathematical model that might help in the governmental strategic planning of the transportation sector, which is pointed out by the literature as one of the key elements of the development and design of smart cities. Although there is a lack of literature on the subject, it is understood that transportation is fundamental for the movement of people and goods. Thus, strategies (as LICs opening) to reduce the impact of transport on the design and operation of urban areas are critical tasks to the development of smart and integrated cities. Still, it might help the planning of smart territories.
The objective of this research was achieved since we determined the optimal location of LICs focused on soybean transportation from the mathematical model application of [5]. It is important to highlight that the optimal location varies according to the parameters of the scenario under assessment. In Table 4, for instance, it was possible to evaluate how the optimal location varies according to the variation on the initial investment to open a LIC. It is relevant in the planning process because allows the decision-maker to evaluate different scenarios and perspectives before taking a final decision (that most of times implies in high costs and, once it is implemented, hardly ever can be changed without spend significant amount of money, once it is implemented).
In addition, the findings pointed out the costs and number of facilities to be opened in order to help in defining public policies and the distribution of resources between transport projects (e.g. that facilitate mobility and reduce congestion) and other dimensions that make up a smart city, considering the different scenarios proposed.
As a limitation, the results are highly dependent on the database used, and it is important to note that the latest PNLT update (performed in 2012) was made considering only the infrastructure projects predicted until the year 2031. Therefore, updates in the transport network could not be considered. Nevertheless, we have not found recent government plans with the same characteristics of PNLT or database available for updating the model input parameters.
As a suggestion for further studies, it is recommended to adopt sustainable mathematical models of location or, at least, the ones that consider the environmental dimension, given the difficulty in measuring the social dimension and the scarcity of literature presented in [8] and [34] Besides, others cargos could be considered and new scenarios must be proposed.

