


 English (pdf)
 Article in xml format
 Article references
 Send this article by e-mail
 Cited by SciELO
  Cited by Google
  Similars in
SciELO
Similars in
SciELO  Similars in Google
 Permalink
1. Introduction
Cheese consumption in Colombia is a relatively new practice; however, each region of Colombia has a particular type of cheese [1]. According to the Annual Manufacturing Survey [2] , 78% (51 301.69 tons/year) of the cheese consumed in Colombia are fresh and soft cheeses such as Queso Molido Nariñense (QMN), Quesito Antioqueño, Queso Amasado, and Queso Campesino and pasta filata cheeses, such as Quesillo, Doble Crema, Queso Pera, and Queso Momposino. These two groups of cheeses are the two most consumed in the country. The remaining 3% include Queso Cuajada, 11% cream cheese and 8% matured cheeses, such as Paipa and Gouda cheeses.
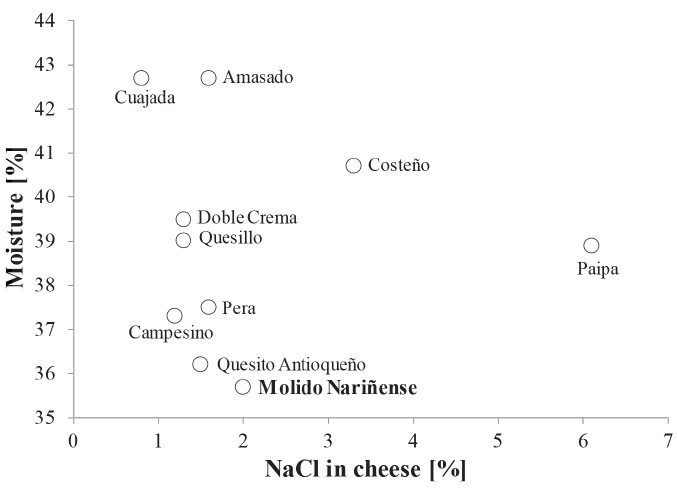
Figure 1 shows the relationship between Moisture (%) and NaCl (%) of different types of Colombian cheeses. Commercial QMN presents a concentration of around 2% of NaCl. Salt is added to these cheeses as a preservative and taste enhancer [3]. Some physicochemical studies conducted on a variety of cheeses show that salt has a significant effect on rheological and textural aspects, useful lifetime, among others [4-7]. However, the World Health Organization (WHO) calls for the reduction of salt in foods, given the many diseases that may be developed if salt is consumed in excess [8].
Salt is essential in the body since it helps to maintain fluid balance. However, it is not recommended more than 2.3 mg of sodium per day [9]. Accordingly, some international studies [10-13] have been carried out regarding the influence of salt in cheese and the impact on consumers. In Colombia, however, there is no a profile of the salt content of cheeses produced in the country which will allow correlating its effect on the level of consumer acceptance, that would influence producers control in the salt recommended levels, as suggested by WHO [8].
Sensory studies on acceptance generate valuable information; in this case, the thresholds of salty flavor in the cheese accepted by the consumers. With the results, it will be possible to identify the excesses of salt in the formulations. In addition, this will be reflected on the final cost of cheeses production. In this study, the concentration of salt in QMN was determined instrumentally, and the sensory thresholds of acceptance of salty taste in these cheeses are reviewed. By using an untrained-panel of consumers and samples of QMN, the correlation between saltiness and flavor sensory was determined.
2. Materials and methods
2.1 Sample preparation
Samples of QMN were prepared in the laboratories of Universidad Santiago de Cali (Cali, Colombia). The milk was obtained from Lácteos Uno A (Candelaria, VA, Colombia). Pasteurized and standardized milk were used for the preparation of cheese samples, at a ratio of protein: fat 0.96:1, stored at 6 °C. In the processed cheeses, the NaCl concentrations were 0.5%, 0.8%, 1.0%, 2.0%, 3.0%, and 6.0%, respectively. Six replicates (C1 to C6) were made for each concentration of NaCl (~ 10L of milk per treatment), for a total of 36 units of cheese. Nine cheeses were produced every day in vats of ~ 15 L. The order in which the cheeses were manufactured was randomly selected.
The cheese samples were made following the instructions given by [14] were followed. The milk was heated to 36 °C and CaCl2 was added to a final concentration of 0.02% (w/v). The microbial rennet (2200 IMCU/mL, Mucur Pusillus, EC 3.4.23.23, Marzyme®, Danisco) was diluted in deionized water (1:10) and added to the milk at a rate of 0.20 mL/L. After 40 min, when the curd reached the appropriate strength, it was cut to the appropriate grain size (about half of a rice grain). The mixture of curd particles and whey was stirred and heated at 0.5 °C/min until it reached 45 °C, to reduce moisture in the curd grains. Then, the stirring was stopped and the mixture was filtered through a nylon mesh to remove the whey. The curd grains were ground and salted. The molding was done in cylindrical molds (diameter 11.4 cm, height 5 cm) with decreasing temperature (~ 40 °C to room temperature). Finally, the cheese samples were packed and coded according to their salt content and stored at 4 ° C during 7 days.
2.2 Instrumental analysis
Sample preparation
Samples of each cheese were collected as stipulated in the IDF [15] . Samples (~ 50 g) were homogenized separately in a food processor. Samples were packed and stored at 4 °C for two hours. The homogenized samples were analyzed the same day.
Potentiometry
The potentiometric analysis was performed in triplicates using: a multimeter Tech (TM-108), a reference calomel electrode (Fisher), a silver indicator electrode (silver wire with a purity of 99.9%, Alfa Aesar, Ward Hill, MA, USA), nitric acid, and silver nitrate (AppliChem Panreac, Barcelona, Spain) as titrant. The electrode had been previously standardized [16] with analytical grade NaCl (Carlo Erba reagents, Cornaredo, MI, Italy). To determine the NaCl concentration in cheese, the Association of Official Agricultural Chemists (AOAC) method 983.14 [17] was followed, consisting of the determination of chloride ion by potentiometric titration with standard silver nitrate. 3.00 g of sample was weighed and homogenized mixed with 30 mL of water at 55 °C, and 2 mL of HNO3 was added (in 0.5 mL aliquots) and titrated with AgNO3 [18].
2.3 Sensory analysis
Place and personnel
Two consumer-oriented tests [19] were performed, these were: a 7-point hedonic test and a test of the intensity of the salty taste. These tests were conducted from 9:30 to 11:30 am at Universidad Santiago de Cali (Coordinates: 03 ° 27'0 "N 76 ° 32'0 "O, Altitude 995 meters above sea level).
The Acceptance and sensory Preference of saltiness in the samples of QMN was evaluated. Ninety-six untrained consumers sensory valued QMN cheese samples. Consumer ages ranged between 15 and 60 years old. Participants included both male and female, from different occupations, socio-economic, and regional backgrounds. Additionally, participants were selected from the students of the Universidad Santiago de Cali (USC). The criteria for the selection of panelists were the regular consumption of QMN and good health. They took a few minutes before the test to complete a small survey about their health and habits of consumption. Consumers that were selected were not allergic or sensitive to salt, food preservatives, iodine, and anti-caking agents present in commercial salt. They were given a brief explanation of the research aims and were told about the importance of it. The duration of the test did not exceed one hour.
Sample presentation
The QMN samples were removed from the refrigerator an hour before the test and cut into pieces (approximately 1.5 x 1.5 x 1.5 cm in size). They were coded with flags containing 3-digit random numbers according to each concentration [20]. Three samples of cheese were placed in each disposable plate, distributing the six concentrations in all possible combinations. The samples were organized, avoiding the position error. Each assigned code could occupy the first place, for example, C1-C2-C3, C2-C3-C1, C3-C1-C2.
Participants were informed about the importance of the study, explained the form to be filled out with their perceptions, and instructed about the right way to perform the tasting. Subsequently, each panelist was given a disposable plate with three cheese samples correctly coded, along with a glass of water and two slices of green apple. Each panelist assessed each sample once. After that, they drank water and ate a slice of green apple as a neutralizer to avoid interference with the next product.
Acceptance testing: 7- points hedonic test
Panelists were asked to indicate how much they liked each cheese sample, assigning a value to salty attribute according to a scale ranging from "I extremely dislike it ", to " I extremely like it". On this scale, they were allowed to assign the same category to a different sample.
Test intensity of saltiness
A comparative test was used to determine the intensity of saltiness using a scale of an interval of response and continuous of 15 cm. The scale ranged from “not salty" to "very salty". Each panelist was requested to indicate his perception of the salty taste of each cheese sample marking the scale with an "x". The instructions and order in which the panelists were asked to assess samples were indicated in the form.
2.4 Statistical Analysis
The data obtained from the analytical response of chloride ion in cheese samples at different NaCl concentrations, performed following the potentiometric method, were statistically analyzed using the software PSPP® version 0.7.9 B20120320. Through ANOVA, significant differences between lots of the same concentration of NaCl were evaluated. As post hoc analysis, the Tuckey test with α = 0.05 was used. Graphs, equations, and regression coefficient of determination (r2) were obtained using Excel 2010 (Microsoft Office Excel 2010). The treatment for sensory analysis and its correlation with the instrumental results was performed using the tests of Friedman and Wilcoxon [21].
3. Results and discussion
From the sensory data obtained, the preference percentages were determined (total, by gender, age and by stratum). This was performed by the summation of the gender, age, and socioeconomic stratum. The descriptive statistics for the instrumental and sensory data, and the Friedman test and the Wilcoxon signed-rank test were applied. To facilitate the reading of this document, letters were assigned to each concentration of salt in the sensory evaluated cheese samples as follows: C1: 0.62 ± 0.073, C2: 0.87 ± 0.026, C3: 1.05 ± 0.033, C4: 1.74 ± 0.015, C5: 2.71 ± 0.063, C6: 5.34 ± 0.286.
3.1 Analysis of preference
The survey showed that: the population of panelists consisted of 63% women and 37% men; 76% of the sample population were below 26 years of age. Colombia has six socioeconomic levels, on a scale of one to six, the richest were denoted by six and the poorest by one. The predominant socioeconomic stratum between consumers were level 3 or middle socioeconomic class (50%) of the total population. Also, 46.3% of the respondents claimed to consume cheese at least once a week, followed by 17.9% who consumed at least once a month. Participants belonging to social stratum level 3 claimed to consume cheese on a weekly basis.
Figure 2 shows four bar graphs with information organized according to the percentage of preference by gender, age and socioeconomic status. Figure 2a shows that, among the student population of the Universidad Santiago de Cali, the C4 cheese sample had a higher preference (75.6%). Figure 2b shows that the C4 sample was preferred by both male and female populations. Figure 2c shows that the C4 sample was preferred by the populations of ages 15 to 30 (74.9%) and 31 to 45 (85.7%), whereas the C1 sample was preferred by the population of ages 46 to 60 (37.5%). Figure 2d shows that the C4 sample was preferred by individuals across all socioeconomic strata (74.9%). Among all the cases analyzed, C1 and C6 samples were the least preferred.
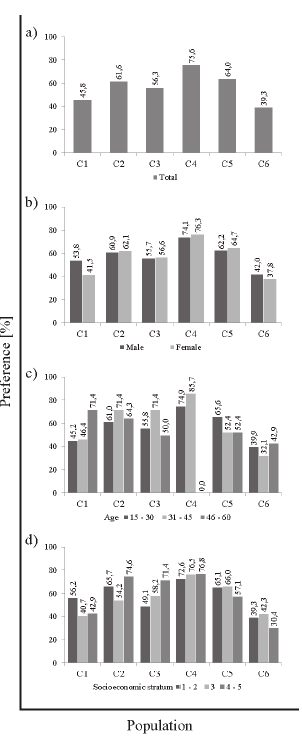
Figure 2 Characterization of acceptance according to the characteristics of the studied population: a) Total preference percentage by concentration of salt in queso Molido Nariñense, b) Preference percentage by gender, c) Preference percentage by age, d) Preference percentage by socioeconomic status. Salt concentration in cheeses samples was as follows C1: 0.62 ± 0.073, C2: 0.87 ± 0.026, C3: 1.05 ± 0.033, C4: 1.74 ± 0.015, C5: 2.71 ± 0.063, C6: 5.34 ± 0.286
3.2 Analysis of acceptance
Table 1 summarizes the sensory acceptability of the six samples of cheese evaluated by 96 consumers regarding their saltiness. Panelists were part of the daytime and nighttime evaluators at Universidad Santiago de Cali. Results were estimated using seven-point hedonic scales and were analyzed using the Friedman test. The perception percentage values of salt concentration in cheeses are also presented in the table. It was noted that the most preferred cheese was the one with 1.74% NaCl (C4), and the less accepted were those with the lowest (0.62%) and the highest (5.34%) salt concentration.
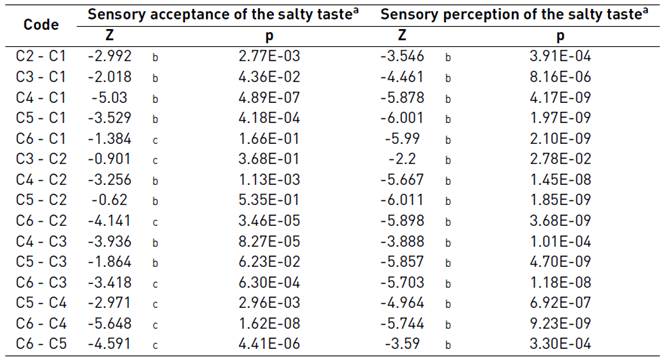
The Friedman test conducted for the ratings assigned by consumers showed a critical level value (1.31 E-12), which is lower than the established value of 0.05, showing that average scores are different in all six salt concentrations. This is because small variations in the concentration of salt in food can significantly modify the taste [3, 18]. The Wilcoxon test was used to analyze the differences in qualities among of them [Table 2]. It was found that in the pair of concentrations where the critical level was higher than 0.05, no significant differences were found (C6-C1, C3-C2, C5-C2, C5-C3). In the other compared pairs, a significant difference was found among them. The C4 concentration of 1.74% NaCl with the highest rating (5 on a hedonic scale of 7) shows a significant difference from other concentrations. The least accepted concentrations (0.62 and 5.34%) did not differ significantly. The maximum (C6) and minimum (C1) concentrations of salt in QMN were rejected by consumers.
Table 1 Instrumental and sensory correlation of salt taste in Queso Molido Nariñense
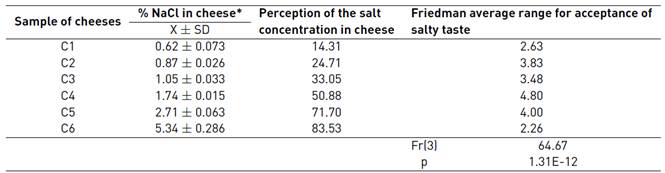
* Results are reported as the mean value ± standard deviation; n = 6
3.3 Perception of salt
Numerical scores were determined by measuring the distance between the left end of the scale and the mark given by the panelists and transformed into percentages to facilitate understanding [22, 23]. The tests of Friedman and Wilcoxon conducted on the perception data showed significant differences for all salt concentrations. The percentage of sensory perception of salt in QMN samples is presented in Table 1. The concentration of greater liking was localized in the central zone (50.88%) of the intensity of saltiness scale of interval. The minimum threshold difference among concentrations of NaCl in cheese was between 0.18% and 0.27%.
A Comparison of the percentage of sensory perception of salt and the concentration of salt (% NaCl) in samples of cheese is exhibited in Figure 3. Figure 3a shows that the C4 sample is preferred, followed by samples C2, C3, and C5. However, the samples C1 and C6 had lower acceptance. Thus, it is evident that excess in the amount of salt in the cheese samples generates product rejection by consumers. It is also possible to reduce the salt content to stay in area acceptance. Figure 3b displays that as the salt concentration increases, the cheese sensory perception of saltiness is higher. The correlation between these parameters for a linear relationship is 0.8419; however, when a logarithmic correlation is established, this value increases to 0.9813. The trend line for the logarithmic correlation provides insight that as the salt concentration values increase -exceeding approximately 3% NaCl- the percentage of displeasure increases. Similarly, for this type of cheese, shallow values of salt concentration in cheese produce consumer dissatisfaction.
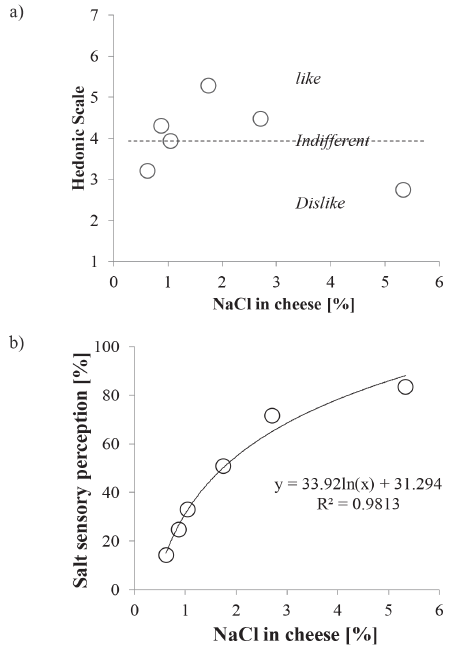
This relationship also allows for an instrumental scale of salty taste in cheese samples. Thus, for the QMN, the equation: % salt sensory perception = 33.92 ln (% NaCl in cheese) + 31.294, can be used to determine indirectly the degree in which consumers like or dislike the cheese according to its salt concentration.
3.4 Discussion
People need approximately 2.4 g sodium per day, which is equivalent to 6 g NaCl per day [24] The World Health Organization (WHO) recommends reducing the average consumption of salt for adults to less than 5 g per day. The intake of this amount can be met through the original content of sodium in the food. However, in modern Western diets, considerable amounts of NaCl are added. Sodium consumption exceeds nutritional recommendations in many industrialized countries. It has been demonstrated that a diet high in salt leads to health problems such as hypertension, coronary heart disease, stroke, and increased calcium excretion, which can lead to osteoporosis [25-30]. Western diets contain approximately two to three times more sodium than is necessary, and their excessive intake has toxic, or at least undesirable, effects: physiological effects, of which the most significant is hypertension [31-33].
A large part of the world population consumes much more sodium than recommended. Since the 1960s, a series of public health interventions and recommendations for nutritional guidance has been promoted to reduce the intake of sodium in the diet. To date, these activities have not met their objective. Sodium intake remains unchanged and has even shown an upward trend. Meanwhile, the incidence of hypertension has not decreased [34-36]. Consequently, there is a growing interest in the production of low sodium foods, by the recommendations for the reduction of dietary intake of sodium chloride.
The cheese represents a model of study among foods with a particular interest in the reduction of salt (soups, sausages, etc.). The presence of sodium in the cheese is due to the natural origin in the milk, as well as to the added salt. Cheese has been identified as one of the leading food vectors that contribute to salt intake in countries where its consumption is relatively high [37, 38]. For example, if a person consumes an average amount of 40 g of cheese per day, this alone would account for 10% of the recommended daily intake of salt (calculated from an average salt intake of 8 g/day and 2% w/w NaCl in the cheese). Therefore, a better understanding of the impact of salt on the sensory and physicochemical characteristics of cheeses would allow finding formulations that satisfy the expectations of consumers [39] without negative consequences on their health.
There is considerable direct evidence of the correlations between the level of salt and the sensory quality of the cheese, judged by experts. Also, there is a direct impact of salt on flavor. Salt levels become increasingly evident, organoleptically with too much or too little amount [40]. The flavor of the cheese without salt is insipid, even for someone who is not "lover" of salt. It is estimated that the use of 0.8% w/w NaCl is enough to overcome the tasteless taste [32]. Depending on the type of cheese, the salt reduction can be in the order of 10% to 25% [41]. However, in this investigation, it was found that the QMN could have a reduction of up to 50% of NaCl, maintaining the acceptance by the consumer. This reduction would allow the market to expand for this cheese and ensure that the product is part of the many products reduced in sodium. It is necessary to carry out studies to reduce the salt content in other Colombian cheeses without affecting their sensory quality.
4. Conclusions
Potentiometric analysis of chlorides in cheeses allows us to know in advance what the reaction of consumers regarding their acceptability and perception of salt in cheeses will be. This result reveals that extremely low or high salt perception results in low acceptance of the cheese by the consumer. Also, the QMN could have a reduction of up to 50% of NaCl, maintaining the acceptance by the consumer.

