


 English (pdf)
 Article in xml format
 Article references
 Send this article by e-mail
 Cited by SciELO
  Cited by Google
  Similars in
SciELO
Similars in
SciELO  Similars in Google
 Permalink
1. Introduction
Deltas are landforms created by the strong transformative interaction of rivers, ocean waves and tides [1, 2] and recently by man-made activities [3, 4]. They change their morphology over time, in response to local factors as changes in their basins, the ocean currents, climate and isostatic factors [5]. These morphological changes could occur in temporal scales from days, months, decades or centuries [6]. In some cases, these changes are exacerbated or minimized by particular events or alterations in some of the factors that contribute to their formation (i.e., floods, storms, tides). Delta changes may be also driven by many anthropogenic processes such as deforestation, soil erosion, slope failure, downstream sedimentation, urbanism, farm-animal grazing, agriculture, mining, waterway re-plumbing (reservoirs and dams), diversions, channel leeves, floodings, channel deepening and shoreline alteration among others [7-11]. Experts in deltaic environments remarked the importance to conduct studies about changes and vulnerability of deltas due to erosion, progradation, climate change and extreme natural events [12].
In this regard, the Atrato River delta has experienced notable morphological changes in recent years [13, 14]. The sediment load transported by the river, for instance, increased from an estimated 11×106 tons/yr in 2004 [15] to 25×106 tons/yr in 2011 [16], while episodic measurements near the delta mouths showed discharges varying between 4,138 and 5,017 m3/s in different climatic seasons [17]. This increase has probably been not only due to natural fluctuations but reinforced by human activities in the basin.
The Atrato River flows through a dense, humid and cloudy forest and is the main (almost unique) access and trade route to human settlements in the area since pre-columbian [18, 19]. Almost all settlements are located over river banks and depend on the river regimes for their survival. The delta also nurtures a vast area of wetlands [20] and mangroves that depend on the delta´s dynamic [21].
In this paper, we identify main erosion and progradation trends along the Atrato delta shoreline over the last 33 years, using Landsat satellite imagery and the Google Earth Engine (GEE) platform [22, 23] to automaticaly delineate and quantify these trends. In addition, we assess the effectiveness and accuracy of the erosion and progradation areas detected with our algorithms in GEE with the manual digitalization of five Landsat images between 1986 and 2019.
2. Materials and methods
2.1 Study area
The Atrato river basin is one of the rainiest regions of the world, with a mean precipitation between 2,500 and 3,000 mm/yr and an average temperature of 28 °C [24] , which explain the cloudiness and humidity that affect observations from satellite imagery. The basin is mainly composed of lands and forest protected by national laws. There are zones that allow practices such as fishing and hunting, and other zones where agriculture, forestry, mining and cattle raising activities coexist. These activities have been expanding, sometimes in an uncontrolled way [25], changing the land cover and causing an increase in the river sediment loads that reach the delta and modify its morphology [26-33] [Figure 1].
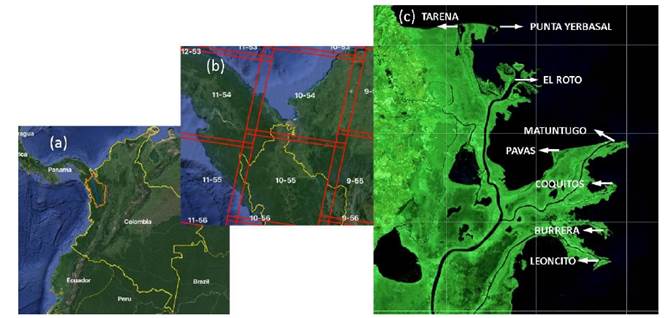
image: USGS - Landsat, 2019
Figure 1 Location of the Atrato river basin and its delta: (a) basin in Colombia; (b) Landsat paths and rows over the Atrato delta; (c) Atrato delta and its mouths.
The Atrato river delta is located in the northwest of Colombia, approximately between N7° 50”-N8° 30” and W76°45”-W77° 00”. The delta forms over the western side of the Gulf of Urabá, which is a semi-closed basin with long mangrove extensions and a complex coastal dynamic influenced by the Atrato and other minor rivers, plus a dominant south litoral drift which restricts the Atrato sediments from reaching the coasts [20]. The climate in the delta is dominated by a low rainy season from December to April and a high rainy season from May to November. The delta itself harbors vast extensions of wetlands and mangroves, which have an important ecological and environmental value for people in the region [19, 20].
The Atrato delta lies in an extensive fluvial-lacustrine and alluvial setting of Quaternary and recent deposits. The shoreline is determined by tectonic activity and by fluvial and marine contributions, which shape this area as a sectorized erosive and cumulative system. The Atrato delta harbors geoforms related to vegetated-type intertidal planes, fluvio-marine plains, flood zones and beaches [21, 34, 19]. One of the most influential factors in the sedimentary dynamics of the delta is the filling of bays with sediments through openings associated with the activity of the Atrato mouths, especially during flooding episodes [14]. This could be a result of an increase of sediment loads [15, 16]. Morphologically, The Gulf of Urabá’s microtidal regime between 0.5 m and 0.7 m [20, 35], together with mild waves and large discharges and sediment loads from the Atrato, conform a “bird foot” delta [20, 36], with seven main mouths into the sea: Tarena, El Roto, Pavas, Matuntugo, Coquitos, Burrera and Leoncito [Figure 1]. The mouths are dynamic (some of them close as new ones open), and three of them are used for small scale navigation. This type of delta is river-dominated [20, 37, 38]. Therefore, the river attributes (channel morphology, flow, sediment loads, etc.) have a predominant impact in the delta’s evolution.
Unfortunately, flow and sediment load measurements in the river are scarce and discontinuous [17], and gauges are practically inexistent at or near the delta. Similarly, tidal records in the Gulf of Urabá are scarce and discontinuous [21]. Most of the data about the effect of the Atrato delta on the Gulf of Urabá are obtained from hydrodynamic models developed for the gulf, where the importance of the Atrato river is modeled in terms of its sediment loads, from Bahia Colombia towards the north, almost to the open sea, and its influence in the reduction of the kinetic energy of currents towards the northwest [17]. The height of modeled waves usually is around 0.75 m in the rainy season and around 1.5 m in the dry season at the north side of the gulf [17].
2.2 Satellite data
To track changes in the delta shoreline, we use imagery from Landsat missions 5, 7 and 8 Tier 1 raw scenes. These scenes include Level-1 Precision Terrain (L1TP) processed data that have well-characterized radiometry and are inter-calibrated across different Landsat sensors, with a revisit time of 16 days [39]. Landsat is the world’s longest, continuously acquired collection of space-based land remote sensing data [23], which sensors record several spectral bands at spatial resolutions between 30 m and 120 m. We chose Landsat images due to their spatial resolution that is adequate for tracking geomorphological changes in small distances and for their long records. For our purpose of detecting general trends in erosion and progradation, we use spectral bands at 30 m of spatial resolution, taking the images recorded for the dry season (November to April) when cloudiness is relatively low, and selecting all the available images within that season between 1985 and 2019, for a total of 194 images in the path-row grid 10-54 and 10-55 in Landsat world reference grid (WRS-2) [39], that encompass the entire Atrato delta [Figure 1].
2.3 The GEE platform
GEE is a cloud-based platform for planetary-scale environmental data analysis with an extensive and constantly growing data catalog of publicly available remotely sensed imagery and other data and features (vectors). GEE has a computational infrastructure optimized for parallel processing of geospatial data [22]. The GEE platform allows advanced calculations and geospatial analysis through an interface with an online Integrated Development Environment (IDE) for rapid prototyping and visualization of complex spatial analyses with a variety of features. In this interface, researchers can upload, import and visualize the imagery needed, without caring for storage capacities.
An important feature of GEE is the use of MapReduce architecture for parallel processing. This feature allows handling large amounts of location-based information attached to Google searches as well as geographical imagery (e.g. satellite images) and features (e.g., road segments and landmarks). With this architecture, GEE do complex calculations by using “batch” processing data, e.g. dividing the information (image collections) into separate chunks [22]. GEE has several predefined algorithms, called methods, to conduct processes that avoid the need of writing large scripts. These methods are specifically designed for each imagery collections.
2.4 Data processing
To limit the number of results, we filtered the images by boundary and by date, using the Atrato river basin polygon as a boundary (see Figure 1] and the months November to April as selection dates. Using these filters, we reduced the collection from more than 5,000 images to 194.
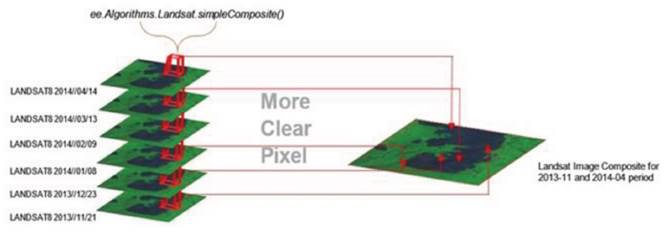
With these images we built image composites, using ee.Algorithms.Landsat.simpleComposite(), which selects a subset of scenes at each location, converts to TOA reflectance, applies the simple cloud score and takes the median of the least cloudy pixels, a measure less sensible to outliers [40]. Figure 2 illustrates the processes that we followed to obtain the image composition for the study period. Since each path-row image only covers part of the study area, we assembled mosaics of two images (images path-rows 10-54 and 10-55) to produce a spatially continuous image [40].
With the composite and mosaicking process applied to Landsat 5, 7 and 8, we obtained 17 images, one image per period, covering from 1985 to 2019 (there were some years with no images available or with images of low quality: 1985, 1988, 1993 to 1996, 2004 to 2009 and 2012). We reviewed the image composites obtained and applied an additional filter to decide if the image was suitable for analysis (the filter consisted in observing the cleanliness of the scene).
With the 17 images, we created a list of images sorted chronologically to facilitate the time series analysis in further processing steps.
Automatic shoreline delineation
We set Landsat 5 1985-1986 as a baseline to compare the evolution (progradation or erosion) of the delta shoreline. To determine these changes, we delineated automatically the shoreline of all processed images and compared among themselves. We implemented the Otsu method [41], which is widely used for image segmentation. We use image’s histograms to automatically calculate an optimal threshold to split pixels in two classes (water and land). The Otsu method requires images to have bimodal histograms, which was the case for most of the images cleared from clouds. This methodology has already been used in satellite image analysis by [42] to assess the change in surface water at a global scale with GEE.
The Otsu method uses one single band to calculate the threshold. We chose the Near InfraRed (NIR) band, since it discriminates well between water (highly absorptive) and land, particularly vegetated land (highly reflective). For the automatic delineation, we identified the threshold where the partition of the data maximizes interclass variance defined as BSS/p [42], where p is the number of classes and BSS(Between Sum of Square) is given by Equation (1):
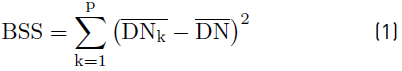
For our two classes (land and water) p=2 DN is the digital number of the NIR band,
 is the mean digital number in class k and
 is the mean digital number of the entire dataset. Class k is defined by every DN less than some threshold [42]. We replaced DN with reflectance, since TOA images preserve the bimodal histogram that is the base of the method.
We adapted the algorithm implemented by [42], in which the authors searched only over the thresholds that are represented by the bins in a histogram. The advantage of such approach is that it only requires a single pass over the data. At each bin of the histogram, we defined a class k as the pixels in that bin and lower. Class k+1 contains everything else. The algorithm looks at every possible partition of the input data defined by the bins of the histogram, then returns the mean associated with the bin that maximizes the BSS [42].
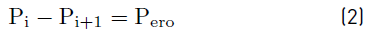
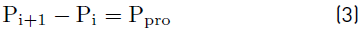
The automatic delineation yields a series of polygons, one per year, in which one side represents the delta’s shoreline [Figure 3] and the other the waterline. We compared the polygons by subtracting one polygon from another, using the left.subtracting (right) algorithm, which returns the result of subtracting the right geometry from the left geometry. We obtained the annual erosion and progradation polygons as given in Equation (2) and Equation (3):
In a similar fashion, we obtained the cumulative erosion and progradation at each period [Equations (4) and (5)], setting 1986-1987 as a benchmark:


where: P= polygon representing the delta; i= the period from 1986-1987 until 2018-2019 (excluding years: 1988, 1993 to 1996, 2004 to 2009 and 2012); P ero = resulting erosion polygon; P pro = resulting progradation polygon; P ce = resulting cumulative erosion polygon; P cp = resulting cumulative progradation polygon. We obtained the prograded/eroded area in 33 years by calculating the area of each resulting polygon.
We chose Landsat’s coarse 30×30 m pixels to determine long-term trends of shoreline changes in the micro tidal environment of the Atrato delta (the microtidal regime in the gulf implies horizontal changes of 4 to 5 m in the shoreline, which are within the range of resolution of our images). Given this resolution, we considered an uncertainty threshold of 1.5 pixels (approx. 45 m or 0.0020 km 2), below which values do not indicate significant changes. Above the threshold, we considered the detected changes as significant erosion or progradation processes.From the images, we obtain erosion/progradation changes in terms of lengths and areas. To compare multiannual trends, we expressed these changes as mean rates per year of progradation/erosion by dividing the total lenght of the process into the number of years in which the process occurred. We classify these rates of erosion/progradation by chosing the hotspots (critical areas) and grouping them into four categories of coastal evolution trend, according with [43], as: high erosion (≥-1.5 m/yr), erosion (-1.5 to -0.2 m/yr), stability (-0.2 to +0.2 m/yr) and progradation (≥+0.2 m/yr). The above methodology was applied to all images. Figure 4 depicts the procedure as a flow chart.
Manual shoreline delineation
We compared our automatic delineations with manually digitalized shorelines of the delta over five Landsat images, downloaded from the USGS Earth Explorer (1986, 1992, 2002, 2011 and 2019, path 10, row 54), using ArcGis Software tools for digitalization (despite its subjectivity and related accuracy and precision issues [44], manual digitation is still used as a baseline method to compare with automathic delineations [44, 45]). We carefully drew the polyline of the shorelines from the Tarena zone in the Northwest to the Southwest in the sector of Marirrio Bay towards Bahía Colombia for each year. Afterwards, we sequentially overlapped the manual shorelines to delineate series of polygons for erosion and progradation and used ArcGis to calculate the areas of these polygons in km 2 and ha. We finally compared the calculated trends and rates with the ones obtained automatically. In addition to this procedure, we delineated the shoreline over two 10 m resolution images of 2002 and 2013 available in Google Earth and visually compared them with the corresponding automatic delineations in GEE.
3. Results and discussion
We first determine the capacity of GEE to efficiently generate and delineate the shorelines automatically. Afterwards, we analyze the changes in progradation and erosion identified over the Atrato delta, based on the comparison of the delta shorelines at different times.
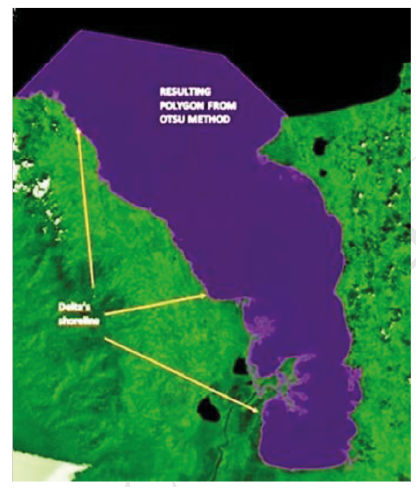
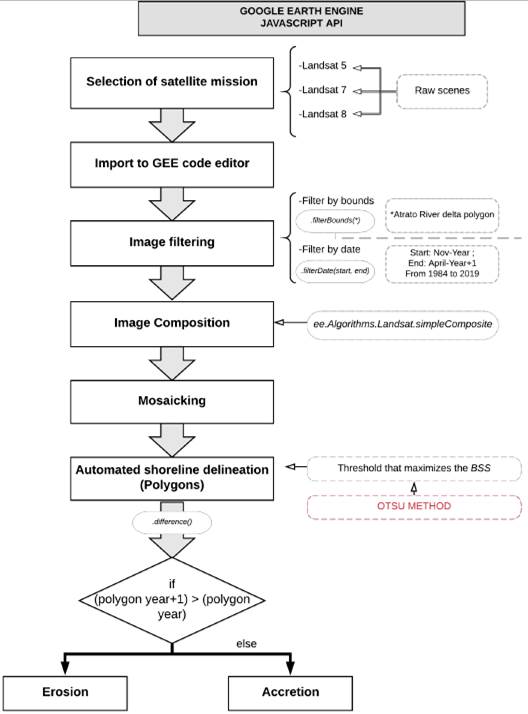
Figure 4 Flow chart depicting the steps implemented in GEE API to obtain the annual shorelines of the Atrato river delta
3.1 Automatic delineation
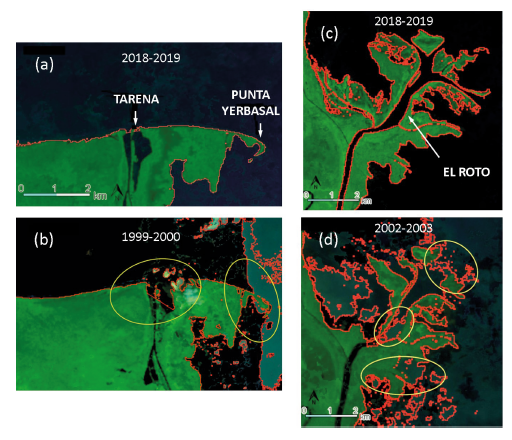
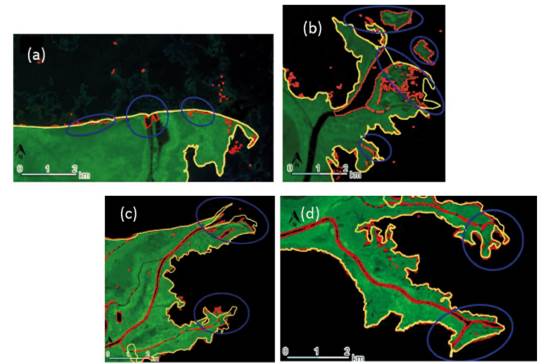
To analyze the goodness of fit of the automatic delineation respect to the delta shoreline, we visually compare between the polylines and the image for the same period. Figure 5 shows examples of good automatic delineations of the delta shoreline, compared to poorly automatic delineations at different parts of the delta. Figure 5 a and b show the Tarena mouth area. In this area, five images present some kind of noise, but only one was discarded.
Figure 5c and d show El Roto mouth and its multiples channels. It was a challenge for the algorithm to discern the banks of these channels, especially when the lines were relatively close, but, as we see in Figure 5c, the delta frontline was clearly delineated. At El Roto, only one image was discarded due to noise [Figure 5d).
In general, the algorithm was robust and efficient, given the conditions of the area of study (only three out of 17 images were discarded). The amount of images of the delta available in each mission decreases from 115 images in Landsat 8 to31 images in Landsat 5 for the period of interest, which affects the quality of the image composite, since there are fewer images to get clean pixels. Landsat 5 was the most restrictive image collection, due to the few images available to perform an adequate composite. The discarded images belonged to landsat 7 (one in 1999-2000 and two in 2001-2002). Landsat 8 images, except 2015-2016, presented high quality and were the images with clearest delineated shorelines, which is consistent with the large number of images available from this mission.
3.2 Accuracy of the automatically traced shorelines
Our delineation algorithm on GEE can be applied to an area with heterogeneous reflectances (i.e., presence of clouds and shades). To determine the degree of accuracy in the delimitation of shoreline, we visually validate the results by tracing the shorelines by hand for the periods 2001-2002 and 2013-2014, using the high-resolution composites from Google Earth (GE) images of 2019, and comparing them with our automatic shorelines on GEE.
The results confirmed the ability of the algorithm to achieve satisfactory delineations with low quality images. It is worth noticing that the satellite images have a 30 m resolution, which causes the observed pixelation of the shoreline. Both manual and automatic delineations are almost coincident along the delta in 2001-2002 [Figure 5]. GEE is even able to identify small islands and channels [Figure 5]. For instance, GEE detects an island formation very close to the shoreline in image D, and two little channels in image C.
The islands formed within the delta are important because they are the result of the interaction between fluvial and marine processes (waves, tides, longshore currents). It is worth noticing that the island was omitted in the delineation by hand but recognized by the algorithm.
The image in Figure 5b is not clean enough and the algorithm interpreted some contrast as part of the shoreline, giving a false delineation. Therefore, the algorithm could fail if the image present strong contrasts (i.e., created by cloud shadows). In our case, most of the delta shoreline was delineated with high precision without these contrasting features in all years and therefore, we were able to track changes in the delta shoreline.
The match between shorelines delineated by hand and with GEE for the period 2013-2014 was even better, as can be seen in Figure 6, images C and D. This was the result of good composites obtained from a large number of images available in Landsat 8. Images C and D in Figure 6 show some discrepancy between the two lines, caused by clouds and shadows that we confused with water in the manual delineation, since both appear in black. In this case, the algorithm in GEE delineate the shoreline better.
Overall, the automatic delineation of the shoreline showed enough quality and accuracy to perform the historical progradation/erosion analysis of the delta, especially due to the detection of every single contrasting detail in the terrain, which sometimes passes unnoticed to the delineator, when the delineation is handmade.
3.3 Automated tracking of the Atrato delta’s shoreline erosion/progradation processes
We overlapped the composites of different years between 1985 and 2019 to determine changes in the shoreline of all mouths of the Atrato River Delta. With the shoreline polygons in GEE we measured how much area (in pixels) was gained due to progradation or lost due to erosion in 33 years [Figure 7].
Erosion and progradation processes
We observed several erosion and progradation hotspots along the shoreline, even far from the delta river mouths. We point out those hotspots in Figure 7. The most active erosion processes occurred at Leoncito, Burrera and Tarena mouths, being the latter the one that underwent the largest erosion process between 1986 and 2019. El Roto, Pavas, Matuntugo, Coquitos and Leoncito are the mouths with larger progradation processes. El Roto progradation in particular is remarkable, considering its relatively recent formation between 1898 [20] and 1930 [46], evolving to become the main river mouth nowadays.
Erosion
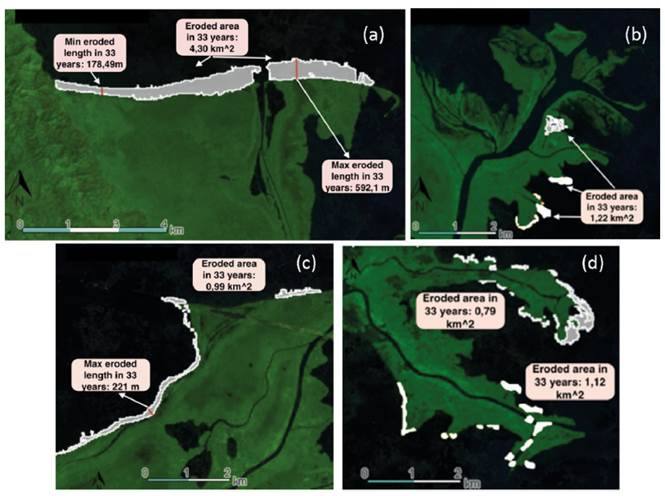
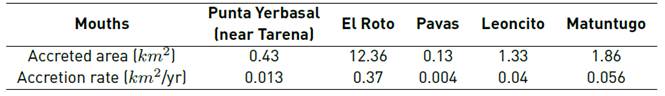
The overall coastal area eroded during that period was 10.19 km 2 (1,019 ha). Figure 8 shows the magnitude of the erosion at the hotspots identified on each of the delta mouths. We calculate differential erosion rates per year (subtracting between two consecutive periods) and an “average” rate (subtracting the last period from the first one). Table 1 shows the values of eroded area and maximum eroded length for all the Atrato mouths, as well as the average rates.
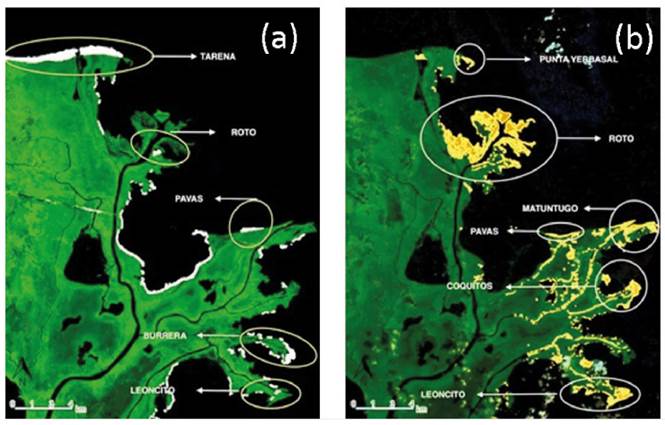
Figure 7 (a) Cumulative coastal erosion (in white) and (b) cumulative progradation (in yellow) at the Atrato delta in the period 1986-2019. We use the Landsat 8-2019 image for the erosion background, and Landsat 5-1986 for the progradation background
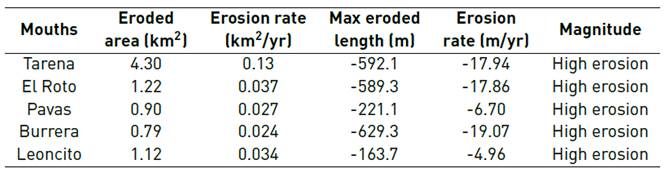
Tarena mouth locates near the open sea and its morphology, influenced by ocean waves, is prone to be eroded [20]. Tarena has the largest erosion process, accounting for 46.20% of the total area eroded between 1986 and 2019. The erosion at Tarena reached an area of 4.30 km 2 (432ha) in 33 years, and a maximum eroded length of the shoreline of 592.1 m, with a mean shoreline recession of -17.94 m/yr [Table 1]. According with the classification proposed by [43], Tarena experienced high erosion (≥-1.5 m/yr). Furthermore, since El Roto became the main mouth, much of the flow and sediments were diverted from Tarena, diminishing the contribution of sediment loads and favoring its erosion [46].
El Roto is the second mouth with marked erosion, with an area loss of 1.22 km 2 and a shoreline recession of -221.01 m, between 1986 and 2019. The loss rate was -17.86 m/yr, which fall in the category of high erosion.
The Pavas mouth in turn locates near open sea, is an abandoned delta distributary, similar to Tarena. Therefore, given the river-dominance in the delta formation and the sediments decline, the mouth is prone to coastal erosion and shoreline recession. This is clear when we compare images from different periods. For instance, the water channel in Pavas widens between 2010 and 2019, indicating a tendency to reactivate the branch by connecting it to the river.
Burrera was the mouth with lower area lost to erosion, with 0.79 km 2. Pavas and Leoncito mouths presented values of 0.90 km 2 and 1.12 km 2 respectively.
Erosion and shoreline recession show different magnitudes, which means that, although Pavas was the second mouth with area lost, its shoreline recession value was the fifth between seven analized mouths. This is due to the shapes of the coastal erosion area: while Burrera has a rounded shape, concentrated on one area (a portion of the lobe), the erosion on Pavas occur parallel to the shoreline and spreads along a large area.
Progradation
Progradation processes are important in almost all delta mouths, except for Tarena. Unlike erosion, which is distributed along all shorelines in the Delta, progradation concentrates in the mouth zones. This pattern could be due to the direct accumulation of sediments in the confluence of marine and fluvial processes that allow the deposition in the distal part of the mouths, before the final deposition of suspended sediments in the Gulf of Urabá.
The total progradation area along the shoreline of the Atrato delta (including shorelines far from the mouths) was 17.68 km 2 (1,768 ha). We select the branches and mouths with the main progradation processes to determine their behavior and to calculate the gained area [Figure 9 and Table 2]. Progradation is especially noticeable at El Roto mouth, which is currently the main mouth and therefore transports most of the river’s flows and sediments. Low in magnitude but with an important extension, Leoncito mouth presented also a remarkable area of progradation. Currently, El Roto is the main river distributary which created a small bird-foot delta [46] [Figure 9]. El Roto branch is divided into several outflows, together accounted for a total progradation area of 12.36 km 2. This progradation exceeds the overall area lost due to erosion.
Progradation at El Roto mouth is not uniform, but forms islands and spikes around the main channel, with progradation lengths that vary from 1,837 m in its northwestern part to 4,841 m in its central part. The formation of these islands and spikes occurred around 1989.
Punta Yerbasal, a coastal spike, is a relatively recent formation (in 1986 it was barely noticed). As reported by [46], the formation of Punta Yerbasal was a consequence of the progressive deactivation and consequent coastal erosion of the Tarena mouth: sediments from the erosion in Tarena helped create Punta Yerbasal, that in 1990 had a length of 650 m [46]. We determine that, in 2019, this length reaches 1,084 m, with a progradation rate of 32.8 m/yr.
At Pavas and Matuntugo mouths the progradation was small (0.13 km 2 and 1.86 km 2 respectively). Despite its proximity, Matuntugo mouth shows larger progradation than Pavas, which has larger areas of erosion than progradation. The reason for this is likely the loss of sediment inputs due to the disconection of Pavas from the river at some point before 2010 [Figure 10].
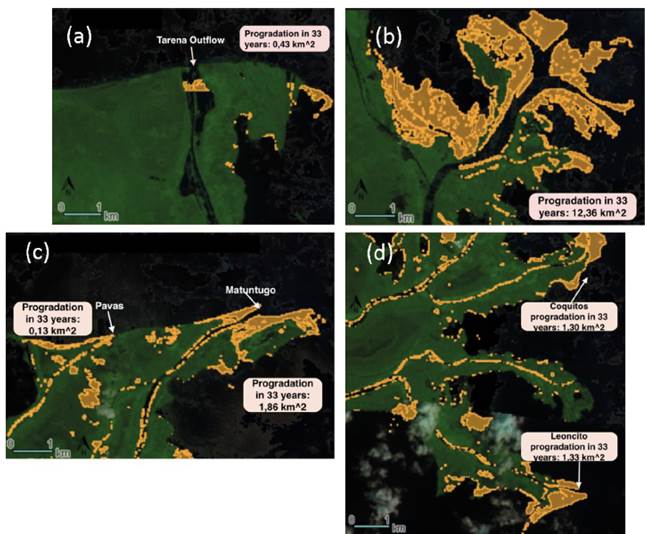
Figure 9 Progradation hotspots at the Atrato delta mouths: (a) Punta Yerbasal, (b) El Roto, (c) Pavas and Matuntugo, (d) Coquitos and Leoncito
A Landsat image of 1973, showed that Pavas mouth was actively connected to the main Atrato channel and did not have a direct output to the Candelaria Bay. The closing of Pavas occurred sometime between 2001 and 2011 (based in Landsat images 1996, 2001 and 2011) and field evidences exhibit sediments accumulation and vegetation growth that serves as a kind of natural plug. From 2011, the active erosion in Candelaria Bay rised Pavas channel and connected this mouth with the sea. Last images, dating from 2018 and 2019, reveal a new possible activation of this channel, mainly in the east side, but feeding for sea water.
3.4 Annual and cumulative rates of erosion and progradation
Figure 11 shows the Pareto charts of annual and cumulative values of erosion/progradation for each delta mouth and its vicinities. Cumulative values (red/blue lines for erosion/progradation) allow to watch trends in the evolution of the mouths, while annual values (red/blue bars for erosion/progradation) allow to explore changes in a particular year. In almost all delta mouths we find a dominant process, except for the Leoncito mouth that presents both erosion and progradation. Erosion at Leoncito spreads slightly over its shorelines, whereas progradation concentrates in specific areas, such as the delta’s mouths and spikes [Figure 7]. Progradation is the dominant process in Coquitos, El Roto and Matuntugo mouths whereas erosion is the dominant process in Burrera, Pavas and Tarena-Yerbasal. Except Tarena-Yerbasal, almost all progradation concentrates in the area where the river branches meet the ocean, which is consistent with the definition of the Atrato as a river-dominated delta. Progradation at Tarena-Yerbasal occurs east of the Tarena mouth, in Punta Yerbasal spike.
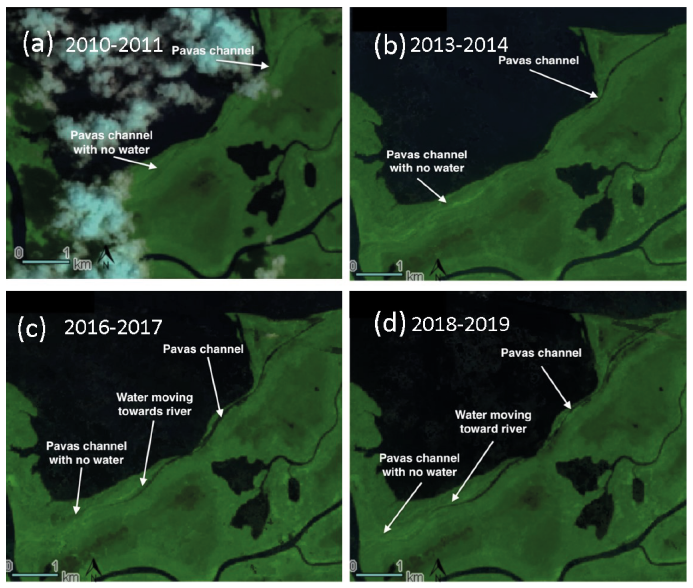
Figure 10 Evolution of Pavas branch, the water is moving through the dry channel from the sea towards the river
In 1997-1998, 1999-2000 and 2010-2011, 2013-2014 all the delta mouths experienced a remarkable change in the tendency of their dominant processes, stepening their rates. These changes coincide with strong La Niña events occurred between 1998-1999 and 2010-2011, which could explain the observed accelerations. Although less evident, the same happened in 1989-1990, which coincided with another La Niña event in 1988-1989 [47]. On the other hand, Burrera, El Roto and Matuntugo mouths presented negative values in particular periods. In El Roto, for instance, this change implied that some features that appeared in 2013-2014 disappeared afterwards in 2015-2016.
According to Figure 11, all non-dominant processes, after the first year of analysis, have a tendency to stabilize after 2013-2104, except for the Leoncito mouth that shows this tendency after 2015-2016 and Pavas mouth that shows a small change in 2010-2011 and stabilizes again. Nonetheless, the dominant processes did not show this tendency. Although the slope of the cumulative line decreased after the same periods, these lines showed a constant growth. The change in slope of the cumulative lines indicate that mainly the dominant processes and in some cases the non-dominant processes respond to particular climate events (i.e., La Niña years), although dominant processes may also respond to additional forcings that drive the continuity of the process (i.e. land cover changes at the Atrato river basin and hydrodynamics of the Gulf of Urabá).
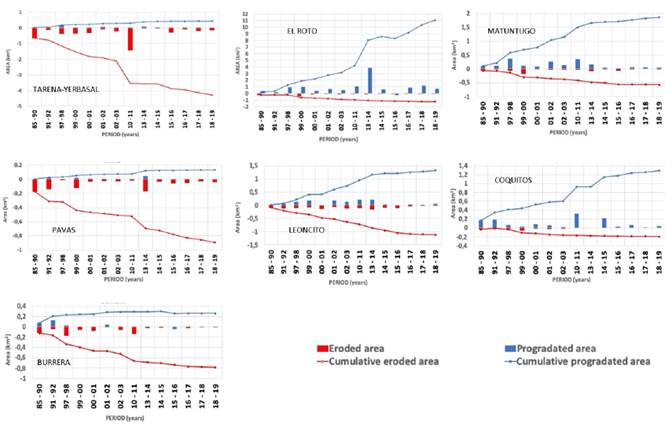
Figure 11 Cumulative (lines) and annual (bars) area evolution at delta mouths. Erosion in red, progradation in blue
Figure 12 shows the most representative mouths in erosion and progradation processes, the Tarena-Yerbasal and El Roto respectively. In this figure, we observe that 2013-2014 was the period with the larger progradation, and 2010-2011 the period with the largest erosion process to date.
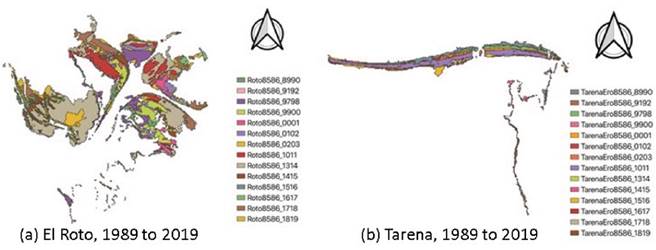
Figure 12 Annual evolution of the progradation and erosion at the mouths (a) El Roto and (b) Tarena-Yerbasal
Figure 13 summarizes the overall erosion and progradation between 1986 and 2019, as we obtained them from our algorithm [Figure 13a) and delineated by hand [Figure 13b). Results in both images are similar, although the delineation by hand shows less detailed polygons in some places, where clouds may have hindered the real shoreline. The calculations based on the handmade delineation yield a total erosion area of 9.40 km 2 (compared to 10.19 km 2 of the automatic calculation) and a total progradation area of 15.74 km 2 (compared to17.68 km 2 of the automatic calculation) over 33 years. These values slightly differ from those obtained with the GEE algorithm in approximately 7.8 % for erosion and 11 % for progradation.
We consider the manual delineation suitable, although the expert could ignore details that GEE is capable to detect. However, both methods show the same trends, demonstrating that progradation is the dominated morphological phenomena in the delta.
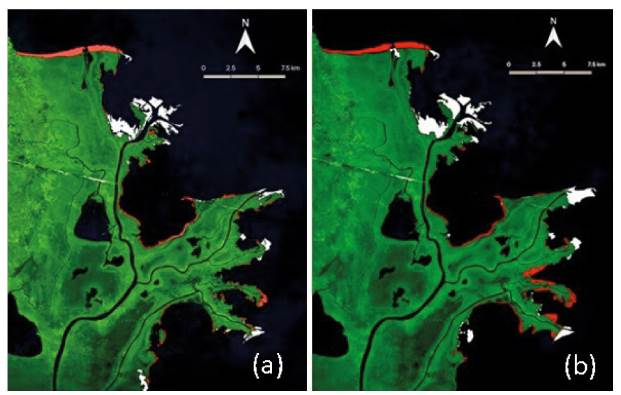
Figure 13 Erosion (in red) and progradation (in white) processes along the Atrato delta between 1985 and 2019. Comparison between (a) automatic delineation and (b) handmade delineation
The trends are consistent with academic works developed in the same area by [20, 43, 46, 48]. These studies used cartography, satellite imagery and field validation and showed the same trends as we do now in our research. Hence, we are confident that our algorithm is an efficient tool to track shoreline erosion/progradation processes. Furthermore, the algorithm is suitable for areas with limited access to field data and computational resources.
3.5 Possible causes of the progradation and erosion in the delta
The progradation and erosion trends identified in our study may be linked to multiple causes. The more evident are the river sediment loads and the marine influences. Some authors claim the delta grows slowly, compared to other smaller deltas over the eastern side of the Gulf of Urabá, due to the ocean drift (longshore currents) that does not allow sediments to be deposited along the gulf [19, 46, 49]. These claims are supported by historical cartographic reviews of satellite images and maps dating from 1817 to 1846 [50], which show a relative stability of this landform over 170 years, up to the switch of influx from the Tarena mouth towards El Roto in the 1930s. Despite the lack of records, several authors coincide that the delta progradation is the result of high sediment loads transported by the river [17, 21, 46]. High erosion rates in the Atrato river catchment also help explaining high sedimentation rates towards the northeast of the Gulf [51]. The low sinuosity of the Atrato river in the delta is likely due to the densely vegetated floodplain and to resistant river banks. As the bank-full discharge is not so different from the average discharge, only severe floods are capable of eroding the riverbanks. However, even under severe floods, the banks will probably prevent masiver erosion in the mouths [17].
The lack of sea level records in the gulf limits the quantitative assessment of the influence of longshore currents in the erosion at the shoreline. However, [21] points out that erosion occurs mainly far from delta mouths (where river dynamics predominate) and is associated with a north to south coastal drift maintained by north winds on a coast with almost perpendicular orientation and extreme events of swell, which is precisely what we identified in our analysis.
From a geological perspective, the Atrato delta could be affected in the long run by subsidence of sedimentary sequences towards the west [19, 49, 52]. Grain size studies of surface sediments determined the presence of sand deposits in front of the delta mouths [53], an aspect that confirms the relative occurrence of the progradation, but not necessarily support the idea that these coarse sediments come from the delta flow. These sediments could be more related with marine contributions [53]. However, as we see in our analysis, the North-South direction of sediment transport does not show constant sediment deposits in this sector of the delta.
As pointed out by [49] a cross-cutting factor for the development of the delta is a 2400-year sea level decline that has favored progradation in the northeast direction and has possibly increased over the past 200 years, with the growth of anthropic activities related to logging and mining. Deforestation and mining are factors that contribute to increase the sediment loads in the Atrato river and delta [21, 54, 55]. In 2018, for instance, 47% of deforested areas in Colombia were detected in the Atrato basin [26]. Gold mining in particular, had a peak in legal production between 2010 and 2012 in the basin [26]. In Figure 14, we compare progradation areas with this legal mining production (records do not take into account illegal mining).
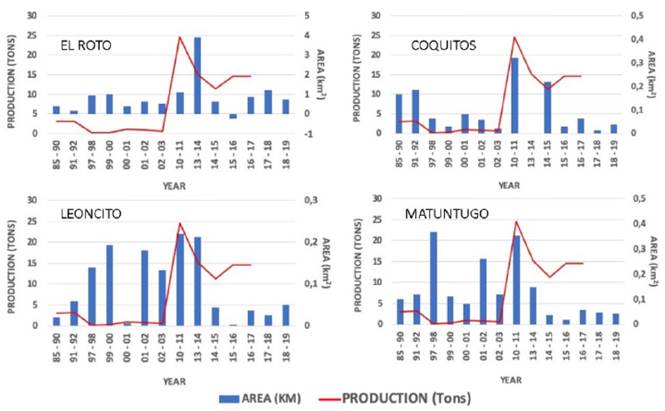
Figure 14 Relationship between legal gold mining production in the Atrato basin and annual progradated areas at its delta mouths
In any given year, we measured progradation from November to April whereas gold production records go from January to December. Therefore, in Figure 14 we can assume a relative lag of approximately one year between coincident peaks in mining production and progradation at Coquitos, Leoncito and Matuntugo mouths, whereas in El Roto mouth (which is the main mouth and thus has the longest branch) the lag is of two years. The peak of mining production matches also with La Niña years, which could further exacerbate sediment production and transport.
4. Conclusions
The shoreline delineations obtained with our algorithm in GEE were satisfactory, performing even better than delineations in higher resolution images drew by an expert, particularly when defining small areas such as islands and segments affected by some haze. The results improve when more images are available, especially in regions with high cloudiness and haze yearound. Nonetheless, verification is always important, since the presence of “noise” in the images (caused by high contrasts due to cloud shadows, for instance) may mislead the automatic delineation of the algorithm. This noise implies additional manual processing to clean the image in external softwares and eventually the discarding of the image composite.
The results of the automatic track of recent changes in the Atrato delta are consistent with the expectation for a fluvial-dominated, bird-foot delta. On one hand, progradation is the overall dominant process in the delta’s mouths, where branched rivers reach the ocean with large sediment loads (only Tarena and Pavas mouths, out of seven, exhibit erosion as the dominant process in their mouths). On the other hand, erosion is the dominant process along the shorelines, far from the delta mouths, where the ocean hydrodynamics is more relevant than the riverine factors.
Tarena and Pavas mouths experienced erosion instead of progradation, since both are branches that have experienced hydraulic disconnection from the river. Tarena used to be the main branch, but this condition changed with the consolidation of El Roto delta flow in the last century, which decreased Tarena’s flows and sediment loads, leading to the dominance of marine dynamics in this mouth. Pavas experienced a total disconnection from the Atrato River, which also explains why erosion is its dominant process. However, our analysis suggests that this branch is in a current process of reconnection, advancing from the ocean to the river, possibly related with changes in sea level (field data will be necessary to confirm and determine the causes of this trend).
Using the progradation and erosion areas calculated with GEE, we conclude that, overall, progradation is the dominant process in the Atrato delta, with a total area of 17.68 km 2 , while erosion encompasses only 10.19 km 2. As previously mentioned, certain mouths presented erosion as their local dominant process, but related to the decrease of river flow energy that allows tides and sea currents to promote erosion.
The values of progradation and erosion obtained with the automatic process differ in only few km 2 from the estimates based on handmade delineations. The automatic process shows higher values than the handmade. For erosion, the difference was 0.79 km 2 (7.8 %) and for progradation, 1.93 km 2 (11 %). These differences are within the expected outcomes, considering the capacity of the algorithm to detect details unnoticed by an expert.
When erosion or progradation are dominant, they seem to keep a growing trend along the years. However, when they are not dominant, they tend to stabilize or to switch. In certain periods, likely related to La Niña years, the trends accelerate. However, more research is necessary to establish a sound correlation between extreme events and the accelerated rates of erosion and progradation.
The increasing trends of dominant processes highlights the active nature of sediment loads in this delta. In this regard, the next stage is to investigate how other factors (i.e., tectonics, sea level oscillation, land cover changes, mining, the hydrodynamics of the Gulf of Urabá, the geomorphology of the delta, human interventions and climate change) affect these trends. In this regard, for instance, we found that mining may partially induce progradation in the delta, by increasing sediment loads in specific years (i.e., 2010-2012). Future studies could focus on investigating the relationship between mining and land cover changes with the increased progradation of the delta.
Finally, the algorithm that we developed is suited for any delta or coastline in which we are interested in gathering insights about general erosion and progradation processes (it would only require a change of coordinates and a delineation of a new polygon of the region of interest). The algorithm can be easily updated and improved. Furthermore, the algorithm offers the possibility of near real time analysis of areas with limited access to field data and computational resources.

