


 English (pdf)
 Article in xml format
 Article references
 Send this article by e-mail
 Cited by SciELO
  Cited by Google
  Similars in
SciELO
Similars in
SciELO  Similars in Google
 Permalink
1. Introduction
Human activities are estimated to have caused approximately 1.0ºC of global warming above pre-industrial levels[1]. These increases in global temperatures are associated with changes in the entire climate system, including snow and ice diminution, sea level rise, and the more frequent occurrence of hot extremes, heavy precipitation events, and drought and precipitation deficits in most inhabited regions across the globe[2]. These changes have impacted natural and human systems on all continents and oceans, configuring high risks for ecosystems and human populations. However, these risks are unevenly distributed and are generally greater for the most vulnerable human populations[2]. In this sense, northern South America (including Colombia) is among the regions with the highest vulnerability to the impacts of climate change[3], and the ecosystems and human communities along the region would face amplified or even new risks if temperatures continue increasing[1, 2, 4]. In particular, northern South America exhibits risks of reduced water availability, increased flooding and landslides, reduced food production, and spread of vector-borne diseases across different regions[2, 3, 5, 6].
General Circulation Models (GCMs) are one of the most used tools to evaluate the possible impacts of increased atmospheric concentrations of greenhouse gases (GHG) and anthropogenic aerosols, despite the systematic biases and uncertainties they exhibit[7]. The Coupled Model Intercomparison Project (CMIP) is an initiative that has allowed a better understanding of the climate system and its responses to human activities[8]. The fifth and sixth phases of CMIP (CMIP5 and CMIP6, respectively) include the most recent developments in global climate modeling[9, 10]. Although CMIP5 and CMIP6 models improved their simulations of global climate with respect to the previous generations, they still exhibit systematic biases and uncertainties[7] [11-14]. In particular, these models exhibit larger biases for precipitation than air surface temperature simulations not only at global[7, 13] but also at regional scale in northern South America, including Colombia[15-20]. In particular, the effects of clouds and aerosols and their interactions are among the causes for these persistent biases[7, 13, 21, 22].
Northern South America is characterized by distinctive spatial patterns of precipitation with variability at different timescales (e.g.,[23, 25]). In this sense, Colombia exhibits a wide range of diurnal and annual cycles of precipitation (e.g.,[23, 24] [26-31]). In particular, the annual cycle of precipitation in Colombia is strongly modulated by the meridional location of the Intertropical Convergence Zone (ITCZ) (e.g.,(23, 24, 26, 29, 30)). However, the wide range of precipitation patterns in Colombia is also influenced by the complex topography[23-27], the existence of low-level jets (e.g.[32-39]), the occurrence of Mesoscale Convective Systems[28] [40-44] and synoptic disturbances like the tropical Easterly Waves[45-47], among others, which configure different patterns for transport of atmospheric humidity and recycling in the region[43] [48-51]. These climatic patterns are strongly modulated by the El Niño-Southern Oscillation (e.g.[23, 25, 26] [52-58]).
Due to the interactions among such variety of phenomena, CMIP models have large biases simulating precipitation in the Andes, particularly in Colombia[16-20]. Among these different biases, CMIP models exhibit a systematic bias, known as the Double-ITCZ bias, which has persisted among all generations of CMIP5 models, including CMIP6, affecting the representation of precipitation in regions like Colombia[7, 11, 13, 15, 17, 20, 21, 34]. Given the importance of adequate model simulations for the present-day climate, as well as model projections under different GHG emission scenarios, for proposing adaptation and mitigations strategies at a regional level, this paper assesses how CMIP6 models represent the annual cycle of precipitation and air surface temperature in Colombia, and analyzes the persistent biases and new improvements in their simulation of these variables with respect to the CMIP5 models. This is particularly important before designing experiments intended to downscale the spatial resolution of GCMs simulations, which are currently about 100 km x 100 km[10], in order to obtain projections with a higher spatial resolution that facilitate decision-making at a regional level. We use several observational and reanalysis datasets, including gauge records from the Colombian Meteorological Institute (IDEAM) (section 2), to evaluate the simulations of the annual cycles of precipitation and air surface temperature in Colombia according to 49 CMIP5 and 33 CMIP6 models (section 3.1). We analyze the projections of these variables throughout the 21st century according to the highest GHG emission scenarios considered by the CMIP5 and CMIP6 models (3.2). Since simulations are biased with respect to reference datasets, we remove biases in simulated fields using a basic trend-preserving bias correction method and compare the bias-corrected projections with the original projections in order to identify changes in the spread of model projections throughout the 21st century (section 3.3). Finally, we analyze the historical simulations and projections from 9 CMIP5 models with downscaled simulations provided by the Coordinated Regional Downscaling Experiment (CORDEX) (section 3.4). CMIP6 CORDEX simulations are not considered since they are not currently available.
2. Data and methodology
2.1 Observational and reanalysis datasets
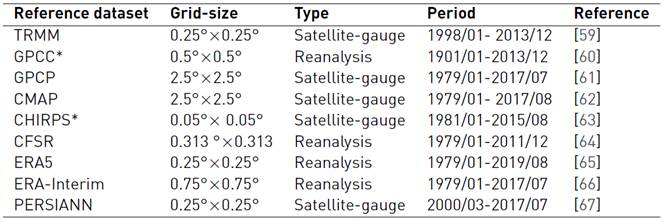
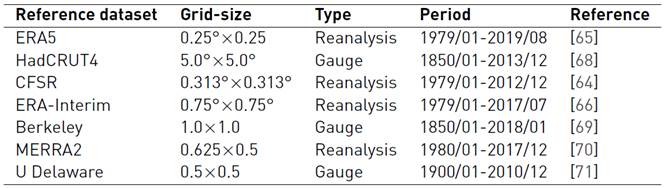
We use available observational, reanalysis, or merged data for precipitation and air surface temperature [Tables 1 and 2]. For precipitation, TRMM and the ERA5 reanalysis are considered as the reference datasets for precipitation and air surface temperature, respectively. In order to compare to reference data, observational and reanalyses datasets were re-gridded to each model resolution. To further evaluate the simulation of these fields by the CMIP5/CMIP6 models, gauges from the IDEAM network (http://www.ideam.gov.co/ web/tiempo-y-clima/clima) were also considered. Since the focus of this work is the mean annual cycles simulated by the CMIP models rather than in interannual or another variability, the long-term annual cycles (1981-2010) provided by IDEAM at the website http://www.ideam.gov.co/documents/21021/553571/Promedios+Climatol%C3%B3gicos+1971+-+2000.xlsx/857942de-f9d7-4d5e-bb75-df984aabe55f were used. About 1710 precipitation gauges were used to compute correlations with simulated annual cycles for the complete CMIP5/CMIP6 ensemble. For air surface temperature, about 457 gauges were considered. The number of gauges used depends on the horizontal resolution of each CMIP model since we consider only those gauges within the land mask provided by the model.
Table 1 Description of the observational and reanalysis datasets of monthly precipitation considered. TRMM is used as the reference dataset for this variable. * indicates datasets with data available only over the land
2.2 CMIP5/CMIP6 model outputs
We consider the monthly precipitation and monthly air surface temperature simulations from 49 CMIP5 and 33 CMIP6 models from their historical simulations, available for the period 1850-2005 and 1850-2014, respectively. In order to match with observations, simulations are considered for the period 1980-2005 for CMIP5 and 1980-2014 for CMIP6. To calculate the multimodel ensemble mean (CMIP5/CMIP6 ensemble), all models were re-gridded through bilinear interpolation to the coarsest resolution among models (3.75ºx3.71º) for CMIP5 and 2.23ºx3.75º for CMIP6). Two additional ensembles are computed from a set of 7 CMIP5 (7 CMIP6) models with the best simulation of present-day precipitation and temperature in Colombia, with a horizontal resolution of 3.75ºx1.9º (1.87ºx1.89º) for CMIP5 (CMIP6). The selection of these models is based on the analysis of the simulated annual cycles and the corresponding Taylor diagrams, as discussed in section 3.1.
We also analyze the projections from the different CMIP models throughout the 21st century. We consider the highest GHG emission scenario for both CMIP phases: The Representative Concentration Pathway (RCP) 8.5 in CMIP5, which has simulations during the period 2005-2100, and the Shared Socioeconomic Pathway (SSP) 5-8.5 in CMIP6, with simulations for the period 2015-2100. The RCP8.5 scenario considers no climate change policies, high GHG emissions, and the highest increase in global population, as well as land and forest degradation, exhibiting the largest pressure on ecosystems among the four available RCPs[72, 73]. The SSP5-8.5 scenario integrates climate policy assumptions for mitigation and climate change adaptation to the emissions trajectory of the RCP8.5, resulting in a different radiative forcing and CO2-equivalent concentration at the end of the 21st century[73-76]. Finally, we analyze the historical simulations and the RCP8.5 projections of 9 CMIP5 models with CORDEX simulations available. These CORDEX simulations[77] correspond to a dynamical downscaling of the original CMIP5 simulations, reaching horizontal resolutions of approximately 50km. We consider simulations for the Central American domain, which includes Colombia in the center of the domain (see https://cordex.org/domains/cordex-region-central-america-cordex/ for more details).
2.3 Evaluation of historical simulations and bias correction
We compute air surface temperature and annual precipitation cycles from multi-year monthly means over Colombia for both observational/reanalysis and model simulations. Taylor diagrams are used to quantify the spatial similarity of each model with respect to reference datasets[78]. In this sense, the models with the best simulation of the historical annual cycles for each variable are those with the highest correlation coefficient, the lowest root mean square error (RMSE), and the variance ratio closest to 1.0.
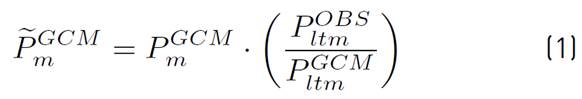
Model simulations, particularly from GCMs, often exhibit errors (or biases) with respect to observations. Some of these biases are systematic due to the limited spatial resolution, simplified parameterizations used to represent physic and thermodynamic processes, numerical schemes, among other features[7]. For this reason, it is important to bias-correct the raw GCM outputs to obtain more reliable climate simulations and projections for impact studies. Therefore, we apply a basic trend-preserving bias correction method for monthly mean fields, as described in[79]. The bias-correction method used here considers an additive and a multiplicative correction method applied to air surface temperature and precipitation, respectively. Hence a monthly correction parameter is computed for each grid point to correct the monthly simulated time series at each grind point (see Equations (1) and (2)]. The aim of this correction is to remove systematic biases in the simulated fields to obtain a simulated distribution closer to the observed distribution. The monthly correction parameters for air surface temperature are estimated based on the 1980-2014 period using ERA5 and all CMIP6 models. For precipitation, these parameters were obtained considering the 1998-2013 period, according to TRMM observations availability. The correction parameters are estimated as

where
 and
and
 are the corrected fields. Superscripts GCM and OBS correspond to simulated and observed fields, respectively, while subscripts m and ltm indicate if the timestep is monthly or long-term monthly, respectively. The expressions in brackets in Equations (1) and (2) constitute the correction parameters for the corresponding monthly field.
Projections are also corrected using the parameters obtained from Equations (1) and (2). We compare the original projections with bias-corrected projections to identify changes in the spread of model projections throughout the 21st century (section 3.3).
3. Results
3.1 Evaluation of historical simulations
Figure 1 shows the spatial patterns of precipitation and air surface temperature resembled by the reference datasets (TRMM and ERA5, respectively) and the mean CMIP5/CMIP6 ensembles, as well as the difference between these ensembles and the reference dataset. In general, the ensemble mean of the CMIP5/CMIP6 models does not reproduce the detailed spatial pattern of both variables in Colombia induced by the topography; however, CMIP6 models exhibit spatial patterns and magnitudes of precipitation closer to the reference dataset than CMIP5 [Figures 1f and 1g).
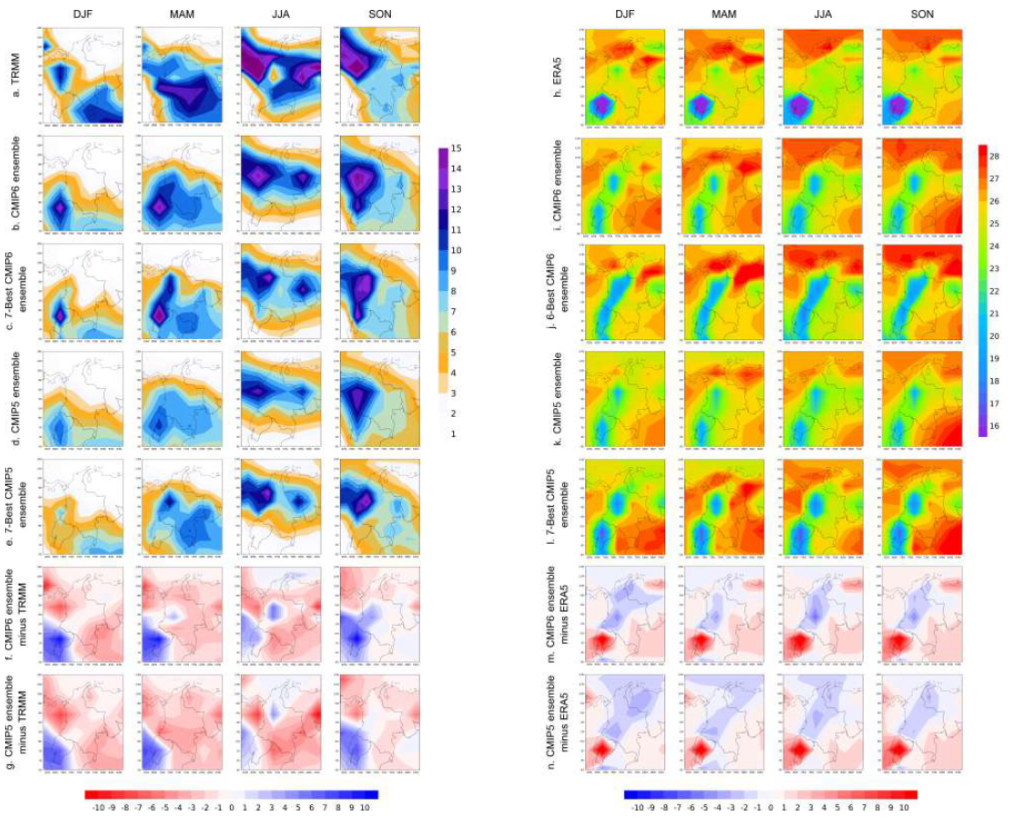
Figure 1 Seasonal mean precipitation (left; mm/day) and air surface temperature (right; ºC) over Colombia represented by the reference dataset ((a) TRMM for precipitation and (h) ERA5 for temperature), 33 CMIP6 models ensemble ((b) and (i)), 7-best CMIP6 models ensemble ((c) and (j)), 49 CMIP5 models ensemble ((d) and (k)), and 7-Best CMIP5 models ensemble ((e) and (l)). The two bottom panels show the biases of the CMIP6 ensemble ((f) and (m)), and the CMIP5 ensemble ((g) and (n)) with respect to the reference data.
For instance, CMIP6 models simulate the largest precipitation rates in western Colombia throughout the year, especially in September-October-November (SON), the increased precipitation in the Orinoco region during March-April-May (MAM) and June-July-August (JJA), and the increased precipitation over the Colombian Amazon during MAM [Figure 1c). Likewise, CMIP6 models capture the lowest precipitation rates in the Caribbean region of Colombia during the entire year, especially in December-January-February (DJF) [Figure 1c). Although the CMIP6 models reduced their mean biases with respect to CMIP5 models, they still underestimate precipitation in Colombia [Figure 1f). For temperature, both CMIP5 and CMIP6 models show a similar spatial pattern of their biases, with surface temperature generally underestimated in the Andean region of Colombia while overestimations are observed in the Colombian Amazon and Orinoco regions [Figures 1m and 1n). These temperature biases increase in the CMIP6 models, mainly over the Colombian Andes [Figures 1m and 1n), suggesting limitations in the new generation of GCMs to reproduce air surface temperatures in regions with complex topography like the north tropical Andes.
Another remarkable feature in the CMIP5/CMIP6 historical simulations is the precipitation underestimation and air surface temperature overestimation in Ecuador and the south equatorial Pacific with respect to TRMM [Figures 1f, 1g, 1m, and 1n). These biases could be related to the Double-ITCZ bias reported in previous studies[7, 11, 13, 15, 17, 20, 21, 34]. In general, the CMIP5 models show a biased eastern Pacific ITCZ, located southward of its observed location, inducing biases in their simulation of the Choco low-level jet[34, 80], a dominant feature of regional circulation associated with high amounts of precipitation in western Colombia (e.g.[23, 26, 32, 33, 35, 41]). This biased eastern Pacific ITCZ location is still observed in the new generation of CMIP6 models[13, 20].
Figure 2 shows the annual cycle of the domain-average precipitation and air surface temperature in Colombia, according to different observational/reanalysis datasets and each individual CMIP5/CMIP6 model. Most of the CMIP6 models considered are able to simulate the higher rain rates during the period April-November (peaking in April-July, as indicated by TRMM) with magnitudes closer to the observations than those simulated by the CMIP5 models [Figure 2a). In addition, several of the CMIP5/CMIP6 models underestimate the mean annual cycle of surface temperature in Colombia with respect to ERA5, while others overestimate this variable [Figure 2b). In general, models are able to simulate the lower temperatures during May-August. However, model biases in the annual cycle of air surface temperature in Colombia are larger than those for precipitation.
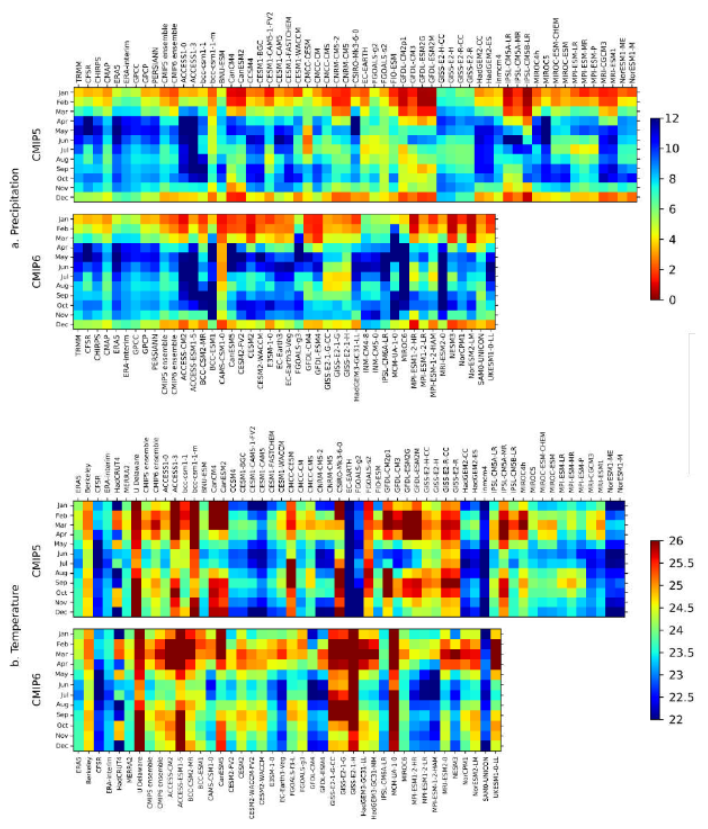
Figure 2 a) Annual cycles of domain-average precipitation (mm/day) over Colombia simulated by 9 observational/reanalysis datasets, 48 CMIP5 models, and 33 CMIP6 models. CMIP5 and CMIP6 ensemble means are also shown. b) As in a) but for air surface temperature (ºC) simulated by 7 observational/reanalysis datasets and the same CMIP5/CMIP6 models.
The annual cycles of precipitation and air surface temperature largely vary between different regions in Colombia[23-31]. Moreover, satellite products like TRMM (considered here as the reference dataset for precipitation) exhibit biases in Colombia, with overestimations in the Andes and underestimations in the Pacific region[81]. Therefore, we also compare model simulations with respect to climatological annual cycles from IDEAM gauges located across the country. Figure 3 [Figure 4] shows the correlations between climatological annual cycles of precipitation (temperature) from the IDEAM gauges and those simulated by the CMIP5/CMIP6 models. These correlations are computed following the methodology proposed by[18]. This methodology estimates the correlation between the annual cycle of all the gauges within the same grid cell of a particular model and the mean annual cycle simulated by the model in the corresponding grid cell. Then correlations for gauges within the same grid cell are averaged to obtain a mean correlation for each grid cell. The gauges considered for each model are those located within the land mask given by their horizontal resolution.
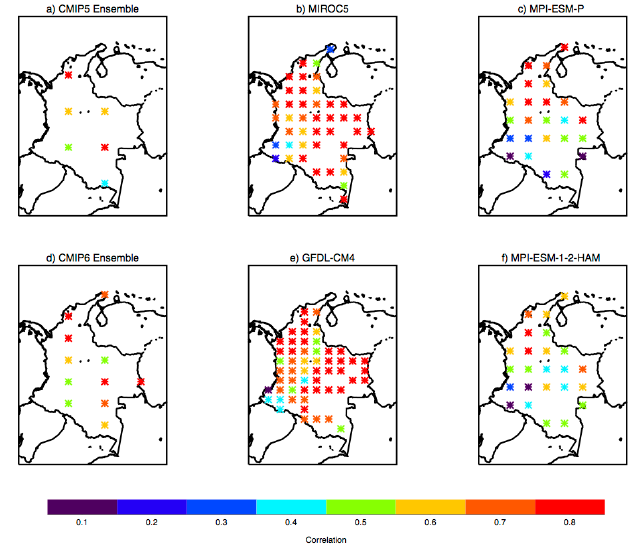
Figure 3 Correlations between the annual cycles of precipitation from IDEAM gauges and the CMIP5/CMIP6 models. a) Ensemble mean correlations of the 49 CMIP5 models (1710 gauges), b) MIROC5 model (1852 gauges), c) MPI-ESM-P model (1876 gauges), d) ensemble mean correlations of the 33 CMIP6 models (1713 gauges), e) GFDL-CM4 model (1775 gauges), and f) MPI-ESM-1-2-HAM model (1876 gauges). Only correlation coefficients larger than 0.1 are shown.
Correlations for the annual cycles of precipitation indicate that the CMIP5/CMIP6 models have positive correlations with the IDEAM gauges, although the CMIP5 models show lower correlations than CMIP6 [Figures 3a and 3d). Particular models are able to simulate annual cycles with much higher correlations than the complete ensemble of models, for instance, the MIROC5 (a CMIP5 model; Figure 3b) and GFDL-CM4 (a CMIP6 model; Figure 3e) models. In general, the CMIP6 models exhibit a better simulation of the annual cycle of precipitation in Colombia than the CMIP5 models, not only according to TRMM measurements [Figure 1] but also to gauge records [Figure 3].
On the other hand, the CMIP5/CMIP6 models poorly represent the annual cycle of air surface temperature in Colombia [Figure 4]. Correlation coefficients are lower than those observed for precipitation [Figure 3], even for models with a better representation of precipitation (MIROC5 and GFDL-CM4; Figures 4b and 4d, respectively). This suggests that CMIP5/CMIP6 models have larger biases simulating the seasonality of air surface temperature in Colombia according to gauge measurements, with stronger biases in the CMIP6 models, as also observed when comparing with ERA5 [Figure 1].
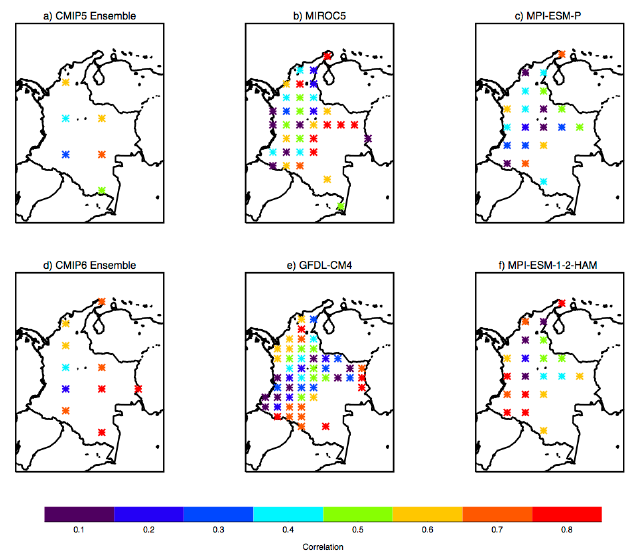
Figure 4 Correlations between the annual cycles of air surface temperature from the IDEAM gauges and the CMIP5/CMIP6 models. a) Ensemble mean correlations of the 49 CMIP5 models (457 gauges), b) MIROC5 model (503 gauges), c) MPI-ESM-P model (504 gauges), d) ensemble mean correlations of the 33 CMIP6 models (459 gauges), e) GFDL-CM4 model (482 gauges), and f) MPI-ESM-1-2-HAM model (504 gauges). Only correlation coefficients larger than 0.1 are shown.
For a more complete assessment of how the CMIP5/CMIP6 models simulate precipitation and air surface temperature in Colombia, Figure 5 shows the Taylor diagrams for these variables according to 8 observational/reanalysis datasets, 49 CMIP5 models, and 33 CMIP6 models. For air surface temperature, 6 observational/reanalysis datasets are considered. These diagrams use TRMM and ERA5 as reference data for precipitation and temperature, respectively. According to these diagrams, the best models simulating the variables of interest are those exhibiting the lowest RMSE, highest spatial correlations, and standard deviations closest to the reference dataset[78].
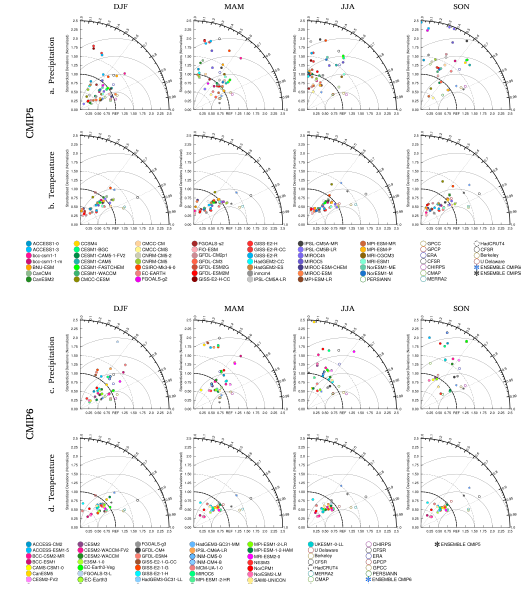
Figure 5 Taylor diagrams for seasonal simulations of (a, c) precipitation and (b, d) air surface temperature over Colombia according to the CMIP5 (a, b) and the CMIP6 (c, d) models. Observational/reanalysis data are shown in unfilled circles. Asterisks correspond to the CMIP5/CMIP6 ensembles. Reference data corresponds to TRMM for precipitation and ERA5 for temperature.
For precipitation, observational datasets show a better performance than the models. However, CMIP6 models show a reduced spread with respect to CMIP5 models, with higher spatial correlations and standard deviations closer to TRMM, suggesting an improvement in the ability of the CMIP6 models to simulate mean annual precipitation in Colombia [Figures 5a and 5c). In general, CMIP5/CMIP6 models have a better representation of precipitation in Colombia during DJF, while the largest spread is observed for SON. When comparing with the ensemble mean, most of the CMIP5/CMIP6 models show lower spatial correlations. Also, the CMIP6 ensemble has a standard deviation closer to TRMM than the CMIP5 ensemble [Figures 5a and 5c). Considering the Taylor diagrams for the four seasons of the year, the CMIP5 models with the best simulations of mean annual precipitation in Colombia are MPI-ESM-P, MPI-ESM-LR, GFDL-CM3, CEMS1-FASTCHEM, MIROC5, CMCC-CMS, and EC-EARTH. Likewise, the CMIP6 models with the best representation of precipitation are SAM0-UNICON, GFDL-CM4, FGOALS-g3, EC-Earth3, EC-Earth3-Veg, MPI-ESM1-1-2-HAM, and MPI-ESM1-1-2-HR. In particular, MIROC5 and GFDL-CM4 exhibit annual cycles of precipitation closer to gauge observations [Figure 3]. This suggests that the MPI and GFDL models generally have the best simulations of mean annual precipitation in Colombia, both in the CMIP5 and CMIP6 generations.
For air surface temperature, the CMIP5 and CMIP6 models exhibit a similar performance, showing less variability (lower standard deviation) than ERA5. In general, the CMIP6 ensemble shows lower correlations and larger standard deviations with respect to ERA5 than the CMIP5 ensemble [Figures 5b and 5d). This suggests that the CMIP6 models exhibit larger biases simulating seasonal air surface temperature in Colombia than the CMIP5 generation, as indicated by Figures 1, 2, and 4. According to the Taylor diagrams, the CMIP5 models with the best simulations of mean annual air surface temperature in Colombia are CMCC-CM, CNRM-CM5, CNRM-CM5-2, MIRCO4h, IPSL-CM5B-LR, IPSL-CM5A-LR, and CMCC-CMS. On the other hand, the CMIP6 models with the best temperature simulations are GFDL-CM4, GFDL-ESM4, PMI-ESM2-0, NESM3, MPI-ESM-1-2-LR, and MPI-ESM-1-2-HAM.
As expected, the ensemble means of the 7 best CMIP5 models, and the 7 best CMIP6 models show reduced biases of precipitation [Figures 1c and 1e) with respect to TRMM, compared with the complete set of models [Figures 1b and 1d). The best CMIP6 models show precipitation values closer to TRMM than the best CMIP5 models, suggesting an improvement of the CMIP6 models simulating precipitation in Colombia. By contrast, the best CMIP5 and CMIP6 models exhibit larger biases of air surface temperature over the Colombian Andes, although they reduce their biases over the Colombian Orinoco and Amazon regions [Figures 1j and 1l) in comparison with the complete set of models [Figures 1i and 1k). As observed for the complete set of models, the best CMIP6 models show larger temperature biases over the Colombian Andes while the biases are reduced in the Colombian Amazon and Orinoco regions. This is also observed in Figures 3 and 4, showing that CMIP5/CMIP6 models have lower correlations between simulated and gauge observed annual cycles of surface temperature in Colombia, mainly over the Colombian Orinoco and Amazon regions. This suggests that the CMIP6 models have larger biases simulating air surface temperature in regions with complex topography like the Colombian Andes than the CMIP5 models.
3.2 Projections throughout the 21st century
Figure 6 shows the projected changes of precipitation and air surface temperature in Colombia by the end of the 21st century (2071-2100) according to the SSP5-8.5 scenario (CMIP6 models). These changes are estimated as the difference with respect to the mean historical simulation (1971-2000).
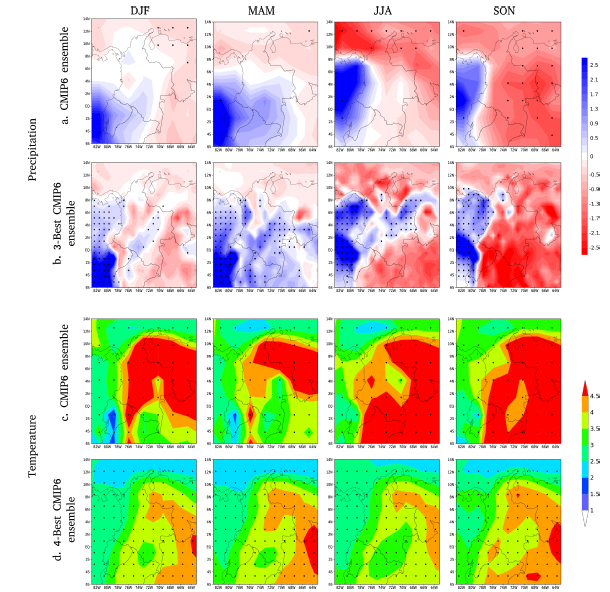
Figure 6 Projected changes of (a, b) precipitation (mm/day) and (c, d) air surface temperature (ºC), calculated as the difference between the mean SSP5-8.5 projection by the end of the 21st century (2071-2100) and the mean historical simulation (1971-2000) for each model considered. Dots indicate an agreement of at least 80% in the sign (+/-) of the projected change between the models considered in the ensemble: (a, c) CMIP6 ensemble and (b, d) Best CMIP6 ensemble.
The CMIP6 ensemble is computed considering the 20 CMIP6 models with SSP5-8.5 projections available. According to the CMIP6 ensemble, projections suggest increased precipitation in the Colombian Amazon in MAM and the eastern equatorial Pacific and Ecuador throughout the entire year, although there is no agreement between models. By contrast, projections show reductions of precipitation in the Orinoco and Colombian Amazon regions during JJA and SON, with higher agreement among models in SON [Figure 6a). The best CMIP6 models (only 3 models with precipitation SSP5-8.5 projections available) project changes of precipitation with spatial patterns similar to the CMIP6 ensemble; however, they do not exhibit the same agreement between models: while the CMIP6 ensemble shows agreement on the decreased precipitation in the Orinoco and Colombian Amazon in SON but no agreement on the increased precipitation over the eastern equatorial Pacific during the entire year and the Colombian Amazon in MAM, the best CMIP6 models show agreement over the regions with increased precipitation instead of the regions with decreased precipitation [Figure 6b).
The CMIP6 models project increased temperature over Colombia by the end of the 21st century, with large agreement among models indicating higher increases over the Orinoco and Colombian Amazon in JJA and SON [Figure 6c). The ensemble of the best CMIP6 models (only 4 models with SSP5-8.5 projections for air surface temperature) shows agreement on the warming signal over the entire region, although temperature increases are lower than for the CMIP6 ensemble [Figure 6d). The projections toward warmer temperatures in Colombia under high GHG emission scenarios have also been reported from CMIP5 models[19] [82-85].
To analyze the evolution of climate projections in Colombia throughout the 21st century, Figure 7 shows the projected change of domain-average monthly precipitation and air surface temperature during the entire 21st century for the CMIP5 and CMIP6 models under the RCP8.5 and SSP5-8.5 scenarios, respectively.
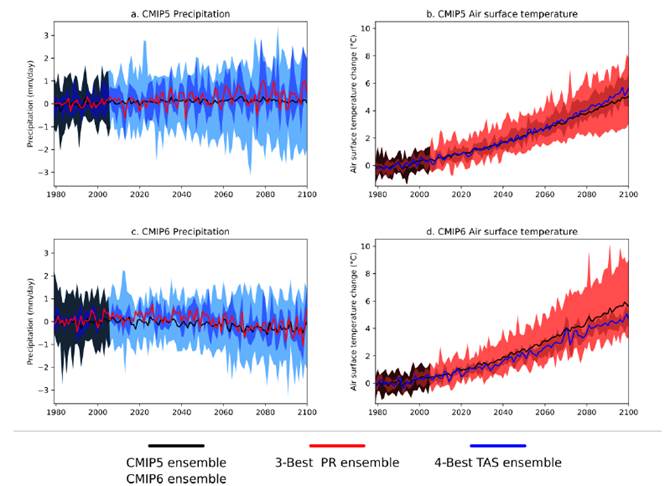
Figure 7 Projected changes of domain-average monthly precipitation (PR; mm/day) and air surface temperature (TAS; ºC) in Colombia during the 21st century for 49 CMIP5 models under the RCP8.5 scenario (a, b) and 20 CMIP6 models under the SSP5-8.5 scenario (c, d). Changes are computed relative to the 1971-2000 historical period. Black lines show the ensemble mean considering the 49 CMIP5 (20 CMIP6) models. Red (blue) lines represent the ensemble of the best models for precipitation (air surface temperature). Shading denotes the spread of the complete set of CMIP5/CMIP6 models for precipitation (light blue) and air surface temperature (light red), and the best CMIP5/CMIP6 models for precipitation (dark blue) and air surface temperature (dark red). Historical simulations are shown in the black shading.
The projections of the domain-average precipitation in Colombia suggest differences between CMIP5 and CMIP6 models. While the ensemble means of the CMIP6 models show a slight decrease of domain-average precipitation in Colombia throughout the 21st century [Figure 7c), CMIP5 models project slight increases of this variable [Figure 7a). The ensemble of the best models of each CMIP generation reproduces a projected change with the same sign as their respective complete ensemble [Figures 7a and 7c).
In addition, both CMIP5 and CMIP6 models project increased mean air surface temperature in Colombia during the entire 21st century, with increases of about 4-5ºC by the end of the century, according to both CMIP generations [Figures 7b and 7d). The warming projected by the best CMIP6 (CMIP5) models is lower (slightly higher) than that projected by the complete ensemble of models. Also, CMIP6 models exhibit a larger spread of temperature projections than the CMIP5 models [Figures 7b and 7d).
3.3 Bias-corrected projections
As discussed in section 3.1, CMIP5/CMIP6 models exhibit biases simulating historical precipitation and air surface temperature in Colombia [Figures 1 to 5). Therefore, we apply a basic trend-preserving bias correction method[79] for monthly means fields of precipitation and air surface temperature and analyze the projections suggested by the bias-corrected fields. Similar to Figure 7, Figure 8 shows the bias-corrected projected changes of the domain-average precipitation and air surface temperature in Colombia according to the CMIP5 and CMIP6 models under the RCP8.5 and SSP5-8.5 scenarios, respectively.
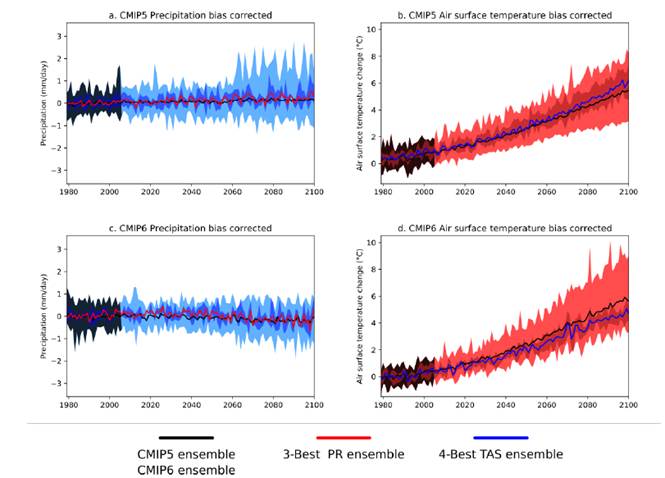
Figure 8 Bias-corrected projected changes of domain-average monthly precipitation (PR; mm/day) and air surface temperature (TAS; ºC) in Colombia during the 21st century for 49 CMIP5 models under the RCP8.5 scenario (a, b) and 20 CMIP6 models under the SSP5-8.5 scenario (c, d). Changes are computed relative to the 1971-2000 historical period. Black lines show the ensemble mean considering the 49 CMIP5 (20 CMIP6) models. Red (blue) lines represent the ensemble of the best models for precipitation (air surface temperature). Shading denotes the spread of the complete set of CMIP5/CMIP6 models for precipitation (light blue) and air surface temperature (light red), and the best CMIP5/CMIP6 models for precipitation (dark blue) and air surface temperature (dark red). Historical simulations are shown in the black shading.
Bias-corrected projected changes are similar to those suggested by the original projections; however, the spread of the model projections is reduced when applying the bias correction, mainly for precipitation [Figure 8]. Thus bias-corrected CMIP6 projections indicate a slight decrease in domain-average precipitation in Colombia [Figure 8c) and clear increases of domain-average temperature throughout the 21st century [Figure 8d). Bias-corrected CMIP5 projections show temperature changes [Figure 8b) similar to those from the CMIP6 models [Figure 8d) but slight increases of domain-average precipitation [Figure 8a), in opposition to bias-corrected CMIP6 projections [Figure 8c). However, projected changes in domain-average precipitation in Colombia are quite small according to both CMIP generations [Figures 8a and 8c).
3.4 CORDEX downscaled simulations and projections
As discussed in the previous sections, despite the improvements in the most recent generation of CMIP models, these models still exhibit coarse horizontal resolutions (about 100 km in CMIP6 and 200 km in CMIP5), which limits their ability to adequately simulate local processes like those related with the topography, as suggested by the large temperature biases observed in CMIP6 models [Figures 1 to 5). In this sense, different approaches have been considered to downscale CMIP simulations at finer horizontal scales. These approaches can be summarized in statistical downscaling and dynamical downscaling methods. The latter are generally based on the use of Regional Circulation Models (RCMs). In particular for Colombia, different works have used statistical methods to provide climate simulations and projections[16, 82] [84-86]. On the other hand, the use of RCMs has allowed the development of higher-resolution climate simulations in South America. For instance, dynamical downscaling exercises have been developed under coordinated frameworks such as the CORDEX[77] and the CLARIS-LPB project[87, 88]. Multiple studies have analyzed the simulations for South America from such coordinated experiments (e.g.[89-94]). However, other downscaling exercises have been developed for the region providing climate simulations and projections between 25 and 50 km of horizontal resolution[83] [95-99]. A complete review of regional climate downscaling in South America is provided by[19, 87, 93].
In particular, CORDEX has allowed the downscaling of CMIP5 simulations in Central and South America to horizontal resolutions between 22 and 50km[19], which represents an important reduction with respect to the CMIP5 models (roughly about 200km). Here, we analyze the historical simulations and RCP8.5 projections of 9 CMIP5 models provided by the Central American CORDEX simulations at a horizontal resolution of approximately 50km. We do not analyze CMIP6 CORDEX simulations since they are not currently available.
Figure 9 shows that the spatial distribution of the mean precipitation biases with respect to TRMM for the 9 models considered is very similar between the CORDEX and the CMIP5 historical simulations, with clear underestimation in most of Colombia, except in MAM, JJA and SON over the Colombian Andes, where both downscaled and original simulations overestimate precipitation with respect to TRMM. An overestimation of precipitation by the CORDEX and CMIP5 simulations is also observed in the equatorial Pacific throughout the entire year. These precipitation biases in Colombia and the equatorial Pacific are observed when considering the ensemble mean of the 49 CMIP5 models [Figure 1g). However, the downscaled CORDEX simulations exhibit precipitation biases in Colombia, with underestimations of about 6-8 mm/day in the Orinoco and Colombian Amazon and overestimations of about 8-10 mm/day in the Colombian Andes, mainly during JJA and SON. These biases are much larger than those in the original simulations, with underestimations of about 2-4 mm/day in the Orinoco and Colombian Amazon and overestimations of about 2-4 mm/day in the Colombian Andes. These precipitation biases in the ensemble mean of the CORDEX simulations are observed in the 9 CMIP5 models considered, particularly in the CNRM-CM5, CSIRO-Mk3-6-0, HadGEM2-ES, MIROC5, and MPI-ESM-LR models.
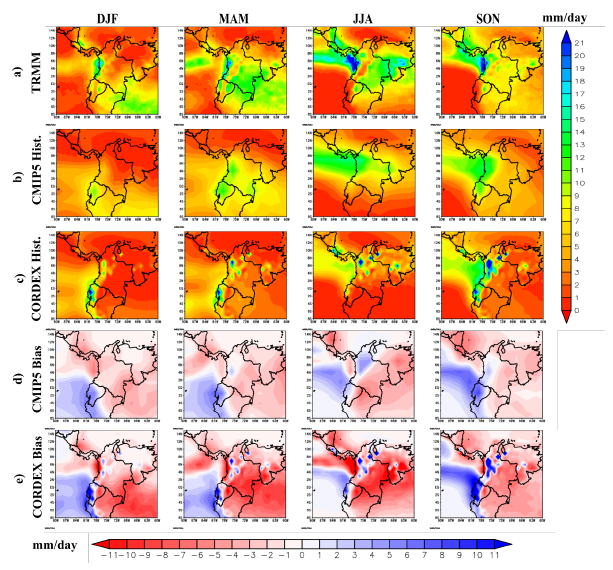
Figure 9 Multimodel ensemble mean of seasonal precipitation during the historical period 1976-2005 from 9 CMIP5 models with CORDEX simulations available. a) TRMM, b) CMIP5 simulation, c) CORDEX simulation, d) CMIP5 bias, and e) CORDEX bias. Biases are estimated with respect to TRMM.
The analysis of air surface temperature biases indicates that both CORDEX downscaled simulations and the original CMIP5 simulations overestimate temperature in Colombia with respect to ERA5, mainly in the Colombian Orinoco and Amazon regions [Figure 10]. The temperature overestimation in these regions is also observed in the ensemble mean of the 49 CMIP5 models [Figure 1n). However, CORDEX simulations exhibit significantly larger temperature biases (about 4ºC), mainly over the Colombian Orinoco and Amazon regions, than the original CMIP5 simulations (biases about 1ºC). These larger biases of surface temperature in the ensemble mean of the CORDEX simulations are observed in the 9 CMIP5 models considered, particularly in the CNRM-CM5, CSIRO-Mk3-6-0, HadGEM2-ES, IPSL-CM5A-MR, MIROC5, and MPI-ESM-LR models.
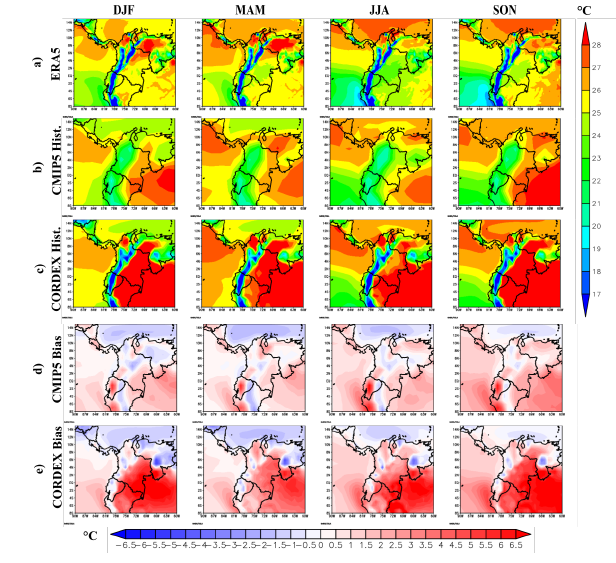
Figure 10 Multimodel ensemble mean of seasonal air surface temperature during the historical period 1976-2005 from 9 CMIP5 models with CORDEX simulations available. a) ERA5, b) CMIP5 simulation, c) CORDEX simulation, d) CMIP5 bias, and e) CORDEX bias. Biases are estimated with respect to ERA5.
Figure 11 shows the precipitation projections by the end of the 21st century from the 9 models with CORDEX simulations. Both downscaled and original simulations project increased precipitation in the equatorial Pacific during the entire year, as also suggested by the CMIP6 ensemble (with no agreement between models; Figure 6a) and the best CMIP6 models (with a high agreement between models; Figure 6b). The original CMIP5 projections for these models suggest increased (reduced) precipitation in Colombia in DJF and MAM (JJA and SON). The CORDEX simulations project larger reductions of precipitation over the Colombian Andes, mainly in JJA and SON [Figure 11d), than the original CMIP5 simulations [Figure 11c). However, the downscaled projections suggest opposite changes of precipitation over the Colombian Andes during DJF and MAM to those indicated by the original CMIP5 projections. This is mainly observed in the CSIRO-Mk3-6-0, HadGEM-ES, IPSL-CM5A-MR, MPI-ESM-LR, and NorESM1-M models.
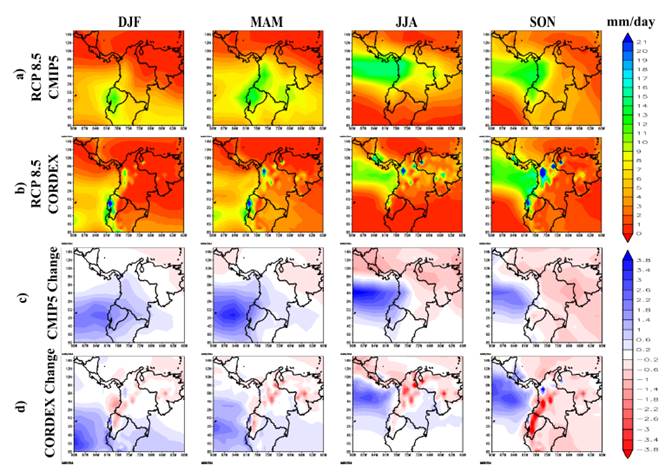
Figure 11 Multimodel ensemble mean of seasonal precipitation projections by the end of the 21st century (2071-2100) under the RCP8.5 scenario from 9 CMIP5 models with CORDEX simulations available. a) CMIP5 projection, b) CORDEX projection, c) CMIP5 projected change, and d) CORDEX projected change. Changes are estimated with respect to the historical period 1976-2005.
Figure 12 shows the air surface temperature projections from the 9 CMIP5 models with CORDEX simulations under the RCP8.5 scenario by the end of the 21st century. Generally, CORDEX and CMIP5 projections suggest warmer temperatures in Colombia by the end of the century, mainly over the Orinoco and Colombian Amazon, as also suggested by the CMIP6 ensemble (with a high agreement between models; Figure 6c). The projections toward warmer temperatures in Colombia under the RCP8.5 scenario are consistently observed in the ensemble of the 49 CMIP5 models [Figure 7] and the bias-corrected projections for these models [Figure 8]. In addition, the original CMIP5 simulations project higher temperatures in Colombia than the downscaled simulations, especially in JJA and SON. This is particularly observed in the CanESM2, GFDL-ESM2M, and MIROC5 models.
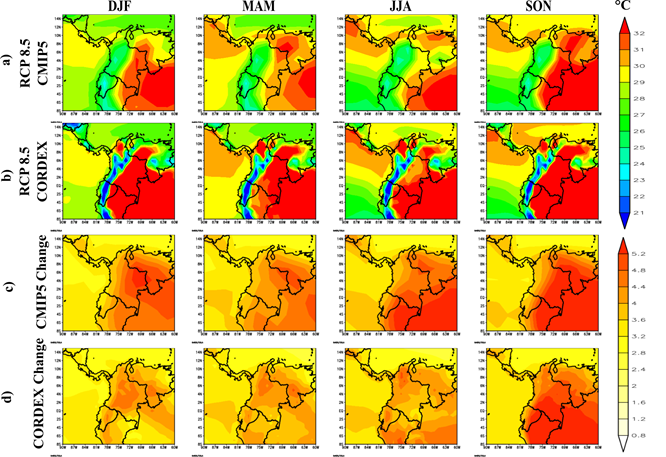
Figure 12 Multimodel ensemble mean of seasonal air surface temperature projections by the end of the 21st century (2071-2100) under the RCP8.5 scenario from 9 CMIP5 models with CORDEX simulations available. a) CMIP5 projection, b) CORDEX projection, c) CMIP5 projected change, and d) CORDEX projected change. Changes are estimated with respect to the historical period 1976-2005.
4. Summary and discussion
This work analyzes the performance of 49 CMIP5 and 33 CMIP6 models simulating the annual cycles of precipitation and air surface temperature in Colombia, and the projected changes in these variables by the end of the 21st century. Although previous works have analyzed CMIP5 simulations, this is one of the first works that systematically analyzes the available set of CMIP6 simulations and projections for precipitation and air surface temperature in Colombia, providing comparisons with a wide range of observational/reanalysis data: satellite measurements, merged datasets, gauge measurements, and reanalyses. In general, CMIP5/CMIP6 models underestimate precipitation and temperature in the Andean region of Colombia with respect to TRMM and ERA5, respectively, while the temperature is overestimated in the Colombian Orinoco and Amazon regions [Figure 1]. Our results suggest that the CMIP6 models have improved their simulation of the mean annual cycles of precipitation in Colombia with respect to the previous generation of CMIP5 models according to different observational datasets, including rain gauges [Figures 1 to 5). By contrast, CMIP6 models show larger biases simulating air surface temperatures in regions with complex topography like the Colombian Andes [Figures 1i, 1k, and 4], even when only considering the best models [Figures 1j, 1l, 4b, and 4e). Moreover, the CMIP6 models still exhibit systematic biases like the Double ITCZ [Figure 1], which affects their simulation of precipitation in Colombia [Figure 1]. The systematic Double-ITCZ bias has been widely reported in the literature[7, 11, 15, 17, 21, 34] and is persistent even in the most recent generation of CMIP6 models[13, 20].
The Taylor diagrams allow identifying the models with the smallest biases in their historical simulations of seasonal precipitation and temperature in Colombia [Figure 5]. Our results indicate that the CMIP6 models with the best simulations of seasonal precipitation in Colombia are SAM0-UNICON, GFDL-CM4, FGOALS-g3, EC-Earth3, EC-Earth3-Veg, MPI-ESM1-1-2-HAM, and MPI-ESM1-1-2-HR, while the models with the best representation of air surface temperature are GFDL-CM4, GFDL-ESM4, PMI-ESM2-0, NESM3, MPI-ESM-1-2-LR, and MPI-ESM-1-2-HAM. This suggests that the GFDL-CM4 and MPI-ESM-1-2-HAM models exhibit reasonable simulations of the seasonality of both variables in Colombia.
Projections under the SSP5-8.5 scenario indicate reductions of precipitation in the Orinoco and Colombian Amazon regions during JJA and SON, with a higher agreement among models in SON, as indicated by the CMIP6 ensemble [Figure 6a). Also, increases in precipitation are projected over Ecuador and the eastern equatorial Pacific, with a lower agreement between the complete set of CMIP6 models [Figure 6a). This is also observed when considering the best CMIP6 models, although the spatial pattern of model agreement differs from that observed from the CMIP6 ensemble [Figure 6b). When considering the domain-average precipitation in Colombia, CMIP6 models project slight increases while the CMIP5 models project slight decreases [Figures 7a and 7c), which is also observed after applying a bias correction [Figures 8a and 8c), suggesting that the projected changes of domain-average precipitation in Colombia are quite small according to the CMIP5/CMIP6 models. This could be related to the compensation of precipitation decreases projected over the Orinoco and Colombian Amazon and the increases projected over other regions [Figures 6 and 11).
On the other hand, the CMIP6 models project increased temperature over Colombia by the end of the 21st century with large agreement among models, showing higher increases over the Orinoco and Colombian Amazon in JJA and SON [Figures 6c and 6d). This projected increase of mean air surface temperature in Colombia is observed throughout the entire 21st century, with increases of about 4-5ºC by the end of the century, according to both CMIP generations [Figures 7b and 7d). This is also observed when applying a bias correction [Figures 8b and 8d). In general, CMIP6 models exhibit a larger spread of temperature projections than the CMIP5 [Figures 7 and 8]. This could be related to the higher climate sensitivity exhibited by the new CMIP generation[22, 100], which is not supported by paleoclimate evidence[101].
Thus, the analysis from CMIP6 projections suggests changes toward reduced precipitation and increased temperature by the end of the 21st century over the Orinoco and Colombian Amazon in JJA and SON [Figure 6]. These projections are also suggested by CORDEX downscaled CMIP5 projections [Figures 11d and 12d), although projected changes are larger for the CMIP6 models. Projected changes over the Colombian Andes are not clear, probably due to the larger biases of the CMIP models over this region characterized by a complex topography [Figure 1].
We also analyze downscaled simulations from the original outputs corresponding to 9 CMIP5 models provided by CORDEX. Figures 9 and 10 suggest that the CORDEX downscaling of these CMIP5 models does not necessarily improve the representation of mean values and spatial patterns of precipitation and air surface temperature in Colombia. One alternative is to use bias correction techniques over the outputs of coarse resolution simulations like CMIP5, CMIP6, and their available CORDEX downscaled versions, like discussed in section 3.3. However, even if the bias-corrected fields could provide a much better depiction of historical conditions, there is no guarantee that the same procedure applied to the model output of climate change scenarios (e.g., RCPs, SSPs) would provide a reliable picture of future conditions at a high resolution, since the bias correction methods could not capture the nonlinear response of smaller scales to the climate change signal beyond the large scale change already indicated by the coarse dynamical simulations[102]. This highlights the necessity of developing dynamical downscaling exercises and higher resolution modeling that consider the processes involved in precipitation and surface temperature variability in general[103], and particularly in the complex region of Colombia.
Part of the model biases is attributed to the problems of representing the effects of topography in simulations with a grid size of about 50 km and larger. Another important contribution to the biases might originate in the use of cumulus convection parameterizations, which is needed for simulations with a grid size ~10 km and larger. Many of the processes related to the physical mechanisms leading to moist cumulus convection take place at scales not explicitly resolved by GCMS, ESMs and RCMS. This means that all the models of these types evaluated in this study use parameterized cumulus convection. Regional climate simulations with resolutions of ~ 25 km and ~ 12km (using the parameterization of cumulus convection) have contributed valuable insight about the effects of mesoscale circulations and the differential and localized effects on precipitation and temperature over mountains and glaciers[104-107]. In the case of Colombia, more recent modeling efforts include the works by[98] [108-109]. In particular,[98] showed that for Colombia, simulations at 12 km might be suitable to study potential changes in precipitation with climate change by obtaining similar results with simulations at higher resolution (4km) but different from those of coarser resolutions (36km). However, models with parameterized cumulus convection usually have problems at simulating the diurnal cycle, frequency (higher than in observations), and intensity (lower than in observations) of precipitation[110-112]. These problems are partially related to a too strong coupling between the triggering of precipitation in cumulus schemes and the surface and lower atmosphere processes, which are tightly coupled to the diurnal cycle of solar radiation reaching the surface. Over the land, models tend to rain too early during the day, compared to observations, often missing the night precipitation and early morning clouds from elevated and organized convection during the night, all of which affects not only the simulation of precipitation but also might affect the simulation of the diurnal cycle of surface fluxes[112].
More recent studies and projects are conducted at the so-called convective-resolving scales (grid size 4 km or less) in order to avoid using cumulus convection parameterizations. At this resolution, the models usually simulate a much better diurnal cycle of precipitation, along with organized precipitation (like mesoscale convective systems) and hydrometeorological extremes much closer to reality[113, 114]. In the case of Colombia, some climate-like simulations at convective resolving scales include the work by[98]. In that study, results for Mexico show how at convection-permitting resolution the sequence and length of wet and dry spells are closer to observations compared with simulations with parameterized convection. It is expected that high-resolution regional climate simulations provide not only a better account of mean precipitation and temperature, but also a more realistic depiction of their variability both in space (e.g., over the Andes) and time (e.g., hydrometeorological extremes); this general expectation has triggered regional climate simulations with a grid size of 4 km, like the study by[115], over the continental United States. It is expected that similar studies for Colombia would not only reduce the biases in the representation of mean precipitation and temperature, but would also provide a better depiction of the occurrence of precipitation extremes and their potential response to climate change, local changes in precipitation, and temperature associated to land cover use and land cover change, the differential response of land glaciers to a warming planet, among others[102, 103]. Furthermore, higher resolution information is highly needed as input for other prediction systems like hydrological, agronomic, and economic models, besides providing better information to decision makers and stakeholders.

