


 English (pdf)
 Article in xml format
 Article references
 Send this article by e-mail
 Cited by SciELO
  Cited by Google
  Similars in
SciELO
Similars in
SciELO  Similars in Google
 Permalink
1. Introduction
United Nations recognizes that education is essential to achieve sustainable development and has declared it in 2015 as the 4th out of 17 goals in the 2030 agenda for sustainable development[1]. This goal and all the associated targets aim to ensure gender equity and improve the quality of education from early childhood care and pre-primary to college/university level. In addition, United Nations proposes free access to quality education for all boys and girls at primary and secondary education. According to the United Nations, remote learning remains out of reach for at least 500 million students, and the COVID-19 pandemic exacerbates inequalities in education, increasing the rate of students out of school by forcing school closures[2]. Contributions from several disciplines, including Operations Research, may have a significant impact on society, helping to close gender and accessibility gaps.
Operations/Operational Research (OR) helps managers of public and private organizations rationalize decision-making, system design, and other managerial activities with the help of analytic thinking based on the classical scientific method, models, and computers[3]. OR has been traditionally applied in profit-based systems, such as production and logistics, mainly focused on operational problems. However, the provision of services, particularly related to the public sectors such as education, was studied in the early beginnings of OR. For instance, existing reviews of the application of operational research to education show the early interest of the discipline to use their models and tools on this type of system[4]. The results of a basic search on Scopus combining the terms “Operational research OR Operations research” AND “Education” reveal a growing interest in this topic. The chronological distribution of the references on OR applied to education systems shown in Figure 1 illustrates how this non-traditional application field is gaining relevance and interest in the OR community.
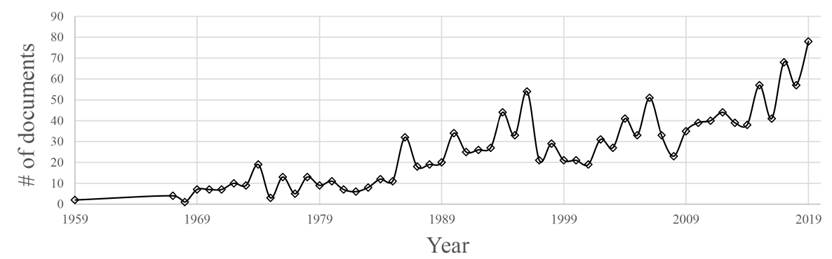
Figure 1 Chronological distribution of documents of OR applied to education (Search equation: TITLE-ABS-KEY (("Operational research” OR "Operations research”) AND “Education”), Source: Scopus database)
In general, people follow a process in the educational system that has similarities with industrial processes. In early childhood, students begin education in kindergarten, followed by primary school, secondary school, then additional stages of higher education or vocational education including undergraduate and postgraduate education. Some parts of the process such as primary and secondary school tend to be compulsory, while others are voluntary. Also, each part of the education process can be financed either with public or private resources, being public funding the most common. Likewise, most education services are non-for-profit, and classical objective functions aimed at cost minimization/revenue maximization need to be adjusted[5].
As pointed out in[5], OR is used to support decision making in education systems at different levels, including planning and resource allocation, efficiency and performance measurement, and routing and scheduling resources at the operative level. Planning and resource allocation applications aim at assigning human (e.g., faculty and administrative staff) and physical resources (e.g., monetary budget and space) to the different stages and units of the education process based on the forecasted number of students. This planning effort can be carried out at a nationwide level or within education centers like universities. For instance,[6] presents a comprehensive review of OR applications in higher education administration that includes financial planning and budgeting using goal programming and other optimization tools. Similarly, performance measurement of education systems is a rich application area for data envelopment analysis (DEA)[7] and statistical methods such as regression models as stochastic frontier estimation[8]. At the operational level, school bus routing[9, 10], and (course/examination) timetabling[11, 12] have received a lot of attention in the OR literature. Most of these operative problems have been solved using heuristics, metaheuristics, and hyper-heuristics. By contrast, in[13], the authors state that applications in this context have to embrace soft OR methodologies[14] since decisions in education systems tend to be strategic and unstructured problems as defined in[15].
As highlighted in[16], there is a need for data-driven decision making in education to give education administrators the required data to make informed decisions helping to remove politics and ideology from the process, among other benefits. Along this line of research, this work illustrates the application of OR in higher education for capacity planning, resource allocation, and performance measurement through three case studies. All cases are based on practical applications conducted in the Universidad de Antioquia-UdeA (ranked 45th in Latin America in 2020 and 4th in Colombia according to[17]).
The rest of the paper is structured as follows. The next section presents the case studies addressing managerial decisions and analysis at the Engineering School of the UdeA. For the sake of self-containment, each case includes the related literature, methodology, and results. Finally, Section 3 extracts some conclusions and outlines possible future research directions.
2. OR in higher education: three case studies
The case studies presented in this work are practical applications conducted in the Engineering School of the UdeA, one of the largest engineering schools in Colombia, with 8500+ undergraduate students, 500+ graduate students, 17 engineering programs, 800+ graduates yearly, and 157 permanent faculty as of 2019[18]. In the first case, we model and predict the students’ flow and required capacities needed to support the new curriculum design of the Industrial Engineering (IE) program using system dynamics, algebraic modeling of (new) dropout rates, and rough-cut capacity planning. The second case study is a course covering model for the new curriculum that considers the preferences and capacities of the teaching staff in an integer programming model. Finally, the third case study presents a data envelopment analysis (DEA) tool that is used to evaluate and rank the faculty of the Engineering School according to their teaching performance.
2.1 Case study 1: System dynamics for predicting the flow of students and allocating faculty staff
The IE Department at the UdeA is internally divided into three academic areas, namely: Management and Finances (Accounting, Management, Finance, and Economy related courses); Quantitative Methods (Statistics and Operations Research related courses); and Production, Logistics and Quality (Supply chain, Productive Systems, Quality Control and Process Management related courses). The curriculum of the program is based on these academic areas; in contrast, curriculum changes emerge over time to adapt to new trends in the field, the labor market, and the professional profile the program wants to offer to society. These changes lead to a new design of the program structure[19].
The IE curriculum is supported by two pillars: courses developed by the IE Department and others developed by the Engineering School. The Engineering School offers the compulsory courses shared with other engineering programs (e.g., Physics, Calculus, and English-related courses), socio-humanistic and complementary elective courses to give additional (soft) skills to the engineering students. The IE Department manages basic courses at the core of IE and other courses associated with the aforementioned three areas of IE, including professional electives.
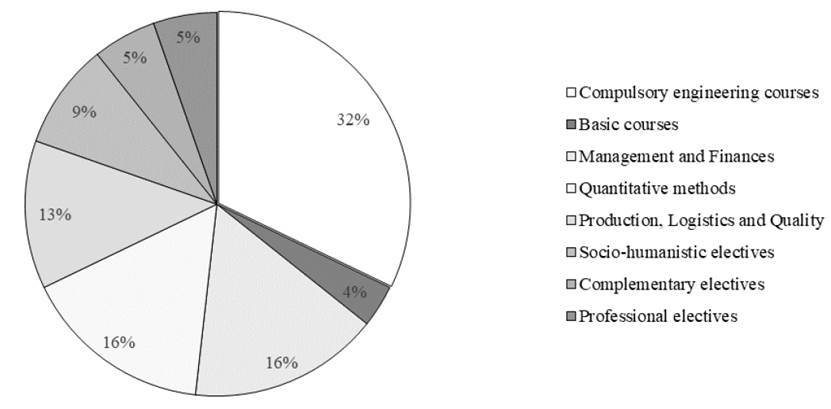
At the time of this work, the IE curriculum had 56 courses distributed, as depicted in Figure 2. To operate the program, the IE Department had 18 appointed full-time faculty positions assigned to the academic areas according to the general structure of the curriculum. A preliminary analysis had shown that faculty positions should be evenly distributed among the three academic areas within IE. However, changes in the curriculum, failed recruitment for vacant faculty positions, and generational shift motivated this new analysis.
Considering this new curriculum, there are few historical data to support the allocation of faculty positions to the areas of the Department. It is worth noting that faculty positions and their allocation is a controversial issue in university departments, with different priorities and views across universities. Moreover, resource scarcity adds complexity to this subject[20]. Likewise, the change in student enrollment and its impact on faculty allocation is well known to be a political issue where political forces within institutions try to favor some disciplines and study areas[20]. The IE Department of the UdeA is not an exception to these issues, so we designed a decision support tool to enlighten the discussion on faculty allocation and improve the objectivity of this decision.
Some administrative tools have been used to address this problem, such as consultation between faculties and administrators (e.g., deans or program directors) as reported by[21], where minimum workloads are defined based on some corporate governance policies, which usually results in inefficient assignments of teaching, research and outreach activities. Integer linear programming is used in[22] to model the phenomenon, using parameters defined through data mining. On the other hand,[5] refers to the use of Markov chains and discrete event simulation to improve the assignment.
In this paper, we use system dynamics (SD) to model the flow of students through the new curriculum to determine the number of sections needed for each course and then how the full-time faculty should be distributed in the areas to support the courses offered. We selected this methodology because it requires little data and its suitability for strategic (aggregate) decisions[23]. In particular, in[24], the author highlights the large number of applications of system dynamics in higher education. Their taxonomy includes systems dynamics applications in several areas: corporate governance, planning, resourcing, and budgeting, teaching quality assessment, teaching practice, microworlds, and enrollment demand models. Moreover, there are a few works that use SD as a (detailed) capacity planning tool[25]; our work follows this direction enhancing the SD capabilities with other tools like rough-cut capacity planning and algebraic modeling.
The IE program lasts ten semesters and admits between 85 and 92 new students per semester. As stated by[26], at the time of this work, the dropout rate of the program was 54% of the students. According to the analysis made by[27], dropout rates per semester were equal for the first two semesters and then between the third and tenth semesters. Also, half of the total dropout of the program occurred in the first two semesters. Moreover, as indicated in[27], the failure rate was 25% for courses in the first four semesters and 3% for courses in the following six semesters. This process of dropout and retention can be captured as follows:
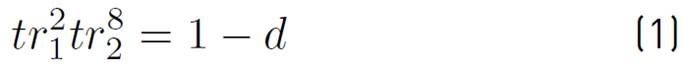
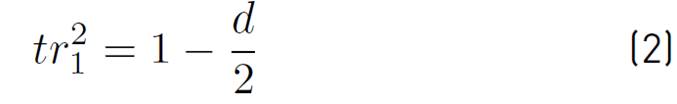
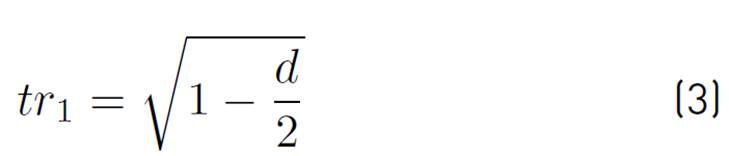
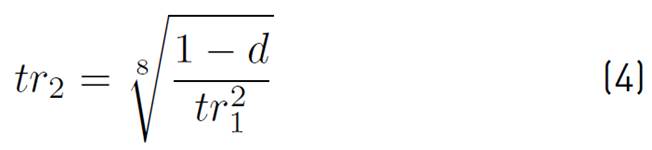
Where t 𝑟 1 is the retention rate of students per semester, for the first two semesters, 𝑡 𝑟 2 is the retention rate of students per semester, from the third to tenth semester, and 𝑑 is the total dropout rate. Equation (1) is a geometric progression that calculates the retention rate along the program differentiating the first two semesters from the remaining eight. This calculation is based on the total dropout rate. Then, knowing that the dropout in the first two semesters corresponds to half of the total dropout of the program, we can calculate 𝑡𝑟 1 2 as the complement of the half of the total dropout rate (Equation (2)], and, since in 𝑡𝑟 1 2 the exponent represents the number of semesters, we obtain the retention rate for semesters 1 and 2 in Equation (3). Replacing the value 𝑡𝑟 1 2 in Equation (1) and solving for 𝑡 𝑟 2, it is possible to find the retention rate for the remaining semesters (Equation (4)). Once we obtain retention rates, we also calculate the dropout per semester as the complement of the corresponding retention rate.
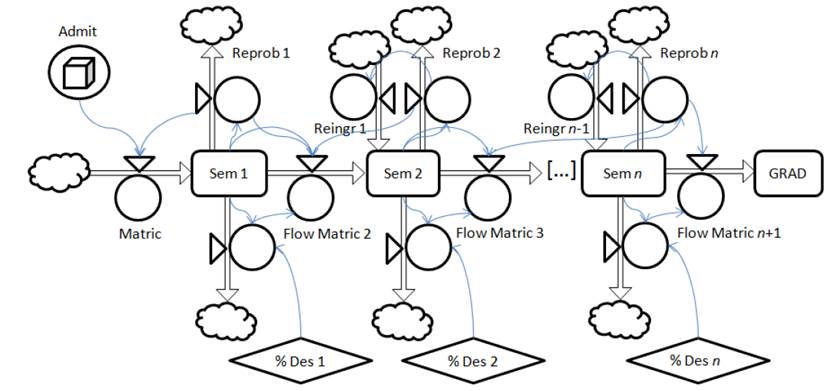
Figure 3 shows the system dynamics model representing the students’ flow through the 10 semesters of the IE curriculum. At the beginning, there is an acceptance rate that determines the number of students admitted to the program; those students are the input of the first semester. Once the semester ends, according to its retention and dropout rates, some students leave the program, and some students remain. Within the number of students that continue in the program, some of them fail courses and stay in the same semester for the next period; the rest are input for the next semester. We implemented this model in the simulation software Powersim[28].
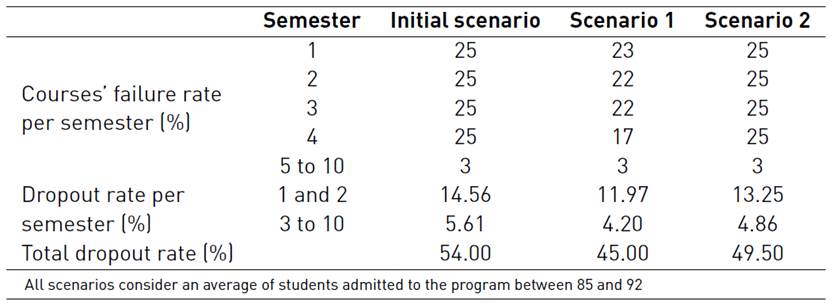
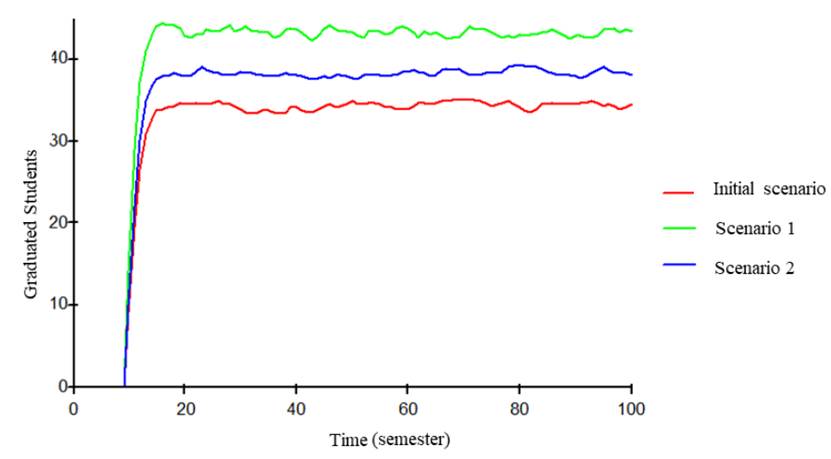
The main difference between semesters is the retention rates, as explained before, for each of the first two semesters, it is 𝑡 𝑟 1 and for each of the remaining semesters, it is 𝑡 𝑟 2 . Likewise, course failure rates are also different among semesters, according to data of[27]. First, we run an initial scenario with the data of dropout and course failure rates previously described; then we run two more scenarios using as an input the data found in the work of[27] where there is a complete analysis of dropout and course failure in the Engineering School.
Scenario 1 is an optimistic approach where we assumed that the total dropout rate would be lower than in the initial scenario thanks to the new curriculum design. Also, course failure rates were higher in the first four semesters (where compulsory courses are the main load on each semester). Still, this rate will decrease along this period influenced by the adaptation of students to the university and their migration between academic programs. From the fifth semester, course failure rates remain the same as in the initial scenario. Scenario 2 is a more conservative approach in which we assumed a total dropout rate higher than in the optimistic approach but lower than in the initial scenario. This scenario assumes that the course failure rate stays the same per semester as in the initial scenario. In both scenarios, we calculated the dropout rates per semester using the model from Equations (1) to (4). Table 1 shows the input data for the three scenarios.
After running the system dynamics model under the three scenarios, we obtained the resulting number of graduates (depicted in Figure 4]. In the simulation horizon, the number of graduates for scenario 2 stabilizes before the rest of the scenarios, and results have less variability. Likewise, according to the work developed by Ingeniería y Sociedad research group[27], scenario 2 has a more realistic configuration and would predict better the number of graduates of the IE program in the following years. For these reasons, we decided to analyze further results using this scenario as a base case.
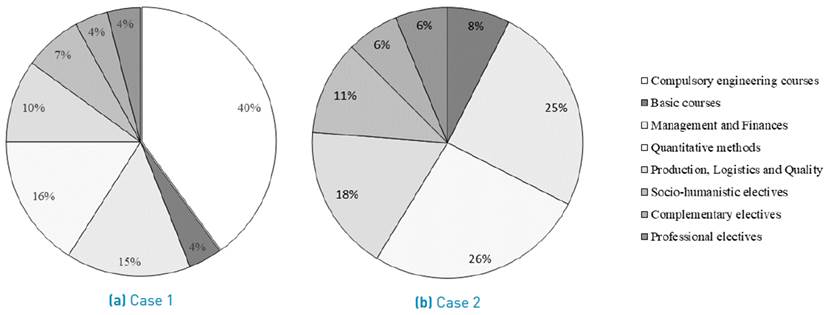
To plan the teaching load generated by the new curriculum, we analyzed the results of scenario 2 in two cases. The first case considers compulsory courses (shown in Figure 5a). Compulsory courses represent the core of the program containing most of the courses in the IE curriculum, followed by Quantitative Methods, Management and Finances, and Production, Logistics and Quality courses. Compulsory courses are managed by the Engineering School, not depending on the IE Department. Elective courses together are as representative as some of the academic areas.
The second case does not consider compulsory courses (shown in Figure 5b), only includes courses conducted by the IE Department. These results allow us to see the representativeness of every academic area in the curriculum in the number of courses offered. Furthermore, the electives are almost a quarter of the curriculum; then, it is worthy to evaluate the capacity of the Department to support them. The order of areas (in percentage of course sections) remains the same as in case 1.
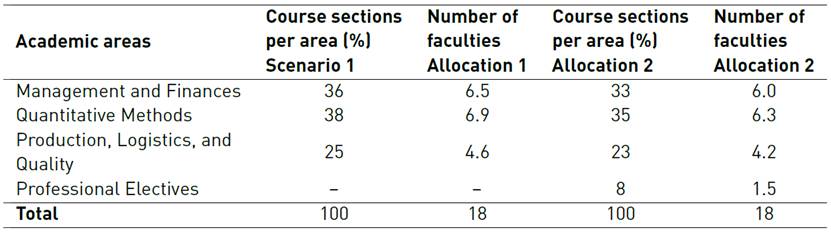
Following a rough-cut-capacity planning approach[29], after knowing the number of course sections, we determine how many full-time faculty positions should be assigned to each area. Table 2 shows the results for both scenarios, only considering the set of courses managed by the IE Department. In allocation 1, we assumed that professional electives were equally supported by the areas, while in allocation 2, electives were included in a separate way to analyze the number of positions needed to support those courses. The results show that Management and Finances and Quantitative methods needed approximately 6 faculty positions to support their courses, Production, Logistics, and Quality needed around 4 positions, and the remaining of the available positions should be distributed to professional electives.
Based on the results of this model, the IE Department opened the discussion of redistributing faculty positions to face a new curriculum guided by objective recommendations without bias of political views or assumptions in favor of some knowledge areas. That kind of discussion was part of the curriculum design phase that concluded with a new approved curriculum. One of the decisions made after this discussion was to assign one more faculty member to the Quantitative Methods area.
Comparing these results to other works allows us to identify that the use of quantitative methods to measure the efficiency of universities, including courses assignment as decision variables[30], achieves robust results that support decision-making based on objective data. Consequently, this outweighs the effectiveness of intuitive course assignment mechanisms based on the agreement traditionally used by some universities. Works that use fuzzy logic as an analysis scheme[31] also obtain efficient results that support decision-making and identify other ways of addressing course assignments, creating more flexible environments for the incorporation of new rules and variables.
However, in all the cases referred to, it is agreed that universities should improve the organization of their information records and data processing when feeding these kinds of allocation approaches. Some other works, such as[32], address the teaching assignment with an advanced approach, projecting the needs of the academic departments in training and taking into account teaching mobility. They use genetic algorithms considering different ways to occupy faculty positions as assistants, visiting, or part-time professors.
As a side result that validates our system dynamics model, we compared the graduates projected by our model with real data published by the UdeA yearly[33] (that were not available at the moment of our analysis). After 2012, the results produced by our model under scenario 2 are very similar to the reality (as can be seen in Figure 6 that shows an average yearly number of 90 graduates). This is an outstanding outcome showing how helpful is the use of operational research tools in the planning, tactical and operative stages of the decision-making process, even in non-traditional settings such as higher education.
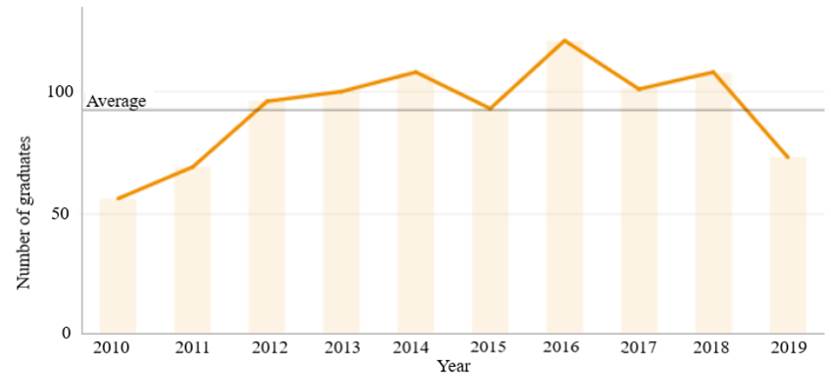
Figure 6 Number of graduates of the IE program by year. Source: http://www.udea.edu.co/wps/portal/udea/web/inicio/institucional/data-udea/formacion/graduados
A possible extension of our models includes a more detailed modeling of dropout rates by considering not two but three tiers (including in this way the different dropout behaviors of freshman, sophomore, and senior students). Likewise, the main assumption of this work is the one-to-one relationship of course sections and instructors; however, a current trend in the IE Department (and worldwide) is the modularization of courses (with different faculty in charge of each module), something that should be included in future models.
2.2 Case study 2: Course covering model
The new IE curriculum had novel and modified versions of some courses. This situation requires careful resource planning to guarantee the proper implementation of the program. We proposed the application of OR to know if the program had enough capacity (in terms of quantity and academic area of study) in their faculty to support this new academic offer. To address this question, we used a mathematical model inspired on the double standard model[34, 35] and other maximal covering extensions used in (ambulance) location[36].
Although facility location applications address mostly facility siting for product and service provision[37, 38], they have also been used for other non-location decisions. For instance,[39] presents a medical application where a double vision problem is formulated and solved as a p-median/p-center problem on a line. An early review of applications of the maximal covering location problem (MCLP) in machine learning (e.g., data abstraction, clustering, classification, discriminant analysis) and other non-location applications (cognitive process modeling, mail marketing optimization, etc.) is presented in[40]. The interested reader is referred to[41] for an updated review, including applications of the MCLP for product design, image processing, color selection for dental prosthesis, among others. Likewise, in[42] an integer programming model is used to assign employees to tasks with the option of employee firing and hiring. In their model, the authors consider employee skills and task requirements in a so-called ability space to minimize distances as in facility location models. Similarly, in[43], the authors present a multiobjective integer linear model to assign a task to employees according to their abilities. This model minimizes the distance between the employee and the task while avoiding boredom and minimizing inequities in the workloads at minimum cost. They use the weighting method to find the set of solutions and apply this formulation to a real problem in a company owned by the Pontificia Universidad Católica de Chile.
In the Colombian context, location models have been used conventionally. For instance,[44] addresses the three-echelon uncapacitated facility location problem that considers the flow of products from production plants to warehouses and then to clients, minimizing the cost of warehouses location and the cost of production and distribution of the product. A literature review in vehicle relocation for Emergency Medical Services (EMS) is presented in[45]. The authors in[46] present two multiobjective models to locate surveillance cameras in public transportation systems, optimizing the expected number of crimes detected and the image quality of the surveillance system. An application to a social program of food assistance in Colombia called Bienestarina is presented in[47]. They evaluate the current supply chain configuration of the program and propose improvements related to location decisions through a mixed- integer mathematical model. More recently, a location-routing model is presented in[48] to collect waste electrical and electronic equipment, locating the collection points, and assigning them the type of devices to be collected; then they design the routes to minimize costs. They also show a case study in Bucaramanga, Colombia.
What distinguishes this application from other related works is that we use location models as a capacity planning tool in an academic context, including faculty preferences. We face a tactical decision regarding the characteristics of education as a service, where the main resource to manage is people with specialized backgrounds and specific training. Particularly, it is important for this application to include the preferences of faculty members for the courses in the new curriculum and their commonalities with the academic areas because courses should be led by someone interested in the topic and whose abilities match the required knowledge. Also, this application seeks to measure the current capacity but also identify personnel needs to guide further decisions. According to the aforementioned literature review, this application of location models is a novelty, mainly in the Colombian context and in higher education planning in general.
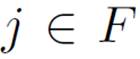
The notation of the proposed course covering model is stated as follows. Let S = {1, … , n} be the set of courses of the curriculum that we need to cover. Likewise, P = {1, … , m}is the set of the department faculty. Each professor
 has a preference
 for the course
 . The teaching load that is the maximum number of courses in charge per professor is denoted by b. The subset D
i
represents the faculty that can cover a given course
. The teaching load that is the maximum number of courses in charge per professor is denoted by b. The subset D
i
represents the faculty that can cover a given course
 . Finally, variable
 is equal to 1 when professor j is assigned to course i and 0 otherwise. Likewise, coverage variable
 is equal to 1 if course i is covered by k professors and 0 otherwise. Using this notation, the course covering model is formulated as follows:
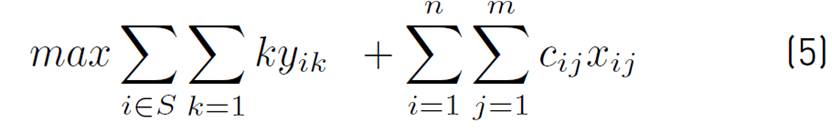
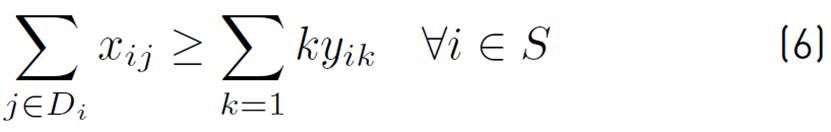
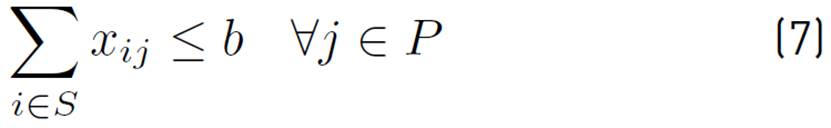


Equation (5) is the objective function that maximizes the number of courses covered considering professors’ preferences for every course. The first term in the objective function corresponds to the coverage of courses, and the second term is the professors’ preferences, following the structure of a lexicographic priority model. Equations (6) to (9) are the constraints of the model. Equations (6) represents the coverage of the courses guaranteeing that at least k professors could cover one course if it is counted as k covered. Equations (7) are the maximum capacity of coverage of each faculty, in number of courses. Finally, equations 8 and 9 define the decision variables as binary.
To collect data for the mathematical model, we applied a survey to the full-time faculty of the program, each one choosing five courses from the new curriculum that they were able to cover in descending order of preference. The coverage was defined as the ability and the will of the faculty to teach the course and manage it; this implies mainly to verify the validity of course’ contents in time and lead the teaching staff assigned to the different sections of the course, especially in the consistency among teaching plans for the semester. The new curriculum had 28 courses managed by the IE Department and 17 full-time active faculties.
Results from the survey showed some professors with some limitations to choose five courses of the new curriculum, completing the list partially. Probably because there are few courses in their academic area, the rest of the courses are too specific, and professors were not willing to cover them. Also, there are courses that were less preferred, and they were never chosen in the favorite courses to cover.
We implemented the mathematical model in IBM ILOG CPLEX Optimization Studio[49]. We used the data from the survey described previously, the maximum coverage capacity was two courses (b =2) and at least one professor will cover each course (k = 1). We just considered courses offered by the IE Department and the information about the faculty of this department only. We did not consider the number of sections per course.
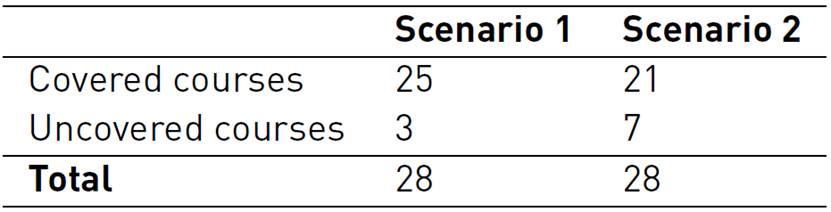
We used the course covering model in two scenarios. Scenario 1 considers all the faculty of the IE Department. Scenario 2 does not consider the professors that were about to retire. In both scenarios, we identified the uncovered courses, the teaching assignment to the courses of the new curriculum, and the academic areas that had a lack of resources. Academic areas are the same described in the previous case study. Table 3 contains the results for both scenarios. The percentage of uncovered courses is 10,7% for scenario 1 and 25% for scenario 2. It was expected that scenario 2 had more uncovered courses because we were considering a smaller number of professors.
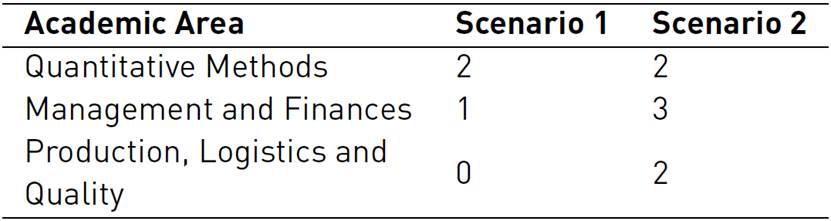
In addition, Table 4 shows the uncovered courses per academic area, where Quantitative Methods remains with the same number of uncovered courses through scenarios. By contrast, both Management and Finances and Production, Logistics and Quality increased the number of uncovered courses in scenario 2 because the teaching staff about to retire belong to those areas. In addition, uncovered courses have a lower frequency of preference in the survey; therefore, as the model maximizes the preferences of the teaching staff, these courses have no opportunity to be covered unless there is at least one professor that has chosen it with high preference.
As mentioned in the previous case study, the Quantitative Methods area received one faculty position, as an outcome of the analysis presented with the system dynamics model. The new faculty position was dedicated to supporting the uncovered courses, revealed by the results of the courses covering model. Moreover, identifying the specific courses that would need a new professor to cover them is an interesting and useful side result. These data revealed the need to hire more faculty members to cover other courses of the same area that did not have anyone responsible for leading and teaching them in any of the two scenarios.
This application could be extended to determine not only the faculties’ capacity deficit, but also the optimal number of sections and consequently the auxiliary professors needed to cover the courses, including budget or number of students per section as constraints. Also, it would be useful to extend the model to balance faculties’ workload considering teaching, administrative, and research activities following the preferences criteria.
2.3 Case study 3: A cross-efficiency model for teaching performance measurement
In our third case study, we change the area of OR application from planning and resource allocation to performance measurement. In this section, we describe the implementation of a DEA model for the teaching ranking of full-time faculty of the entire Engineering School. In their regulation, Colombia’s Ministry of Education includes an annual incentive for the faculty with the best teaching performance of the different schools of public universities. This incentive must be supported by a transparent evaluation mechanism with criteria fixed in an objective form[50]. For years, for the ranking process to select the faculty deserving this recognition, the Engineering School of the UdeA used an ad-hoc procedure that relies on subjectively assigned weights. In 2016, the Engineering School Council and its faculty agreed that enhancing this ranking procedure was needed. After testing several alternative approaches such as multidimensional scaling and data envelopment analysis, the latter approach was tested and implemented for this process.
Since its early beginnings, DEA emerged as a suitable methodology for the measurement of the efficiency of educational institutions and programs. In the seminal application[51], DEA is used to evaluate the effectiveness of Program Follow Through, a US Federal program implemented in the 70's for improving the education of children in deprived communities. Likewise, education is among the top-five economic sectors addressed in DEA applications[52]. For an updated discussion of DEA applications on education, the interested reader is referred to[53] and[54] and for an in-depth discussion of DEA concepts and application to[55].
Applications of DEA for performance measurement in higher education range from countrywide evaluation at the institutional level (e.g., public universities) to academic departments and individual faculty[56]. Particularly, evaluating teaching performance is a complex process involving objective and subjective criteria. For instance, it involves subjective weight assignment of the different criteria and subjective student evaluation. However, recent studies tackle this complexity in different ways. For instance, in[57], the authors combine the analytic hierarchy process (AHP) and DEA to transform student-declared preferences into quantifiable information. Similarly,[58] the authors also derive weight restrictions based on AHP and use conjoint analysis to derive quantifiable information from stakeholders’ opinions. Likewise, in a course-centered measurement, the authors of[59] combine a balanced scorecard and DEA to evaluate the teaching performance of single courses of the engineering school of a Colombian university.
The weight used for teaching evaluation is also the focus of[60]. In this study, the authors found that, in some cases, small perturbations of weights may result in many different rankings of the faculty. Alternatively, to overcome this issue, we resort to cross-efficiency DEA models, that allow each faculty to assign the best set of weights to measure their teaching performance but also use peers’ weights in the evaluation of each professor. In the Colombian context, cross-efficiency DEA models have been used to evaluate universities in their research, teaching, and alumni employment aspects[61]. In[62], a cross-efficiency DEA model was also used for the classification of research groups of the Engineering School of UdeA. For a review of applications of DEA models in the Colombian Higher Education system, the reader is referred to[63]. To the best of our knowledge, this is the first study using cross-efficiency DEA models for teaching evaluation in higher education.
The Engineering School of UdeA uses five output variables to measure teaching performance, namely:
 : total number of courses sections taught in the year;
 : total number of different courses taught in the year;
 : total number of students in these courses;
 : total number of teaching hours in the year; and
 : weighted average evaluation of the quality of the teaching given by the students. These outputs include courses both in undergraduate and graduate programs. Since no input is given, we include a dummy input for all faculty (i.e., a notational 1 across all faculty). As pointed out by[53], this approach is equivalent to a benefit-of-the-doubt (BoD) composite indicator. BoD indicators offer several benefits: invariance to measurement units and the fact that the search for a ‘right’ set of weights is overcome by generating flexible weights for each evaluated unit (faculty in this case)[64, 65]. BoD and other DEA-based models were compared in[65] for the evaluation of faculty research effectiveness under a cross-efficiency framework.
In a similar approach, the proposed BoD model follows a cross-efficiency methodology[66]. The cross-efficiency evaluation procedure has three stages. In a first stage, each faculty can assign optimal weights to his/her outputs using a DEA model. Then in a second stage, the cross-efficient DEA model evaluates the efficiency of all faculty with the optimal weights of each faculty. Finally, in a third stage, the teaching ranking of the faculty is obtained by sorting them in decreasing order of cross efficiency.
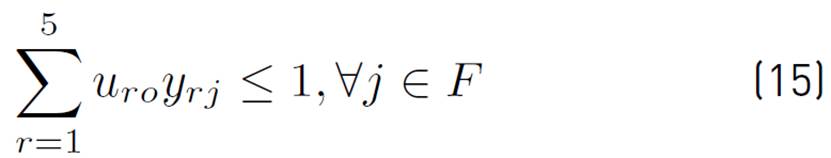
Considering this methodology, in the first stage, we evaluate the set of faculty F. Let
 be the weights of each output and
 the value of output
 obtained by faculty
 . This model uses weights denoted with
to specify that these are the optimal weights for the five outputs obtained while evaluating professor 𝑜 According to the BoD approach, the structure of the proposed DEA model follows.
. This model uses weights denoted with
to specify that these are the optimal weights for the five outputs obtained while evaluating professor 𝑜 According to the BoD approach, the structure of the proposed DEA model follows.
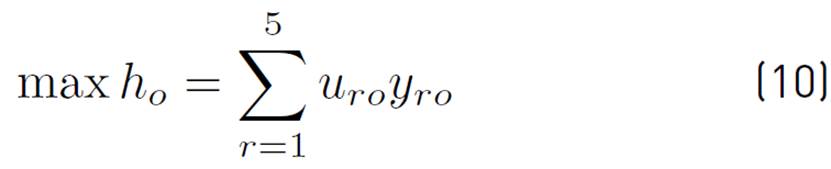
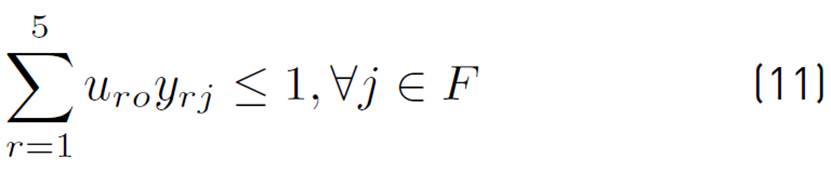

Equation (10) represents the first-stage score obtained by professor 𝑜 (h o ), which corresponds to the weighted sum of the outputs in a BoD approach. Equation (11) corresponds to the linearization of the classical DEA model in its ratio form[55] in the special case where there is a dummy input with a constant value (i.e., a notational 1). Finally, Equation (12) defines the decision variables (i.e., weights of each teaching output).
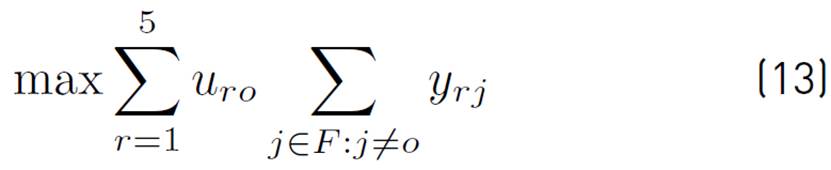
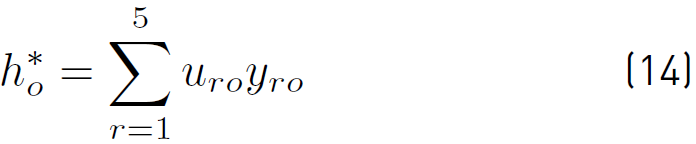
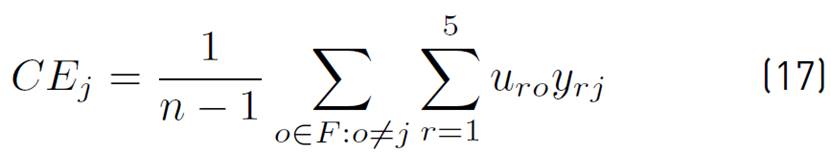
Then, in the second cross-efficiency stage, we solve model (13)-(16) to maximize (in a benevolent approach[66]), the aggregated scores of all the faculty of the School equation (13) while keeping the value of the score obtained by professor 𝑜 equal to the optimal value
 of the first stage (equation (14)].

Finally, Equation (17) defines the cross-efficiency ( 𝐶𝐸 𝑗 ) for each professor 𝑗∈𝐹 as the average of the BoD scores obtained with the weight of all their peers (the other professors). These DEA models were run using the Matlab optimization toolbox[67] and the DEA models developed in[68]. The third stage ranks the faculty using this value to assess their teaching performance.
The proposed DEA model is used to rank the faculty and to assign the incentives since 2016. To collect the data for each year’s execution we resort to the university information system. After data cleansing and calculation procedures over approximately one thousand course-sections, we get the appropriate information for the five outputs for a number of professors that range from 113 to 140. Table 5 presents the descriptive statistics for the five outputs from 2015 to 2019.
As can be seen in Table 5, output variables are measured in different scales. For instance,
 and
and
 that count the number of course sections, and different courses range from 1 to a maximum of 15. On the other hand, the number of students ranges from a few students to several hundreds. Yearly, teaching hours are lower bounded by 128 because a professor with
 below this threshold is not considered eligible for the incentive. By contrast, professors focused on teaching have nearly half their total charge (almost 800 of 1800h per year) devoted to this activity. Finally, weighted average evaluation of the teaching quality is measured on a scale from 1 to 5. Professors with a low evaluation on this output tend to have values near 3. As depicted in Table 5, 2018 exhibits values for
and
below this threshold is not considered eligible for the incentive. By contrast, professors focused on teaching have nearly half their total charge (almost 800 of 1800h per year) devoted to this activity. Finally, weighted average evaluation of the teaching quality is measured on a scale from 1 to 5. Professors with a low evaluation on this output tend to have values near 3. As depicted in Table 5, 2018 exhibits values for
and
 that differ considerably from the other periods because public higher education strikes in the country allowed the completion of just a single academic term in this year. A first benefit of using a DEA model is the possibility to combine outputs measured in different scales without any data normalization procedure that was needed if weights were fixed in advance.
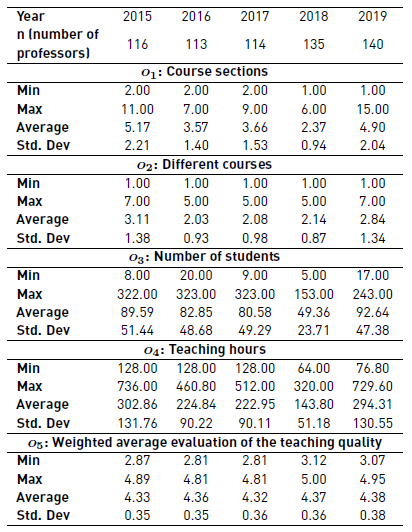
Table 6 presents the descriptive statistics of the cross efficiencies obtained for the five years of analysis. Remarkably the average and minimum values of the cross efficiency remain relatively stable over the years. Although their values are (by definition) in the interval [0,1], minimum values are always around 0.6 and the average cross-efficiency is approximately 0.88 in all years. On the other hand, maximum values are very close to 1.0, showing that there is at least a professor with outstanding performance in all years, no matter the weights their peers assign to the different outputs. Moreover, the average of the cross-efficiency is always below the median. This last result reveals that its distribution is left-skewed, as depicted in Figure 7.
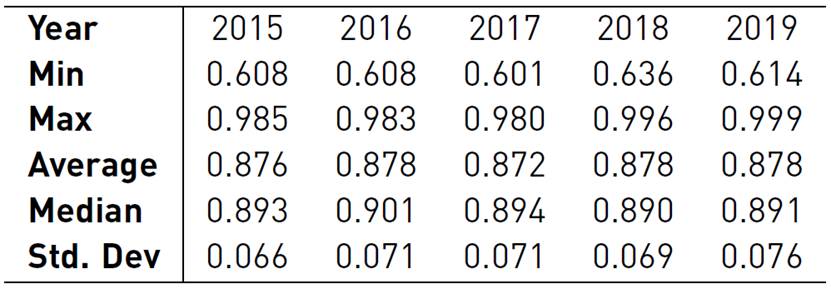
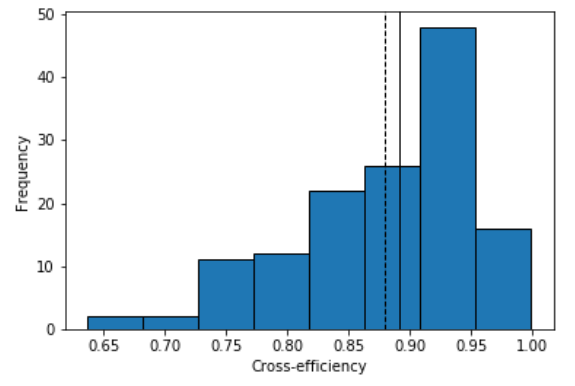
Figure 7 Histogram of the cross efficiencies obtained for the year 2019. (Dash line: CE average, solid line: CE median).
Finally, to analyze the stability of the rank from year to year, Figure 8 depicts the ranking obtained by the 70 professors that have been evaluated for all the five years of analysis. This heatmap uses the relative rank of the professor calculated by dividing the rank obtained by the professor between the total number of faculty evaluated each year (n). In this figure, green values represent higher ranks, whereas red values represent lower ranks. Professors are presented in increasing order of their average relative rank over the five years. This figure shows that professors in higher and lower ranks tend to be stable in their results. Very few exceptions occur; for instance, the professor in position 35 obtained a low rank in the last two years while his/her performance was better in the first three years of analysis. On the contrary, the professor in position 22 improved his/her results after the first year of evaluation. Similarly, the professor in position 40 greatly improved his/her results in the last year of evaluation. An in-depth analysis of these specific cases could be interesting for the administrators of the Engineering School.

Figure 8 Heatmap of relative ranks of professors at the UdeA Engineering School from 2015-2019, (Pos: position in the average relative ranking).
As an extension, other important teaching evaluation criteria could be included (e.g., supporting material creation and use, among others). Likewise, other factors affecting the teaching evaluation should be included to better understand the evaluation process (e.g.,: teaching conditions such as class size, elective/required course, course level, time of day, etc.; or faculty characteristics: gender, rank, department affiliation, years of experience, etc.)[57].
3. Conclusions
Paraphrasing[3], this paper illustrates (through three case studies) how the analytic tools of OR can be used for rationalizing decision making, particularly, forecasting and planning, resource allocation, and performance measurement in higher education (a non-traditional area of application of this discipline). Moreover, the three tools lead to decisions supported by quantitative analysis that gave a deeper understanding of the system being modeled.
In the first two case studies, OR shed light on the teaching demand and necessary capacity planning for a university department facing a generational shift of its faculty and a curriculum redesign simultaneously. While in the third case study, an objective and consistent tool for teaching evaluation and ranking has been proposed and implemented. As a matter of fact, the School and IE Department administrators made actual decisions based on the results of these models. For instance, the profiles of new open positions were highly influenced by the results of the first two case studies. Likewise, the performance measurement tool developed in the third case study has been used consistently over the last five years. We also want to highlight that decisions made using the tools described in this work were mainly strategic and tactical.
A wide variety of OR tools were used in the different case studies, namely: system dynamics, algebraic modeling, rough-cut-capacity planning, facility-location-like models, and data envelopment analysis. Other tools, without the same success, were also proven. For instance, to model the flow of students we tried a Markov chain approach[69]. However, the need for detailed information (not available at that moment) and the complexity of this modeling option (when compared against systems dynamics) hindered its application. Nonetheless, OR tools of different nature, from problem structuring methodologies to optimization and simulation techniques, are available for their use in the decision-making process of educational systems[5].
Promoting the use of OR tools in other schools of the University is an interesting alternative. However, data cleansing and processing should be automated since this is the most time-consuming part of the process (mainly in the first and third case studies). Currently, this data collection is done manually by accessing the information system of the University to gather and verify all the necessary information.
The analytic tools used in the second case study have the advantage of requiring data easy to collect and process. This fact facilitates testing different policies in the education system and evaluating them to make more robust decisions. Depending on the context, the size of the educational institution, and the availability of data, other tools can be useful, such as machine learning (ML) and artificial intelligence (AI). For instance, ML has been used mainly in education to grade students by removing human bias, to help institutions to retain students considering their needs, and predicting students’ performance by identifying weaknesses and suggesting improving actions[70]. Combining traditional operational research techniques with emerging ML/AI tools offers a promising application possibility[71].
Additionally, technology influences education in different aspects, such as the design of new pedagogic strategies, different ways to access educational services, technological platforms to provide the service, planning, and assignment of resources. Face-to-face classes are not the only approach to provide education services, education has been evolving alongside technology, and there is a constant need to have more efficient tools to process and analyze information to manage and operate education services. Currently, plenty of data are being collected through different sources (education platforms, information systems, (social) apps, etc.), giving this data a decision-making value is also an opportunity for OR/AI/ML tools. With this aim, modern data mining techniques and technologies should be used to improve not only the management of the education system, but the learning process itself[72].
Moreover, the current situation related to the coronavirus pandemic poses a real challenge to education systems, in terms of rapid adaptation of face-to-face sessions to virtual environments, accessibility to the services affected by internet connectivity, and availability of technological devices for teachers and students. Analytic tools like those presented in this paper can also have a significant value to face this new challenge.

