


 Inglês (pdf)
 Artigo em XML
 Referências do artigo
 Enviar este artigo por email
 Citado por SciELO
  Citado por Google
  Similares em
SciELO
Similares em
SciELO  Similares em Google
 Permalink
1. Introduction
Global warming is one of the main issues that the world is facing nowadays. The general dependence on fossil fuels has a great impact due to the enormous amount of greenhouse gas emissions; CO2 is mostly responsible for this problem[1, 2]. In 2015, 179 countries came to an agreement for the implementation of sustainable development strategies to reduce pollutant emissions and maintain the rise in global temperature below 2 °C in comparison with the pre-industrial levels[3]. One of these strategies is to contribute to the usage of renewable energy in the global share of power generation. Solar power is one of the most promising alternatives to face energy needs in the future, and solar concentrators can be important for the rational and efficient utilization of this source of energy[1] [4-7].
Generally, these are designed to convert solar radiation into thermal energy that can be stored in a working fluid[7, 8]. On the one hand, concentrators can be coupled to complex systems like electrolyzers and solar combustors to produce and burn hydrogen or preheat combustion air. On the other hand, they can also be coupled to photovoltaic (PV) systems in order to improve power generation and reduce costs associated with PV modules. This gives the solar concentrator a wide range of applications and a potential impact on the renewable energy sources field[9-11].
In the study of solar concentrators, the concentration ratio (CR) is one of the most important parameters, and it can be obtained using optical techniques[12, 13]. Systems like dish concentrators, solar thermal plants, and solar cookers require such optical analysis since their efficiency must be determined and depends directly on the value of CR[14]. Commonly, CR is calculated in terms of the area of the receiver and not in terms of the area of the real image produced by the concentrator on the receiver surface[15-17]. This is mainly caused by irregularities on the surface of the concentrator ending in non-homogeneous heat flux to the receiver[18]. The classical calculation approach of CR yields an error in the expected concentrated solar radiation and directly impacts the computations of variables as thermal efficiency. Having an accurate value of CR in the manufacturing and maintenance of solar concentrators would be important since its miscalculation can lead to non-optimal performance and a shorter lifetime of concentrators.
On the analysis of solar concentrators, CR is commonly measured following the geometrical characteristics of concentrators. For example, for compound parabolic concentrators (CPC), a proportional and nearly linear relationship between the heat flux on the receiver and the concentration ratio of the CPC is attained[19]. In another study, an optical analysis is performed with a CCD camera for a multi-segment plate (MSP) concentrator on a solar concentration photovoltaic (CPV) system. The CR is calculated following the geometry of the concentrator and the receiver for this optical analysis. The images taken with the CCD camera are used to measure the concentration uniformity over the receiver[20]. For optimizing the parabolic trough solar collector, three design variables are varied: the receiver diameter, the collector aperture width, and the rim angle. Being directly affected by these variables, the CR is measured based on the geometric relation between the aperture area and the receiver area (i.e., using its actual geometry)[21].
The above-mentioned studies are a representative sample of the state of art on solar concentrators, where the CR is measured based on the actual geometry of concentrators instead of being calculated with the real image generated on the receiver. In this context, the present work will contribute to the development of a new methodology to measure CR more accurately.
This work aims to use thermal imaging to calculate CR using the real image generated by the concentrator on the receiver. The computed CR is subsequently used to calculate the thermal efficiency, which reflects the behavior of the concentrator. It is suggested to use thermal imaging due to the fact that the radiation can be absorbed by the receiver and transformed into thermal energy, which the thermographic camera can capture. This practice is commonly used in research and industry to establish heat transfer across surfaces or for hot/cold surface analyses[22].
Therefore, in this work, the concentration ratio (CR) of a parabolic solar concentrator is calculated using thermographic images. Thermographic images are used not only to identify whether the radiation is coming from the concentrator but also to check if the projection on the receiver is uniform. The images are treated using two different MATLAB codes. An energy balance is also performed to estimate the performance of the thermal energy along with the heating of the working fluid, which is water.
2. Methodology
2.1 Experimental setup
In order to determine the efficiency of the solar concentrator, the experimental setup shown in Figure 1a is used. The concentrator is an elliptic paraboloid with a 0.33 m semi-major axis, 0.3 m semi-minor axis, and 0.06 m depth. It is made of a steel sheet of 1 mm thickness, and it is fully covered with mirror pieces of 1.5cm x 1.5cm and 3 mm of thickness. As shown in Figure 1b, the concentrator is directed normal to the incident solar radiation.
The working fluid used in the experiments consists of 850 g of water. Its temperature is constantly measured using a K-type thermocouple in order to obtain a time-dependent function of temperature. Solar irradiation is measured by orienting a Kipp & Zonen CM3 pyrometer directly to the sun. Finally, the global energy efficiency is calculated using Equation (1)[23].
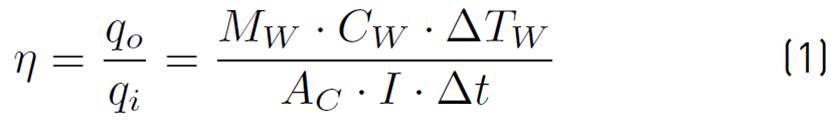
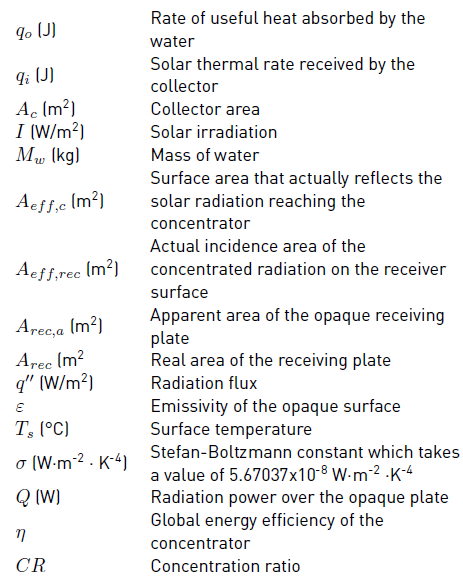
Where,
q o : Useful heat rate absorbed by water.
q i : Solar thermal rate received by the collector.
A c : Surface area of the collector.
I: Solar irradiation.
M W : Mass of water.
C W : Water-specific heat.
∆T W : Water temperature change.
∆t: Time difference.
The experiments were performed in Medellin, Colombia, during July at 1479 masl (meters above sea level) and between 11:30 and 13:10 with ambient conditions of T = 26°C and P = 85.4 kPa. The atmosphere was clear and solar irradiation was almost constant at 951 ± 37 W/m2 during this time interval. Each experiment was performed five times. The approximate time taken by each experiment was 108 minutes.
In order to measure the concentration ratio (CR), the receiver of Figure 1a is changed to an opaque plate, as seen in Figure 1b. The receiving plate has dimensions of 0.3 m x 0.3 m x 0.02m and is made of 3 mm plastic sheets fixed with silicone. A system circulating water at 22 °C is implemented to cool down the opaque plate. The water flow is regulated so that the concentrated radiation only heats up the area of incidence and not the rest of the opaque plate by conduction mechanism. The opaque plate is placed in the focus of the elliptic paraboloid and then adjusted to be normal to the incident solar radiation.
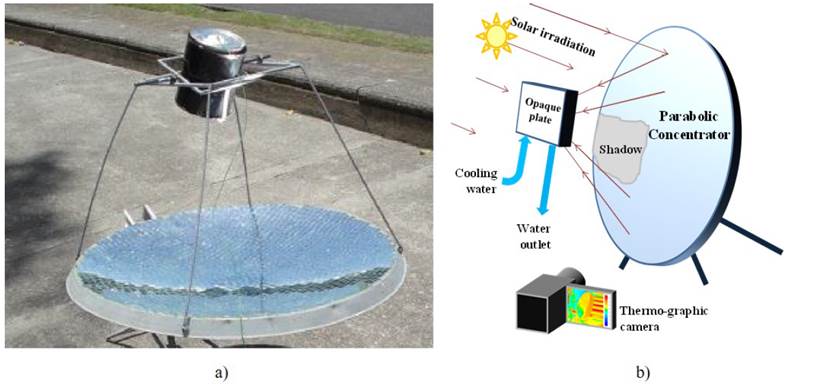
Figure 1 a) Experimental setup used to determine the efficiency of the solar concentrator b) Experimental setup to determine the concentration ratio
During thermographic analysis, we used a TESTO 876 9Hz camera. The temperatures of the concentrator are recorded to recognize which area reflects most of the solar radiation. The temperatures of the receiving surface of the opaque plate are also recorded in order to calculate the area of the image generated by the concentrator on the receiver.
2.2 Image processing
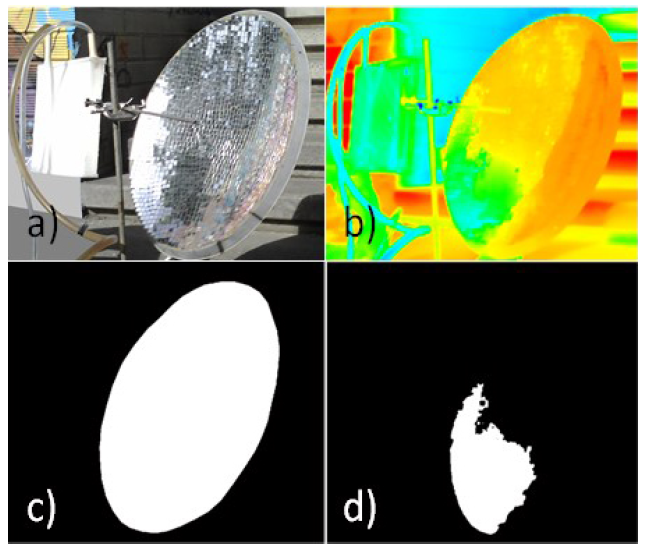
The images are treated using two MATLAB codes. In Figure 2, one of the codes is used in order to determine the surface area of the concentrator that redirects the solar radiation. Figure 2b shows the thermographic image of the solar concentrator. Successively, a binary image with a value of 1 in all the pixels within the elliptical profile is displayed in Figure 2c. This procedure is done to define the region of interest (ROI) of the concentrator.
Figure 1b and Figure 2a show that the configuration of the experimental setup allows the opaque plate to produce a shadow over the surface of the concentrator; this contributes to a lower temperature in that region, and therefore, less solar radiation is reflected. Thus, pixels within the ROI that have a lower temperature than the rest of the surface are shown in Figure 2d. Those pixels resemble the shadow area, which is subtracted from the receiving area of the concentrator to find the effective area.
The ratio of the concentrator area reflecting the solar radiation to the concentrator area is calculated using Equation (2).
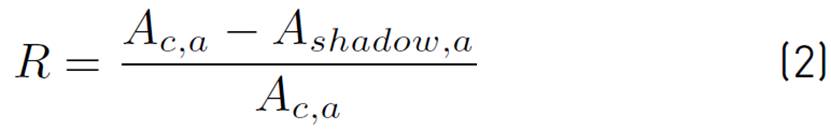
Where Ac,a is the apparent collector area in pixels and is determined using Figure 2c. Ashadow,a is the apparent shadow area in pixels and is produced by the opaque plate on the concentrator. Since there are apparent areas in Figures 3c and 3d that do not consider the non-perpendicularity of the photograph of the concentrator, R is required. The Equation (3) is employed to determine the area in m2 that reflects the solar radiation reaching the concentrator (Aeff,c).

Where Ac is the real area of the elliptical paraboloid, which is 0.311 m2. The surface area of the image generated by the concentrator on the surface of the opaque receiving plate is determined using the image processing of Figure 3.
Figure 3b shows the surface of the opaque plate; the red color indicates high temperatures. The ROI of this Figure is determined using Figure 3c. Figure 3c is a binary image employed to execute a FOR cycle in which the area of incidence of the concentrated radiation is computed. It can be seen that there are areas that are hotter than others. Then it was necessary to establish 4 isothermal lines to scrutinize the impact of radiation on the receiver (45 ° C, 55 ° C, 65 ° C and 75 ° C). With this information, the area of incidence of the concentrated radiation on the opaque plate is determined in Figure 3d.
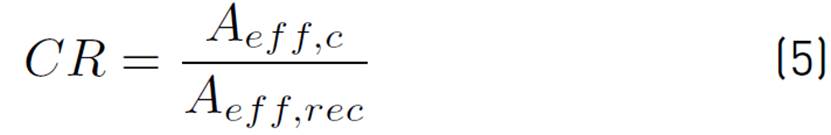
In this investigation, it was not possible to take pictures perpendicular to the opaque plate surface. Consequently, it is necessary to determine the ratio between the apparent surface area of the opaque plate and the apparent incidence area of the radiation. The real area of impact of the radiation is calculated using Equation (4) in order to determine the CR.
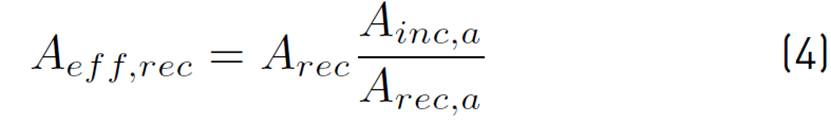
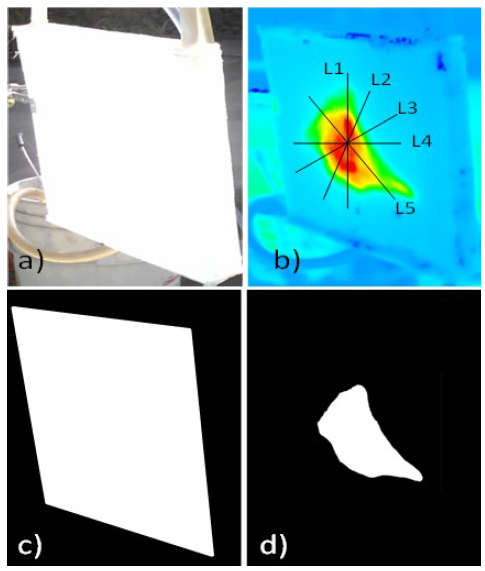
Where Aeff,rec is the actual area of incidence of the concentrated radiation on the opaque plate, Ainc,a is the apparent area of incidence of radiation in pixels found in Figure 3d after implementing the isothermal lines, Arec,a is the apparent area of the opaque receiving plate shown in Figure 3c. Finally, Arec is the real area of the receiving plate and is the one used to calculate CR. It has a value of 0.09 m2. The concentration ratio (CR) of the solar concentrator is then calculated using Equation (5).
Five temperature lines are depicted in Figure 3b to illustrate the homogeneity of the radiation flux. The radiation flux q'' is computed at each temperature by means of Equation (6) consistent to Stefan-Boltzmann's law.
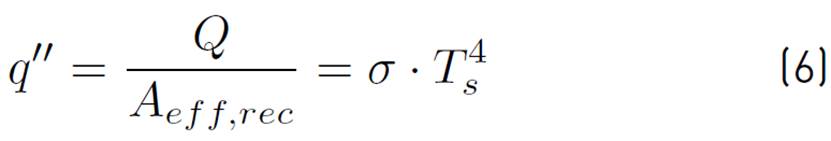
Where the emissivity of the opaque surface has a value of 0.95, σ=5.67037x10⁻⁸ W·m-2 ·K-4is the Stefan-Boltzmann constant, and Ts is the surface temperature. Q is the radiation power over the opaque plate by considering the area of incidence of the concentrated radiation calculated using Equation (4).
3. Results
3.1 Energy efficiency analysis
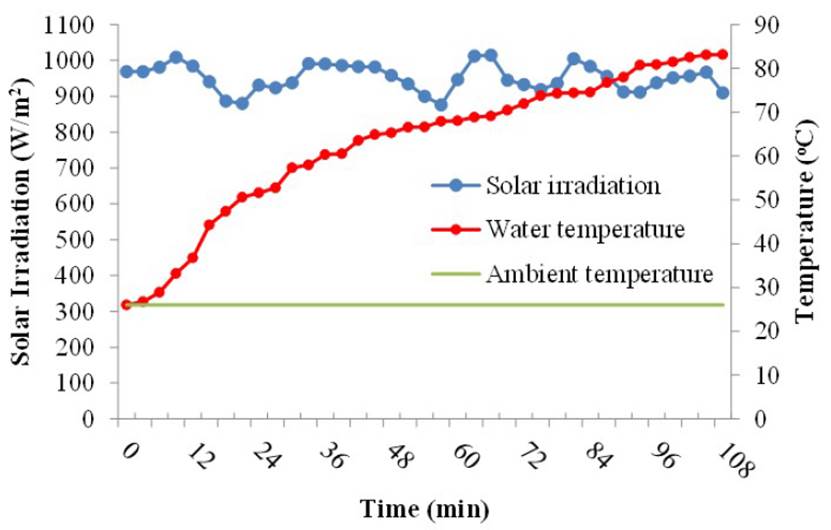
Solar irradiation over the surface of the concentrator is shown in Figure 4. According to the graph, the concentrator received mean solar irradiation of 951 ± 37 W/m2. As time progresses, the water temperature increases due to the concentrated energy on the receiver surface, while the ambient temperature remains constant at 26 °C. The water reaches a maximum temperature of 83 °C in 108 min.
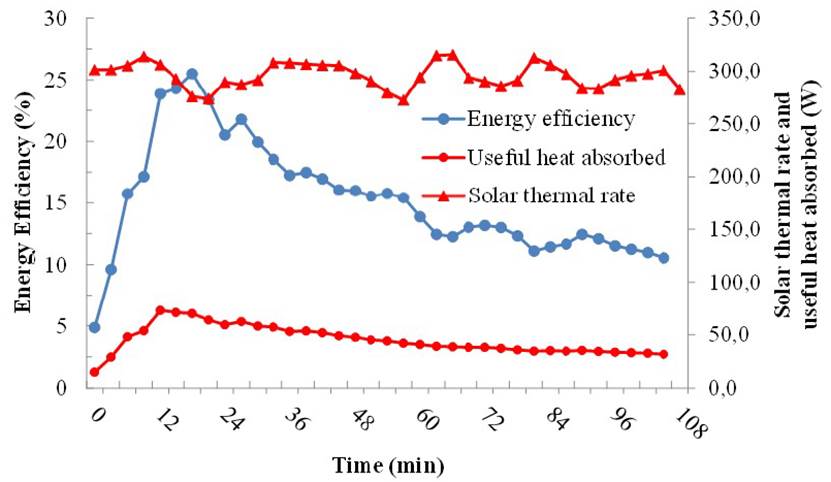
The energy efficiency behavior is presented in Figure 5. Energy efficiency increases with the temperature of the water, reaching a maximum value of 25% when the water is at 47°C after 18 minutes from the start-up of the experiment. This is caused by useful heat absorbed, which increases with the temperature difference between water and ambient. After 47°C, water starts evaporating faster, and thermal effects like conduction, convection, and radiation take place. Energy losses are larger from the receiver surface to the ambient, reducing the useful heat absorbed, and the energy efficiency starts decreasing to reach a value of 11% when water is almost evaporating at 83°C for Medellin conditions. The mean value of energy efficiency was 15.3%.
Thermal losses can be reduced using better materials for the solar concentrator, such as highly reflective materials for the collector, good design and high absorptivity, and low emissivity materials for the absorber. However, irregularities in the curvature of the collector can lead to a bad concentration of solar radiation on the absorber surface and generate big energy losses too. Improving the concentration factor is equally important, and it is mainly originated from collector manufacture problems. In an optimal operation zone, a decrease in the CR of 60% can lead to a reduction of 5% in overall efficiency[15]. CR is critical in the design of the solar concentrators. Irregularities in the concentration minimize the concentration ratio and, as previously mentioned, affect the overall concentrator efficiency.
3.2 Concentration ratio analysis
The effective reflection area of the solar concentrator is 78% of the total area of the parabolic concentrator, as can be seen on Table 1. Thus, the shadow generated by the opaque plate on the concentrator demonstrates a positive effect. Figure 6 shows the results of the thermographic image processing of the surface of the opaque receiving plate.
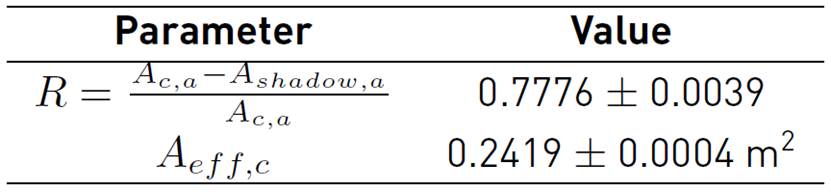
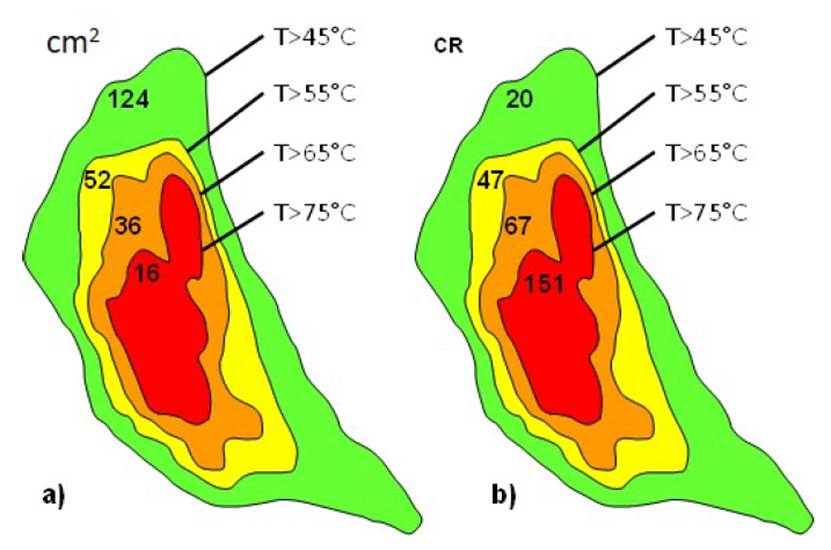
Figure 6 Area (cm2) and the concentration ratio (CR) as a function of the temperature in the opaque plate
Figure 6a shows the area of the image generated by the solar concentrator on the opaque receiving plate. Some areas are hotter than others when the system is on steady-state. On the other hand, it is clear that the morphology of the image is irregular and not symmetrical. This is caused by the irregularities on the concentrator surface, which generate a non-uniform radiation flux, and consequently, a non-uniform temperature profile. In the analysis, four regions are selected. The green region, for example, represents the area with a temperature higher than 45 °C; the yellow region resembles the area where the temperatures are greater than 55 °C, and the hottest part is the red region (T> 75 °C). The maximum incidence area is 124 cm2.
In the hotter areas, the concentrated radiation flux is higher. For the different regions specified in Figure 6, the concentration ratio (CR) is calculated. CR is greater for the warmer regions, as shown in Figure 6b. According to the four selected regions, CR is lower for the larger areas and varies from 20 to 151 as the radiation flux varies.
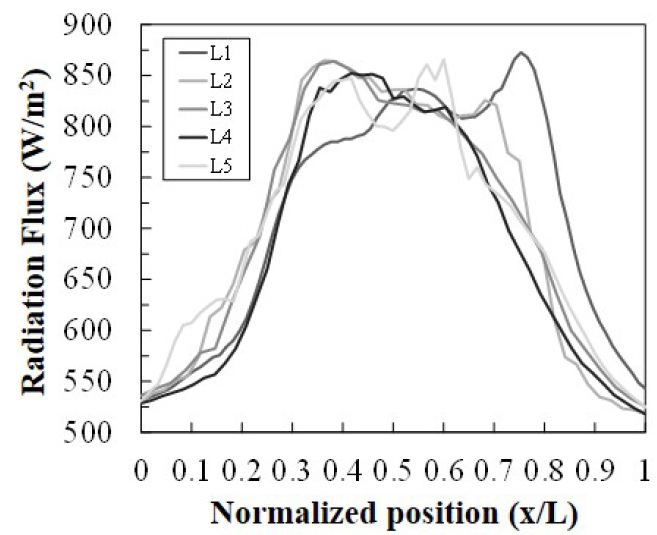
Figure 7 shows that varying the position also varies the radiation flux. As can be seen, the radiation is not symmetrical for all lines due to the irregularities of the parabolic concentrator. The radiation flux is further concentrated in the center, as shown inFigure 6b. For this reason, there will be a higher temperature in the center, which also has a higher concentration factor, as shown in Figure 8. In fact, in Figure 7, the radiation flux is shown on the five temperature lines that are specified in Figure 3b.
Figure 8 shows that by increasing CR, the emitted radiation flux from an opaque plate also increases, but there is a contrary trend regarding the power. The radiation flux increases on an interval from 700 W·m2 to 830 W·m2 for CR with values between 20 and 151, respectively. In the same interval, power decreases from 8.7 W to 1.3 W.
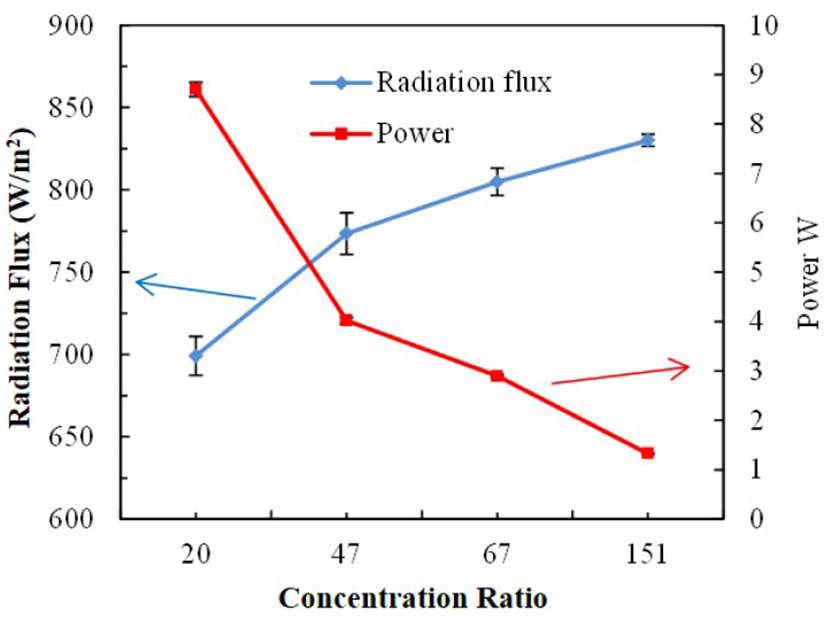
When the CR and the radiation flux reach their maximum, the power decreases to its minima; this is caused by the difference in the availability of the area. For a higher CR, the area available is lower. Thus, for a CR of 151, a power of 1.3 W is obtained, which represents 15% of the total power. On the other hand, for a CR of 47.4 W of power is obtained, representing 46% of the total power. Although the remaining area is between 45 ° C and 55 ° C, it represents 54% of the power. Finally, the total emitted power from the opaque plate was 8.7 W.
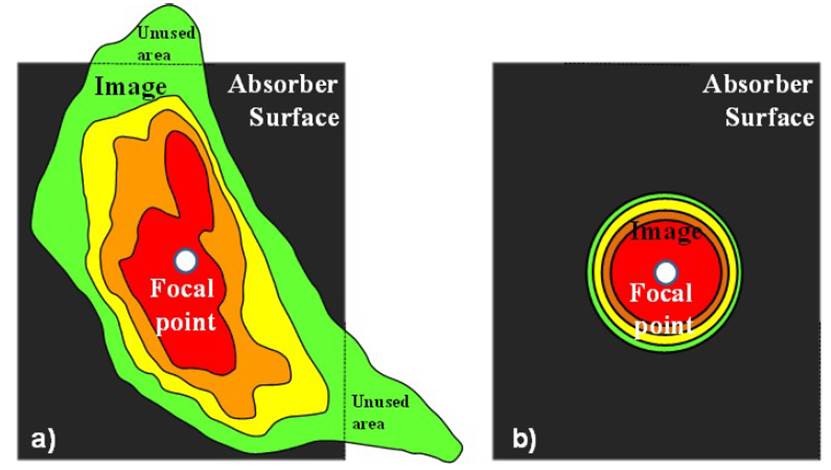
The energy efficiency could be greater if irregularities in curvature are less severe. Having a higher concentration of the radiation on the receiver surface is also attained by minimizing the irregularities, and this is evidenced in Figure 9.
4. Conclusions
In this work, the global energy efficiency and concentration ratio of a parabolic solar concentrator using thermographic image processing are determined. It was found that CR can be determined with a high level of accuracy using thermographic image processing. CR also varies from 20 to 151 depending on the radiation flux that is required for the heating of the receiving plate, and the thermal efficiency fluctuated during the time of experimentation, having a peak of 25% and a mean value of 15.3%.
The maximum concentrated radiation flux and the maximum CR are obtained just in a small central region where the temperatures are higher. However, the power is lower when the area is smaller. This behavior was caused because of the incident radiation on the plate, which is not properly concentrated. Additionally, the energy distribution is not uniform due to irregularities in the concentrator. It can be noticed that irregularities affect energy distribution and consequently energy efficiency. It could be characterized by determining the CR using thermographic methods.
The irregularities of curvature in the concentrators significantly deteriorate the uniformity of the radiation flux and its symmetry on the receiver. Those irregularities also make energy efficiency decrease due to unused areas of concentration. Appropriate methods of manufacture should be adopted to avoid concentration factor issues.
For the optimum design of solar concentrators, it is necessary to minimize the receiver surface area in order to avoid reducing the area of reflection by generating shadows over the concentrator.

