


 English (pdf)
 Article in xml format
 Article references
 Send this article by e-mail
 Cited by SciELO
  Cited by Google
  Similars in
SciELO
Similars in
SciELO  Similars in Google
 Permalink
1. Introduction
Thermography is a common technique in Operation and Maintenance (O&M) of PV solar farms used for detecting hot spots in PV solar panels caused by deterioration of internal cells or by partial shading[1]. Hot spots can compromise short-term panel performance and long-term damage if not treated properly. Infrared thermography (IR thermography) in PV solar panels is a technique that generally uses high-resolution infrared thermal cameras in order to obtain detailed information on the temperature of each cell in a PV panel. High-resolution IR cameras are expensive equipment due to their special thermal capabilities and accuracy, providing researches a high-quality image to analyze panel’s degradation. High-resolution and professional grade thermal cameras are expensive, which is an inconvenience for low-budget research institutes or students aiming to thermal analysis in PV solar panels. Nevertheless, low-cost thermal cameras do exist in the market, being an interesting alternative for thermal analysis of small-scale PV power plants and research laboratories, providing information that allows initial action to be taken in case of any anomaly observed. This paper shows the use of low-cost cameras for IR thermography PV solar panels under normal operation, most important features and disadvantages are detailed, emphasizing its cost. Analysis of the images obtained with both temperature tables, static images, and thermocouple measurements is carried out.
Analysis discussed in this document are an extension of previous work “Detecting hot spots in photovoltaic panels using low-cost thermal cameras” presented on the Smart Cities - II Iberoamerican Congress on Smart Cities (ICSC-CITIES 2019).
2. Thermal cameras
2.1 Cameras used for thermography in PV systems
Thermal cameras are devices that capture the IR radiation emitted by heat on an object[2], converting the data from the camera’s sensor into an image that represents the temperature pattern of the area of interest (AOI). IR Thermal Analysis is a non-invasive technique (no disconnection required) used to observe the temperature of an object, equipment or machinery to verify the temperatures under operation. As for PV systems is concerned, IR thermography is used to identify failures in PV cells or in electrical connections[3-9], providing relevant information that facilitates the O&M of PV sites. However, IR thermal cameras normally used in PV thermal analysis are expensive. Table 1 shows the most important characteristics and cost of a set of thermal imaging cameras commonly used for PV analysis.
Table 1 Features and prices of IR thermal cameras used in the thermographic analysis in photovoltaic panels
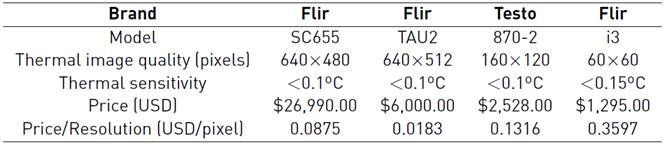
Options presented in Table 1 are considered high-resolution or professional thermal cameras. Sensor’s resolution used on these models allows detailed analysis of thermal patterns. Regarding cost and resolution relationship, most expensive options have a smaller cost per resolution ratio. Among them, the Flir TAU2 camera stands out with a lower cost per pixel.
2.2 Low-cost infrared thermal cameras
Low-cost IR thermal cameras with technical characteristics suitable for its usage in thermography do exist in the market and are a viable option to consider. Low-cost IR thermal cameras shown in Table 2 are used in this paper.
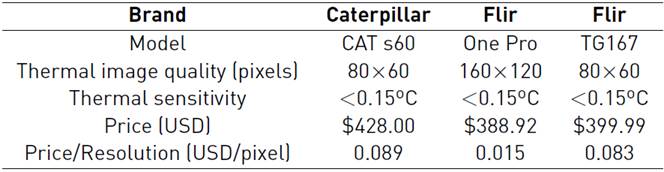
Prices in Table 2 are taken from renowned online stores in the US without shipping. These low-cost IR thermal cameras have prices below $500, which make them easily accessible compared to more expensive models. It is noteworthy that the Flir TG167 camera features similar to the Flir i3 and CAT s60. However, the Flir TG167 may be considered more like an infrared thermometer with a thermal camera since the image temperature shown on the display corresponds to the reading of the built-in microbolometer, rather than an array of thermal sensors.
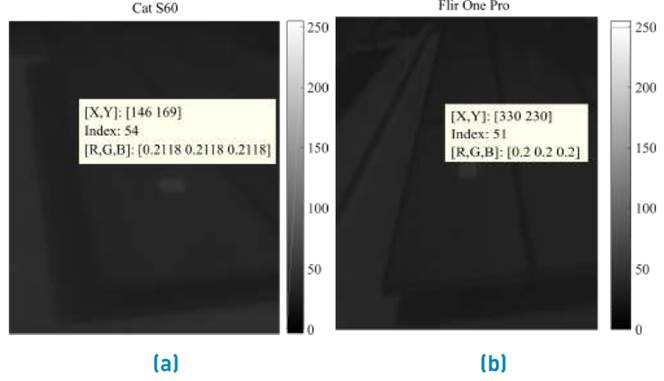
In Figure 1, images captured with low-cost IR thermal cameras under study are observed. All cameras offer similar behaviors, but the higher resolution Flir One Pro camera presents a sharper and more edge defined image than the lower resolution Cat S60 camera. On the other hand, the FLIR TG167 image has a very low image resolution, but this often can be seen as an advantage as embedded image processing is concerned (lower resolution means fewer processing power needed).
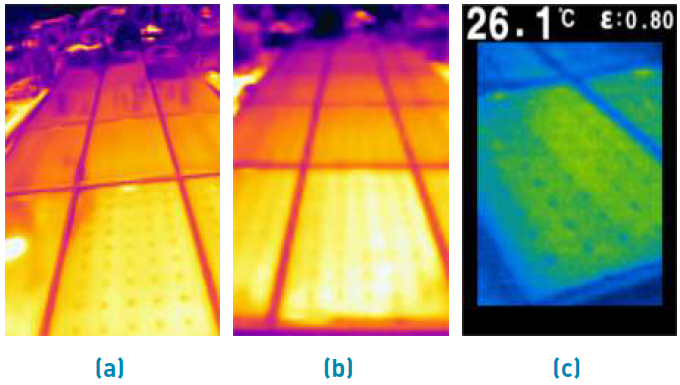
Figure 1 IR thermal image of a PV panel captured by (a) FLIR One Pro camera, (b) Caterpillar Cat S60 camera, (c) FLIR TG167
Table 3 shows a comparison of the cameras used and the limitations found according to on-site tests.
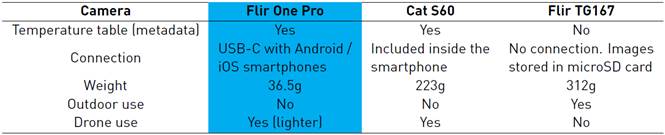
High-end or professional-grade IR thermal cameras are designed specially to perform in challenging environments and record high-resolution high-accuracy images, ensuring confidence and repeatability on the data obtained. IP rating on high-end cameras is a very important advantage for its use in harsh environments. Also, they often have a higher framerate enabling smooth video analysis. Other technical advantages include industrial communication protocols, interchangeable lenses and more. High-end cameras are mainly used by research institutes or by industries with large budgets, that can contact the manufacturer directly for support or even pay for it.
On the other hand, low-cost thermal cameras are designed to perform in less challenging environments, while recording high or medium resolution images, with accuracy and repeatability depending on the model and manufacturer. Low-cost IR thermal cameras could be used for thermal inspection on small or mid-sized solar farms but considering their IP rating limitations. A very important advantage of low-cost thermal cameras is low energy consumption, very important to embedded systems and UAVs, also they often have standard and commercial communication protocols. Low-cost alternatives are also becoming widely used by hobbyists, students and the open-source community, meaning a large number of people behind its use and development. This advantage is important to independent researchers or small research groups because when developing solutions or carrying out thermal analysis, technical support is an important issue, especially if the camera manufacturer is from another country or speaks a different language than the user. With low-cost cameras, it is possible to find support within users.
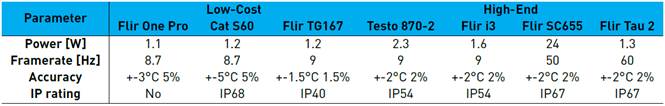
Table 4 shows a technical comparison or four high-end thermal cameras, and the three low-cost alternatives discussed in this document based on power, framerate, precision and IP rating. It is observed that low-cost cameras tend to have a lower power consumption, framerates and accuracy. This could be a problem regarding the application characteristics, for example, if a thermal analysis needs a real-time temperature monitoring system with instant readings, high-framerate cameras are the best choice.
2.3 Thermal cameras comparison methodology
In order to make the comparison between low-cost cameras, the procedure used is based on capturing images of panels with and without failures to observe if the camera is capable of finding a fault properly. In addition, a comparison is made of the images obtained from the camera, this is the image in jpg format or static image which contains the information of the pixel values in RGB format, and the thermal image or image with metadata which contains the information of the temperature values of each pixel.
3. Low-cost IR Thermal Cameras in PV panel thermography
Low-cost IR thermal cameras in Table 2 were used to perform a thermographic analysis of the PV solar farm described in[10]. As a summary, University of Cuenca’s solar farm has 35kWp installed, with 80 polycrystalline and 80 monocrystalline PV panels, and has been under production since 2016. After manual inspection of the 160 solar panels, two were found with hot spots. One of these anomalies captured with a Flir One Pro camera and processed with the Flir Tools software[11] is shown in Figure 2. The image corresponds to the first panel with a hot spot. Two points identified as T1 and T2 are observed (see Figure 2a), with temperatures of 38.2.0°C corresponding to a hot spot and 32.0°C corresponding to a healthy area of the panel. Figure 2b shows the visible light image taken with the same camera.
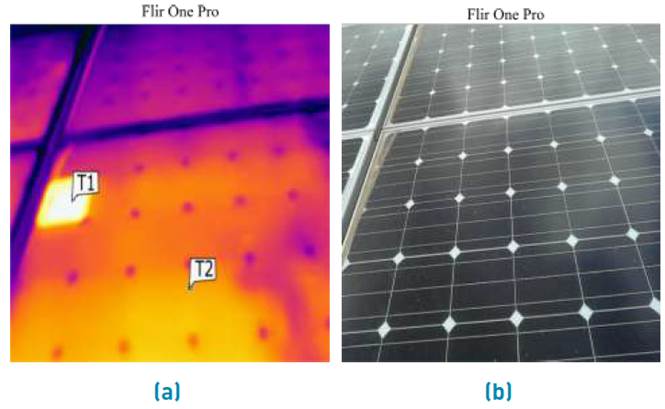
Figure 2 Thermal image of a PV panel captured by a FLIR One Pro camera. (a) IR thermal image (b) visible light image for reference
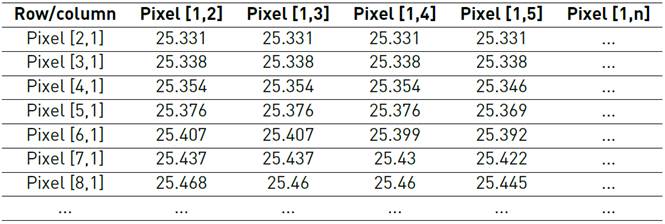
Table 5 shows metadata obtained from images taken with the Flir One Pro. This metadata corresponds to the temperature of each pixel in the image. This data allows temperature analysis of each point of the image. Similar data is obtained with the Cat S60 camera. For the Cat S60 camera a 240x320 matrix was found, while the Flir One Pro delivered a 480x640 matrix.
Table 5 Metadata of Figure 2a, obtained from a Flir One Pro camera. (rows and columns headers are only for reference)
Other alternatives do not provide metadata on the images (as the Flir TG167 camera). This makes necessary the use of image processing techniques to estimate the temperature based on color intensity or rely on the embedded microbolometer sensor to display the temperature of a point in the image.
3.1 Thermal image analysis and temperature tables
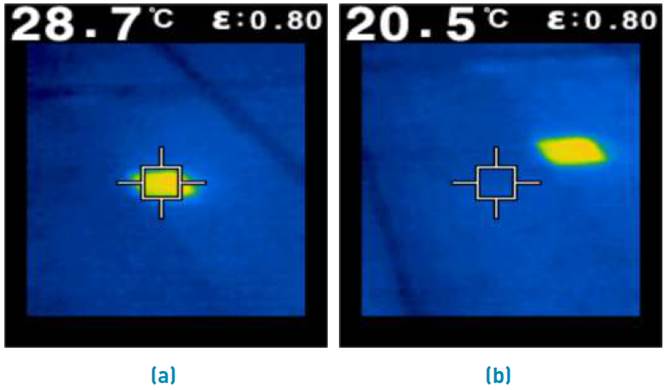
Analyzing the solar panel with anomalies, three points of interest were identified: the defective cell (T1), the unaffected area (T2) and the junction box (T3, see Figure 3]. This image corresponds to the second panel with a hot spot. Using the Flir One Pro and the Cat S60 cameras, these points were identified as T1, T2 and T3 with temperatures of 51.3°C, 35.3°C and 35.2°C respectively.
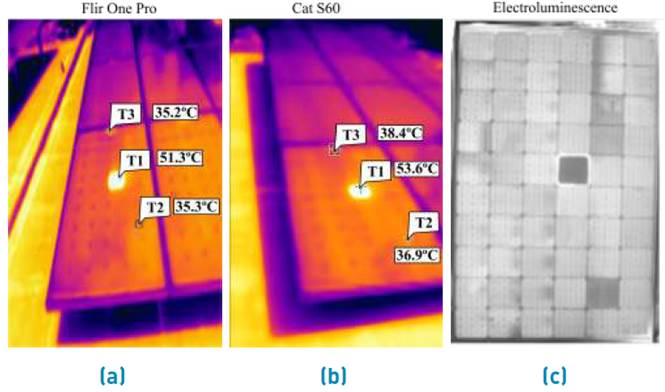
Figure 3 Thermal image of a defective PV panel captured by (a) Flir One Pro camera (b) Cat S60 camera (c) Electroluminescence image for comparison
On Figure 3a, using a Flir One Pro camera, the temperature difference found between the faulty cell and an unaffected area of the panel was ΔT=15.9°C with a maximum temperature of 52°C on the damaged cell. Studies indicate that a temperature of 51.3°C reached on the cell could be considered as a major fault[8], so short term maintenance is required. Also, according to[4] the value obtained indicates a "medium failure". Figure 3b shows same three points T1, T2, and T3, with temperatures of 53.6ºC, 36.9ºC, and 38.4ºC respectively, but image was captured using a CAT S60 camera. Here the temperature difference between T2 and T3 reaches ΔT=14.8°C , with a maximum temperature of the image of 53.2°C, so major or medium failure criteria is also considered. Figure 3c shows an electroluminescence image of the panel, where a completely dark cell with illuminated edges is clearly seen.
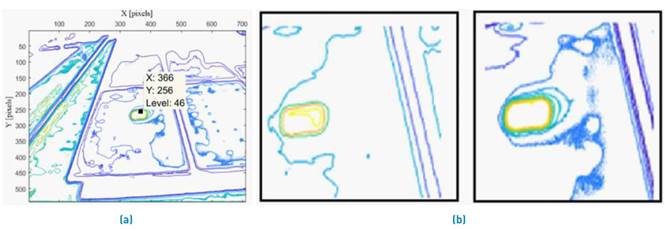
Four types of graphs were used to verify the application of low-cost thermal cameras: intensity graph, X-Y dispersion, 3D mesh, and 3D mesh contour. The intensity graph is based on the reconstruction of the values of the metadata table, the X-Y dispersion allows to observe the maximum and minimum values of the image, the 3D mesh allows to observe the three-dimensional distribution of the temperature levels, and the 3D mesh contour allows to see if the hot spot can be distinguished between the other elements of the image. Therefore, an intensity graph was reconstructed [Figure 4] using the temperature table obtained from the metadata of the images, where, each pixel is given by Equation (1):

The intensity graph in Figure 4 might be confused with a grayscale image, however a grayscale algorithm was not used, instead, it is the direct graph of the pixel intensity information obtained from the metadata of the image captured by the thermal camera. This presents an important advantage because the exact temperature of each element in the image can be obtained without the need for any type of image processing.
An X-Y graph consisting of the X coordinate of the pixel and the temperature on the Y axis, was made using data from Figure 4 in Matlab® (see Figure 5], where the dispersion of the temperature values is obtained, identifying the maximum temperature corresponding to the faulty cell con the panel, in this case 52°C, and the maximum temperature of 43°C for the highest temperature of an unaffected area. This leads to a value of ΔT = 9°C, according to[4] this could mean a “light failure”.
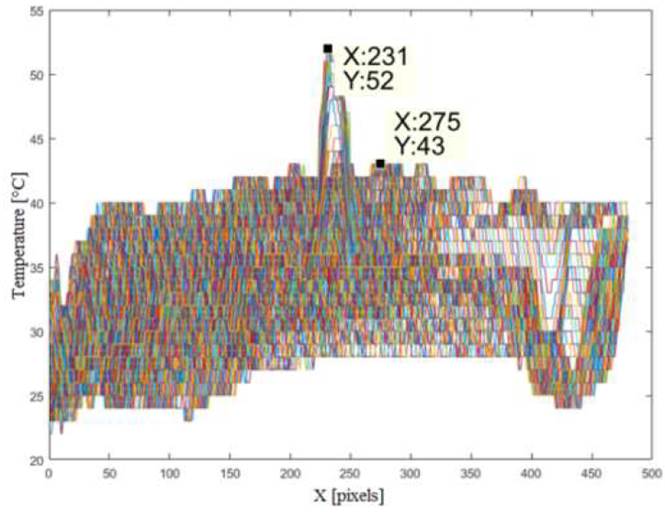
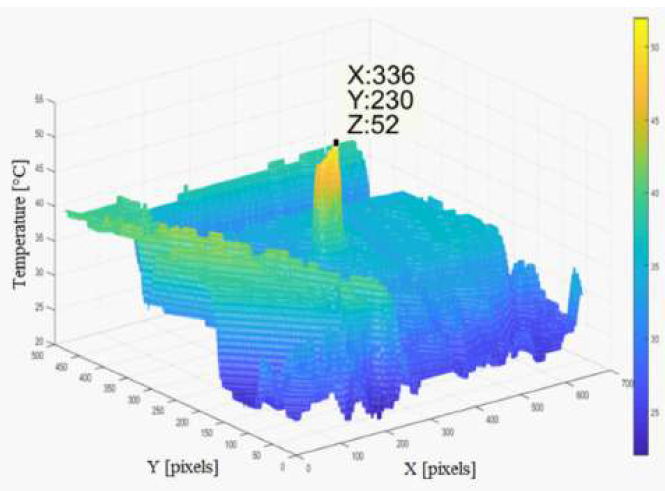
Figure 6 shows the representation of the temperature of the panel with a hot spot in a three-dimensional mesh. The arrangement of the thermal intensities can be observed, allowing to easily identify the hottest point of the image.
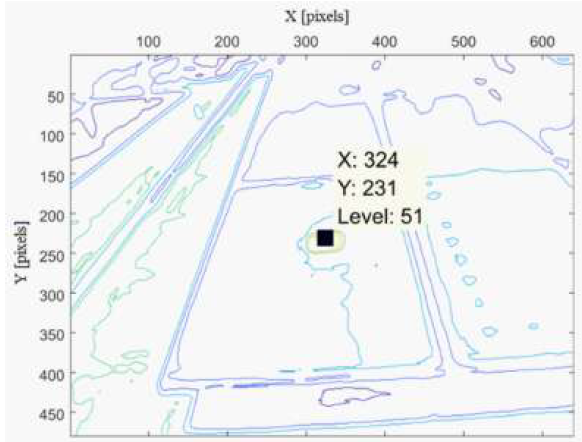
Also, on Figure 7, a contour analysis of the temperature data is observed. Contour shows the projection of Figure 6 Z-axis (temperatures) on a two-dimensional image. This analysis can be used as an edge detection approach to identify faulty cells.
3.2 Static image analysis
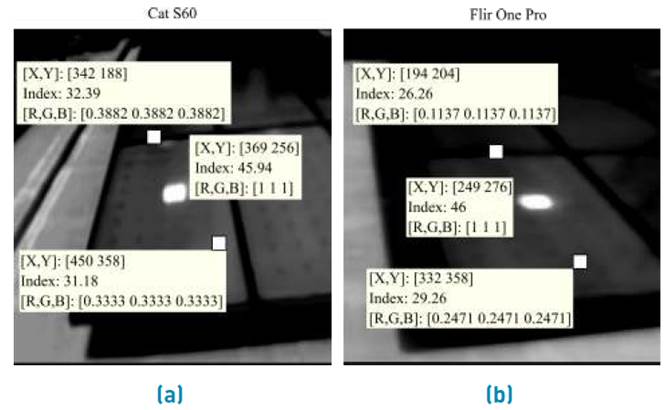
A static Image is determined as images from thermal cameras without metadata, but generally manufacturers provide a color map (sidebar that indicates the relationship between the color of the image and the temperature) as a reference of the temperature of each pixel (see Figure 8a and Figure 8b). This type of images is common in low-cost cameras and IR thermometers. As low-cost is the aim of this paper, static images analysis is studied to observe their validity in thermography of PV solar panels.
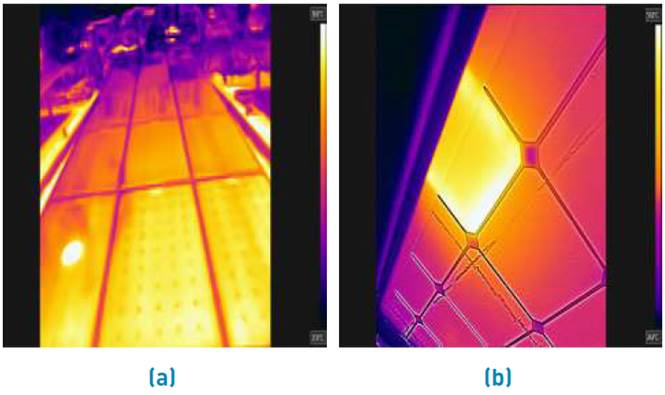
Figure 8 Static image obtained from a thermal camera with the color map on the right side. (a) PV String with one panel with a hot spot (b) defective cell thermal image obtained from the back of the panel
In order to obtain the estimated pixel temperature, the image is initially converted to grayscale, and then the intensity values are normalized to find the new pixel value using Equation (2):

The grayscale image obtained is shown in Figure 9. The new pixel intensity values correspond to a normalized temperature.
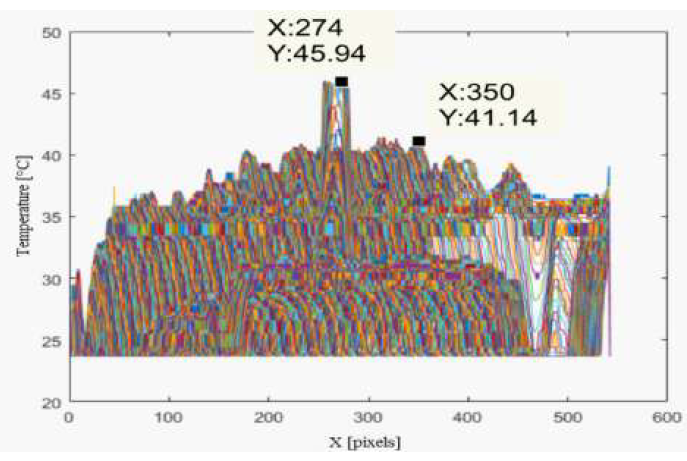
An XY scatter plot is shown in Figure 10, where the maximum pixel temperature can be found (45.94°C), however, a loss of details due to the normalization can be observed causing a decrease in accuracy. It is also observed that the amplitude of the pixel values increases for areas other than the faulty cell and that there are more pixels with low temperatures. This behavior is caused due to image normalization and limitations on the image filetype format (jpeg).
Repeating the procedure for the three-dimensional mesh in the static image Figure 11 is obtained. A similar behavior was found for the thermal image obtained with a Cat S60 camera, with the difference in the maximum temperature achieved, and in the same way as in the XY scatter plot (dispertion), a greater amount of values are observed in the base of the graph within the lower range of temperatures of the image.
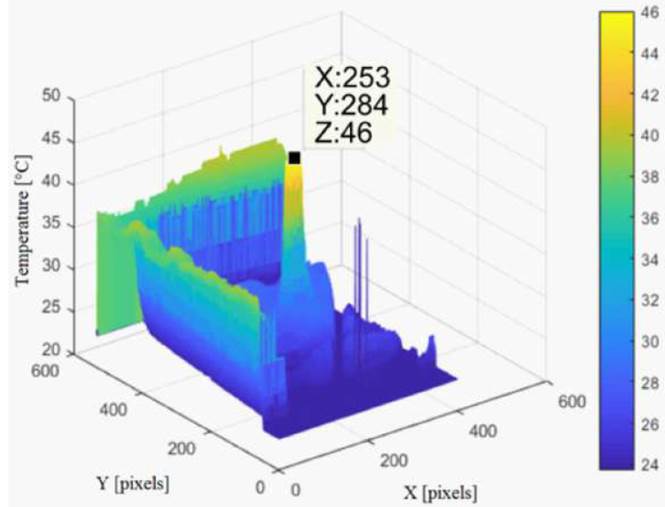
Figure 11 A three-dimensional mesh of the static image of the panel with a hot spot obtained from the Cat S60 camera
Finally, by repeating the contour of the mesh, Figure 12a is obtained. It is observed that, due to the normalization of the image, there are marked areas of the temperature gradient that can interfere or make it difficult to use geometry identification algorithms in image processing, this variation between the different techniques is shown in Figure 12b.
3.3 Static images without color map
Thermal cameras or specifically Infrared Thermometers with thermal cameras like de Flir TG167 do not provide a color map nor temperature tables as the other low-cost IR thermal cameras discussed in this paper. Nevertheless, they can provide useful information and be able to detect hot spots in PV panels. Figure 13 shows thermal images obtained with this camera. It is observed that the cell with anomalies is clearly differentiated from an unaffected area. The image shown corresponds to a different measurement, and as this type of thermal camera does not provide more data from the temperature pattern, it is not considered in the error calculation.
3.4 I-V/P-V curves analysis as first validation
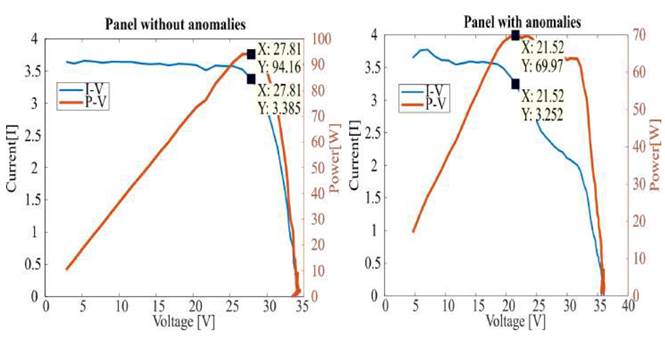
To validate that the cameras used in this study are capable of identifying a fault in a PV panel , I-V/P-V curves of the PV panel with a faulty cell where obtained using a Solmetric PVA-600 tracer[12]. Panels with hot spots or faulty cells reduce their power output and I-V/P-V curves differs from unaffected panels. PV panel found with a hot spot is an ATERSA A-250P monocrystalline panel[13]. Figure 14 shows I-V and P-V curves of the panel that has a hot spot and a panel without faults as a comparison. It is observed that the voltage of the panel with failure falls at around 16Vdc, showing a typical behavior of a damaged or “shaded” cell[14-17] which matches the thermography image. Reviewing the P-V curve of the panels, the decrease in the maximum power point (MPP) is observed, power decreases from 94.16W on the panel without anomalies (see Figure 14a), to 69.97W on the panel with anomalies (with a hotspot, see Figure 14b) obtaining a 25.69% less power in the panel with the hot spot compared to a panel without failures.
3.5 Temperature sensor matrix as second validation
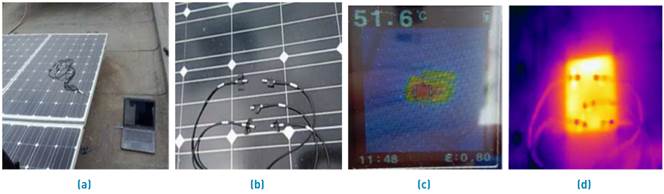
As a second validation method, in order to verify the temperature measurement error, a sensor matrix was employed (see Figure 15a) to determine a faulty cell temperature. DS18b20 temperature sensors were used to obtain the cell real temperature (see Figure 15b), whit this an average value of 57.98ºC, on the other hand, using a Flir TG167 a value of 51.6ºC was obtained (see Figure 15c), and using the CAT S60 camera and the Flir Tools software (see Figure 15d), a temperature of 63.1ºC was obtained, that is a 5ºC error. A similar error was obtained for the Flir One Pro camera and the Flir TG167.
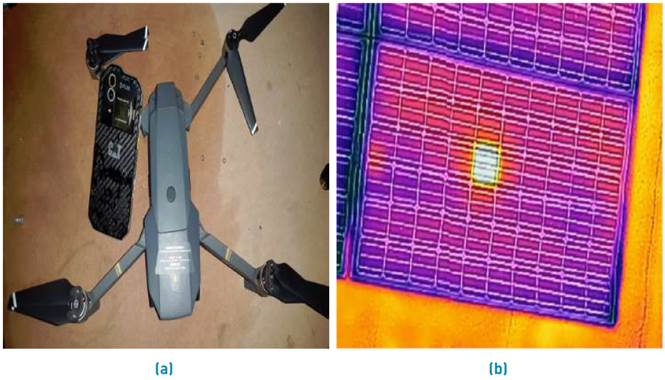
3.6 UAV and low-cost camera test
Inspections with low-cost cameras can be carried out with the help of remote-operated mobile systems. Further information about this kind of onboard thermal inspections can be found in[18, 19]. In this research, the behavior of the Cat S60 camera is tested. The camera was mounted on a DJI Mavic Pro drone [Figure 16a) and used as proof of concept in order to verify that this camera can show the hot spot on the faulty panel. Figure 16b was obtained by flying the drone at three meters above the panel. It is noted that the hot spot in the image can be clearly identified. However, this camera does not deliver a heat map or a temperature table in video capture mode, so its use should be limited to manual hot spots detection.
3.7 Results
Table 6 shows the temperature average values of the PV panel with a hotspot, obtained with the three low-cost cameras, and the relative errors between cameras. The temperatures obtained from the thermal image and the static image are shown, as well as the absolute measurement error based on the measurement with the sensor matrix, and the relative error between cameras. It is observed that in the image analysis a relative error of 10.45% is obtained for the measured temperature of the faulty cell, and a relative error of 7.75% for ΔT between the cell and an unaffected area. For the analysis of the X-Y dispersion, an error of 46.67% is observed for the faulty cell, while for the mesh analysis there is an 11.54% error and for the three-dimensional contour a 9.80% error. This indicates that contour analysis and mesh analysis are better candidates than dispersion analysis in image processing in cases where the temperature table is not available.
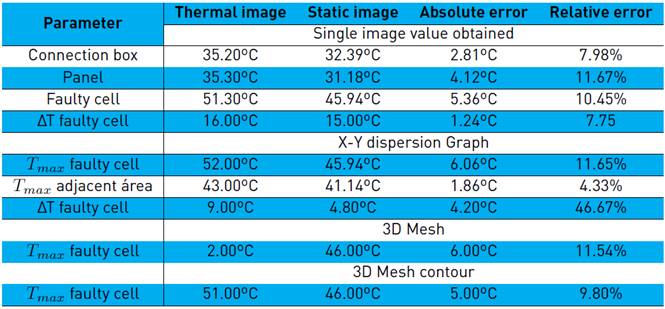
The errors observed in dispersion and contour analysis are less than 10%, so they can be used in the thermographic analysis by extrapolating the temperature[20]. Previous studies[21-23] show that the error can be improved with image processing techniques and neural networks.
4. Conclusions
This paper presents a description of the characteristics of low-cost thermal imaging cameras, emphasizing its cost/resolution relationship. It is observed that the analysis of thermography using low-cost cameras is viable considering the established errors, which can be less than 10%. Hot spot detection with low-cost IR thermal cameras is validated using I-V/P-V curves.
From the analysis of static images, it is shown that a three-dimensional contour is a valid tool with less than 10% error, which can be improved with artificial intelligence techniques and neural networks.
The thermal cameras used in this document cost less than 10% of high-end cameras, without compromising the detection of hot spots in PV panels, which allows these low-cost cameras to be used in thermographic studies considering the limitations in terms of their construction and their feasibility of outdoor use.

