


 Inglês (pdf)
 Artigo em XML
 Referências do artigo
 Enviar este artigo por email
 Citado por SciELO
  Citado por Google
  Similares em
SciELO
Similares em
SciELO  Similares em Google
 Permalink
1. Introduction
Impervious surfaces are generally defined as those that limit infiltration of surface runoff into underlying soils[1]. In cities or urban areas, there is an exponential growth in impervious surfaces, which is directly related to human activities and the construction of infrastructure. The urban development process leads to the alteration of natural landscapes and the replacement of vegetation-covered surfaces with impervious areas[2]. As a consequence, a substantial reduction in the water infiltration capacity of natural soil is generated, producing a significant increase in runoff in urban basins[3].
Currently the provider of the aqueduct and sewerage service for the city of Tunja is the private company Veolia Aguas de Tunja S.A. E.S.P., which managed, planned and built the sewer master plan. Veolia produced the hydrodynamic models of the different sectors of the current sewerage network, using the modified rational method to obtain runoff flows, taking into account the curves, intensity duration and frequency (IDF), which were probabilistically determined for the city of Tunja. However, these hydrodynamic models (hydraulic and hydrological) have not been calibrated and validated with real historical precipitation events, so the quantity of effective rain water that enters the system is unknown. Furthermore, the system lacks adequate instrumentation to obtain records of flows generated at the exit of the different urban sectors.
In Tunja, occupations of natural rainwater or runoff channels have occurred, altering the hydrology of natural basins, and directly affecting their drainage capacity. Registered overflows in the drainage system and floods have affected citizens both economically and environmentally[4]. The existence of a hydraulic model of the drainage system, as well as the calibration and validation of the urban basin under study, represent a great help for the design of the regulatory structures of the combined sewerage system[5]. A fundamental part of current policy to develop the vision of the future is an improvement in the quality of life on a social level, as well as development on a more personal scale. Thus, the correct operation of the urban drainage infrastructure must be guaranteed, necessitating the development of studies which are aimed at obtaining results that allow medium-term decisions to be made and the existing infrastructure to be optimized. Due to the potential mitigation in the risk of flooding, overflows, and silting of the drainage network, this study will mainly provide social benefits in the area in which the study is implemented.
2. Materials and methods
2.1 STUDY AREA DESCRIPTION
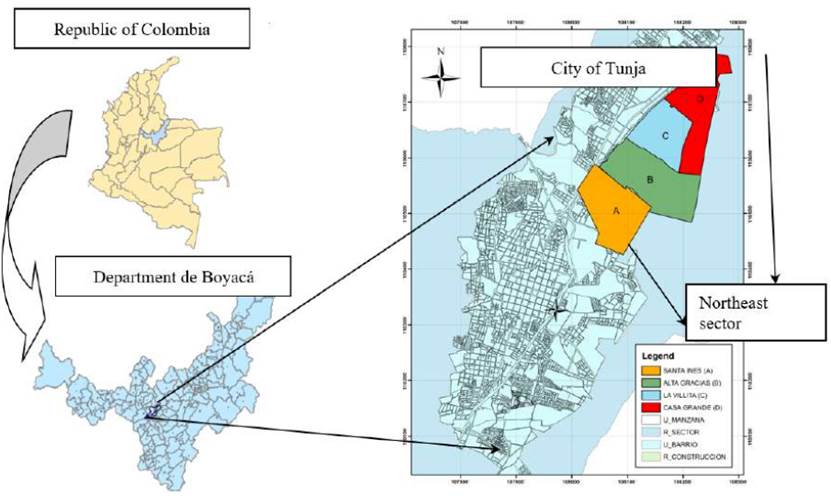
Tunja is the capital of the department of Boyacá, located in central-eastern Colombia, in the Alto Chicamocha region. It is located at coordinates 5 ° 32′7 ″ N 73 ° 22′04 ″ O / 5.53528, -73.36778. As the capital of the department, Tunja houses the main administrative institutions. Its main water sources are considered to be the river Jordan, that crosses the city from south to north, and the river Vega, that runs from west to east. Based on the sectorization contemplated in the Tunja Sewerage Master Plan, the Northeast zone is divided into four drainage districts: Santa Inés (A), Altagracia (B), Villita (C) and Casa Verde (D) (See Figure 1], which are not connected to each other and perform the combined water discharges to different points of the interceptor. Taking into account factors and characteristics such as; flood vulnerability, higher percentage of impervious area and urbanization density, the Barrio Santa Inés (A) district was selected as the specific study area.
Author
Figure 1 General location, city of Tunja, northeast sector. Territorial zoning plan (POT Tunja 2014.)
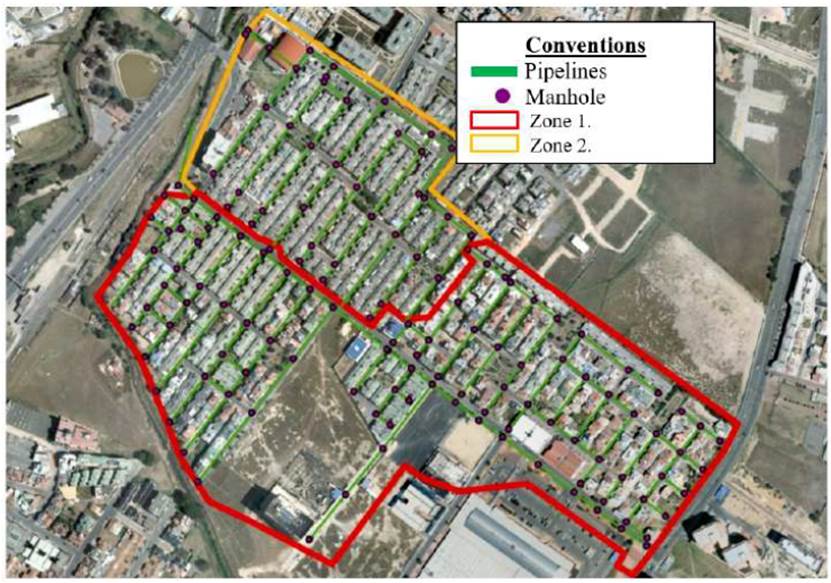
In the first phase of the study, inspection activities, network cadaster, system connectivity verification, and identification of initial wells were carried out. Once these had been completed the Santa Inés district was delimited, resulting in the establishment of two different zones (Zones 1 and 2), which have a total area of 21.89 Ha. (See Figure 2]. The pipes of the Santa Ines district drainage system are made of materials such as; Concrete and PVC Sewer type, with a percentage of 96% and 4% respectively. The totality of sections or pipes between inspection wells is 156, built in nominal diameters of 10", 12", 14", 16", 18", 24", 27", and 30". 32.05% of the system corresponds to 14" pipe and the total length of the networks is 6539.43 linear meters with an average slope of 0.49%.
The 140 inspection wells are entirely cylindrical, built in masonry, and have an average depth of 1.1 meters. The combined sewerage system has 206 lateral drains that allow rainwater to enter the drainage system. These structures are generally located in initial, intermediate and final sections of urban roads. The standard measures of the grid are: length 0.90 m, width 0.50 m and sink depth 1.20 m. The Santa Inés district has two discharge points. The main discharge of the Santa Inés district (Zone 1), is a relief chamber that allows the discharge of sanitary waters to the interceptor and excess rainwater flows in 30” pipe until the free outfall in the Jordan river, also called Rio Cool.
2.2 INSTRUMENTATION
The study of urban hydrology, consisting mainly of rain-runoff methods applied to the surface of a city, has historically been conducted without the necessary collection of real data and subsequent verification and analysis of the behaviour of the drainage networks in general. This lack of measurement has resulted in sewerage diagnoses and new collector projections being carried out with field measurements that were collected in other countries, with different conditions, resulting in the use of generalized parameters and coefficients[6].
The precipitation measurement was obtained through a model RainLog 2.0 rain gauge with datalogger - RainLogge Brand: Rainwise, that was installed inside the basin. Every time the bowl in the device overturns, the device transmits a signal to a datalogger that stores the information until the data is downloaded[7]. The flow rate in the outlet pipe section was obtained using the Flo Dar - FL900 Series Flow Logger brand sensor from Hach. Flow measurement with the Flo-Dar sensor follows the velocity area method, measuring an average velocity using a radar signal and the level or draft. From this measurement the cross section of the wet area is then calculated. The circulating flow will be the product of the wet area and the measured speed. The depth of the water is measured using a pulse echo-ultrasonic sensor. The diameter of the pipe is used to convert the distance to the depth of the water. This can be expressed in the following equation (Equation (1)]:
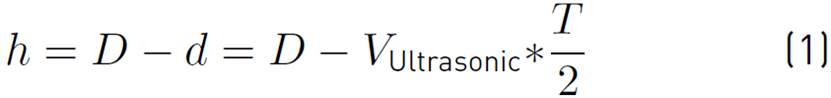
Where: h is draft, D height from the ultrasound emitter to the bottom or flat plate of the collector, d distance between emitter and free surface, V ultrasound speed.
2.3 RAINFALL - RUNOFF MODEL
EPA’s Stormwater Management Model (SWMM) is a dynamic model for simulating rainfall and water quality primarily in urban areas. SWMM treats each basin as a non-linear deposit, which is obtained by combining the continuity equation and the Manning equation for each sub-basin[8]. In the model, a sub-basin is defined as a soil area that contains its own fraction of impervious and permeable surfaces, the runoff of which drains to an outlet point, which could be a sink or other sub-basin[9].
2.4 PARAMETRISATION SWMM
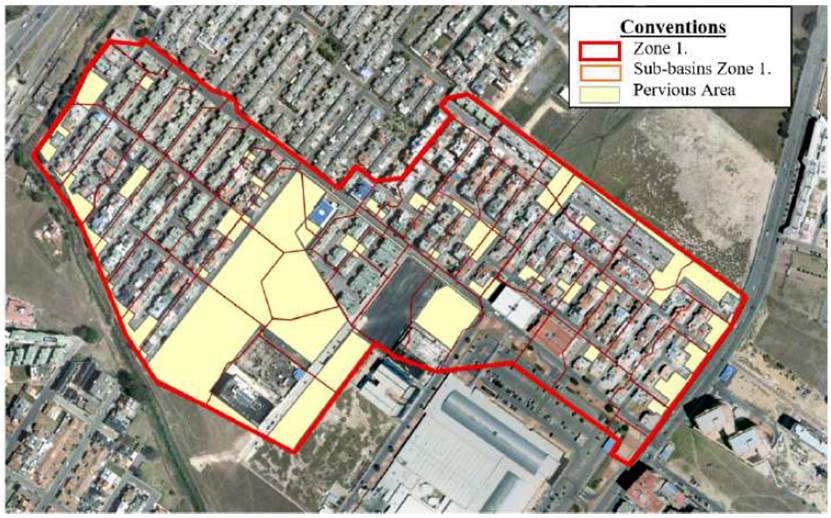
The input parameters of models based on physical processes such as SWMM, often correspond to the physical properties of the area. Most SWMM control parameters can be extracted from Geographical Information Systems (GIS) layers, for example, sub-basin area and surface slope. Manning's n, or surface roughness coefficient, determines the rate of land runoff from a sub-basin. A higher value of n produces a lower runoff rate and prolongs the duration of the flow over time[10]. The disaggregation of the urban basin zone 1 is shown below [Figure 3]
Author
Figure 3 Urban basin bounded, Santa Ines drainage network. Zone 1. Sub-basins and permeable area
Through the Carter (1961) method, the total concentration time of the urban basin was estimated to be 21.60 minutes. The weighted average slope of sub-basins and the main flow length were taken into account. This study seeks to determine physical parameters for each sub-basin analyzed in the Santa Inés district zone 1, which are presented below (show Table 1].
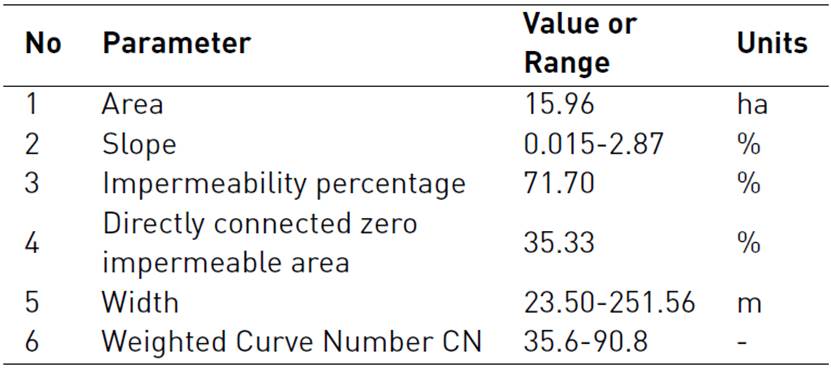
Zone 1 in the Santa Inés district is characterized by having a high urbanization index with respect to other sectors of the city of Tunja. Its topography is flat, with an average slope of 0.47% and an area of 15.96 Ha. that is disaggregated into 56 sub-basins. The percentage of impermeable area of zone 1 represents 71.70%. The directly connected zero impermeable area relates to the road surfaces in the study area, where the drainage is directly connected to the sewer system and consists of 35.33% of the study area.
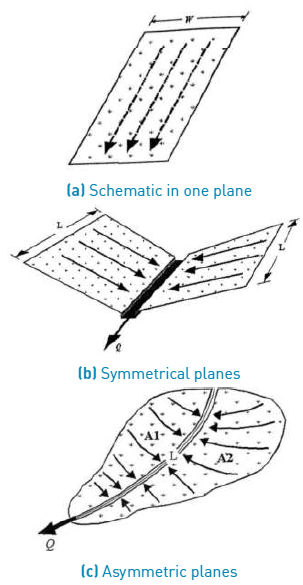
If the sub-basin is considered as an inclined rectangular plane, where the surface flow transits downhill, then the width of the sub-basin is the physical width of the runoff in the plane (See Figure 4] It can be calculated as follows in Equation (2):
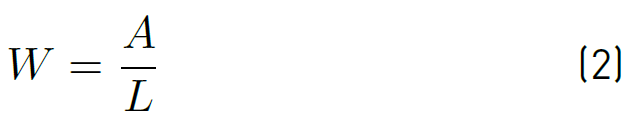
Where: A is the area of the sub-basin and L, the average length of the flow[11].
If the sub-basin is envisioned as two symmetric areas that are contributing to a main conduit [Figure 4.b), the total width is twice the length of the drainage conduit (Equation (3)][11].

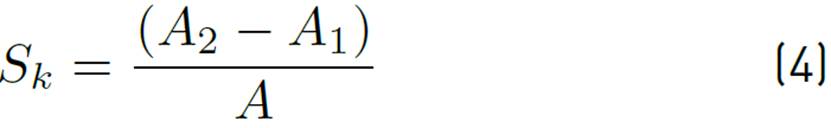
Where: L is the average length of the flow or length of the drainage duct. However, urban sub-basins generally do not have properties of symmetry and uniformity [Figure 4. c), for this condition we resort to determining a bias factor[12], which is calculated using the following equation (Equation (4)]:
S
k
is the bias factor,
 , A
1
the minor area on one side of the drain pipe, A
2
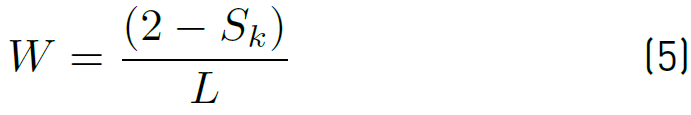
the major area of the other side of the duct, and A the total area of the sub-basin. W is determined using the following equation (Equation (5)].
, A
1
the minor area on one side of the drain pipe, A
2
the major area of the other side of the duct, and A the total area of the sub-basin. W is determined using the following equation (Equation (5)].
The permeable areas of the study basin are mainly composed of meadows covered with grass, surfaces that are not connected to the sewer system, presenting a low runoff potential with ease of infiltration, classifying themselves in hydrological group A. The multi-year monthly total average evaporation records were taken from the UPTC weather station, this being the closest to the study area. Evaporation was calculated at 3.18 mm / d and was included within the hydrodynamic model of the drainage network.
2.5 STATISTICAL EVALUATION CRITERIA
The application of a hydrodynamic model for a drainage system generally determines the maximum flow, peak time, volume and shape of the hydrograph. To accept the results of the calibration and validation process, the following evaluation criteria were used; relative error (RE) in the maximum flow, peak time and volume of the hydrograph, the root mean square error (RMSE) for the simulated and observed flows. Furthermore, the coefficient of variation (S) represents a standardized form of RMSE. Algebraically the criteria were:
Relative error RE, average square error RMSE, Variation Coefficient (S)
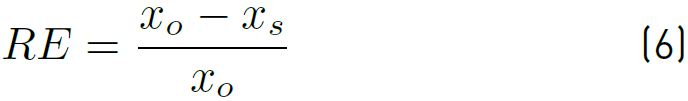
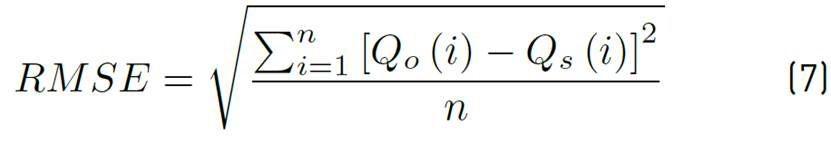
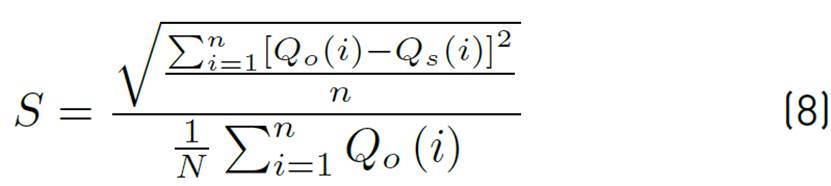
Where Equation (6), x o is the observed value of a typical hydrograph and x s is the simulated value of it Where Equations (7)-(8).: Q s (i) y Q o (i) are the flow simulated and observed in the respectively discharge, and, n is the number of observations in the time series.
Once the calibration process had been carried out, the relative errors of the peak flow, peak time, and total discharge volume were adopted as a model validation criterion, that were simultaneously less than 20%[14]. The coeffecicent of variation in the range of 0.1-0.2 indicates a well-calibrated model[15].
3. Results
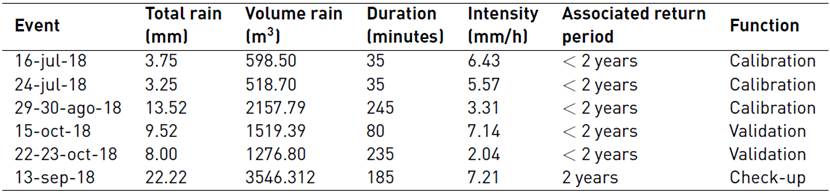
Continuous rainfall records were analyzed, identifying 6 precipitation events that were classified by date and size, taking into account the observed data on water flows at the exit of the urban basin. The first three events registered for the calibration process were adopted as a criteria, and they present different magnitudes and durations. The remaining 2 events were used for validation, with the September 13 event, that registered the highest magnitude, being used for hydraulic checks (show Table 2].
The parameters that are adjusted in the calibration are generally those that cannot be evaluated directly from field data. This study is based on the actual and real sewerage hydrographs measured in the main discharge of the urban basin. Parameters associated with the initial losses were calibrated hydrological and roughness coefficients, such as; Depression storage (Dstore) for permeable and impervious covers, Manning n for permeable and impervious surfaces, and Manning n for the pipes of the drainage system (Roughness) [Table 3].
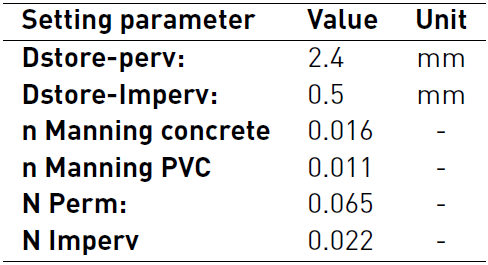
The value obtained for the storage of the impermeable depression (Dstore) was 0.5 mm, this value presented a low magnitude, possibly because the soils conserved an antecedent humidity, due to the rainy season registered between the months of July to November 2018, Substantially reducing the infiltration capacity of the surface and generating a rapid hydrological response.
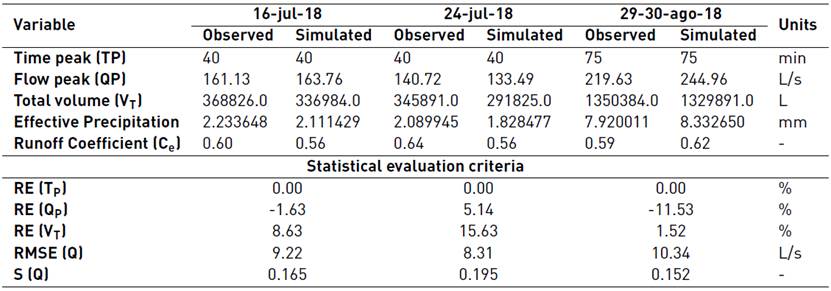
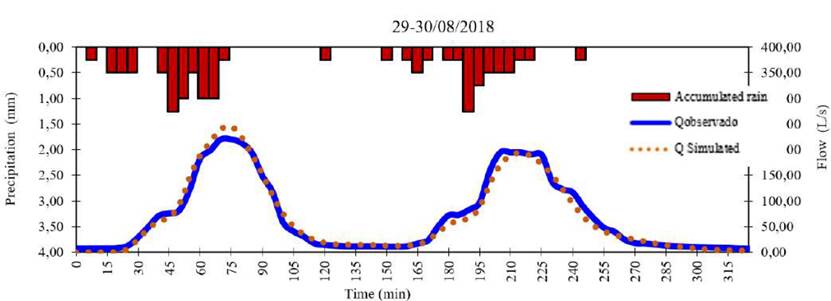
The roughness coefficients were adjusted taking into account ranges of typical values established in the literature for different impervious and permeable surfaces such as; polished concrete with bottom gravel, paver, rough finished concrete pavement, rough textured asphalt pavement, low-density scrub, shrubs and grass. The following table (show Table 4] presents the calibration results, obtaining admissible values within the goodness criteria adopted. on the other hand, the RMSE results showed a good balance of flow rates between the simulated and observed hydrographs for the different calibration events [Figure 5]. In addition, the runoff coefficient was calculated taking into account the hydrological balance of the basin, obtaining good comparative results for the calibration and validation process.
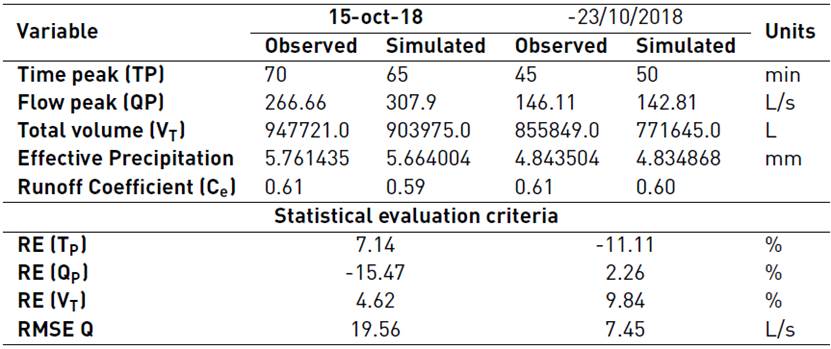
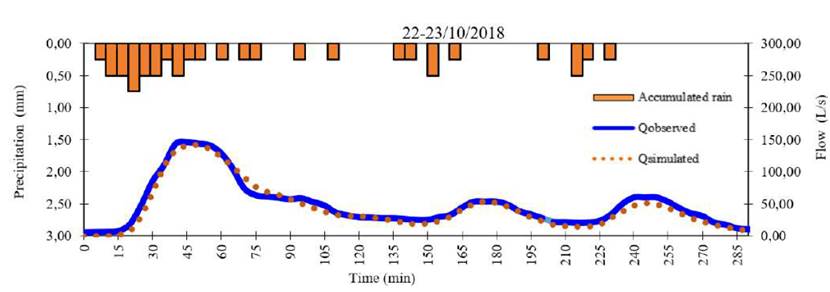
Validation refers to verifying the precision of a model under different events than those used for calibration [Table 5]. The performance of the model in the validation process is usually quantified using goodness-of-fit measures or statistical evaluation criteria used in the calibration process. Relative errors (RE) were obtained for peak flow, peak time and hydrograph volume below 20%. The RMSE results showed a good balance of flow rates between the simulated and observed hydrographs for the validation events, not exceeding a flow rate of 20 L / s [Figure 6].
The data from the rain gauge of the main weather station in the UPTC and the rain gauge in Santa Inés was subjected to an exploratory analysis, which statistically established a correlation between the two sets of precipitation data for the month of July 2018. These results validate the adoption of the available intensity-duration and frequency curves of the UPTC station that are provided by the Institute of Hydrology, Meteorology and Environmental Studies. As a result, this data was used in the construction of design rain through the alternative block methodology [Figure 7]
Author
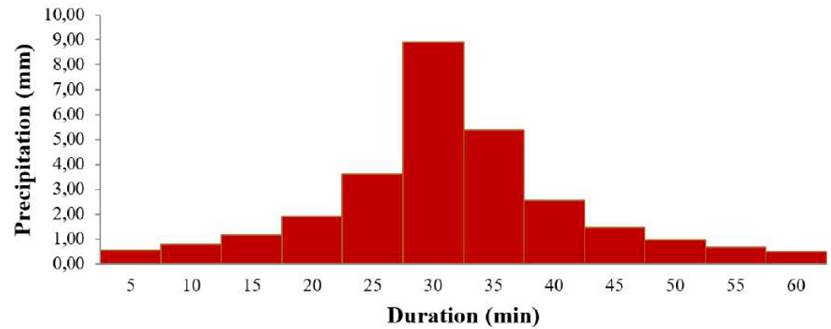
Figure 7 Alternating block method hyetograph 10-year return period. Main climatological station UPTC.
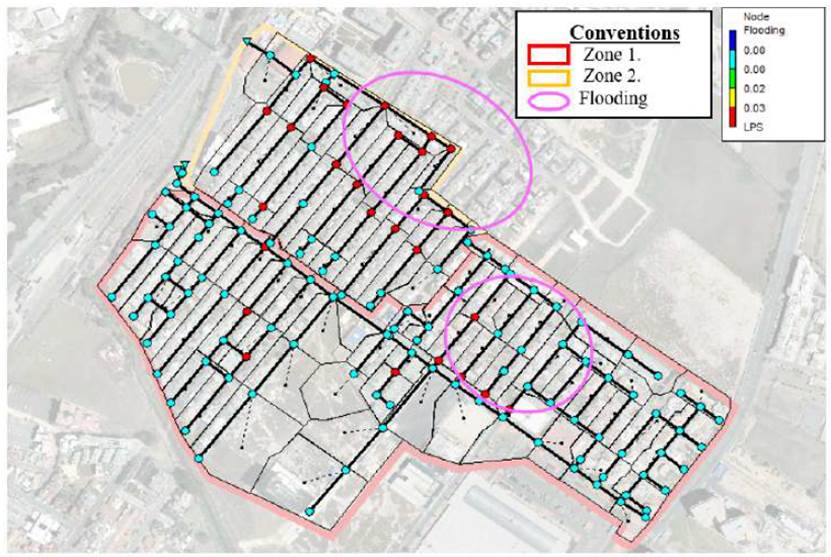
After carrying out the calibration and validation for the hydrodynamic model, district of Santa Ines Zone 1 and carrying out the process of transposition of the basins for the simulation of Zone 2, the hydraulic evaluation of the sewage system is coming out for a storm of design equivalent to a 10-year return period, in accordance with the provisions of present Colombian technical regulations applicable to the date [Figure 8].
The maximum permissible values for the average speed in the collectors depend on the material and its sensitivity to abrasion. The simulation in the peak period of the hydrograph obtained admissible values of less than 5.0 m / s, registering a maximum speed of 4.58 m / s for the collector with ID PATLAL4813.
Adoption of a hydrodynamic model, that was calibrated and validated with a rain scenario equivalent to a return period of 10 years, allowed for the vulnerability of the drainage system in Zones 1 and 2 of the Santa Inés district to be established. Hydraulic incapacity for drainage in pipes was presented, with 94.87% of the totality of the system’s collectors operating with a full tube or exceeding 93% of hydraulic capacity at the maximum peak of the hydrograph. Additionally, the model demonstrated overflow in 27 inspection wells during the 35th and 40th minute of the simulation.
96% of the pipes in the drainage system are made of concrete, a material that has a greater roughness and less hydraulic transport capacity than plastic pipes. The main drainage lines reach their capacity during the critical simulation time (35 minutes), allowing the accumulation of upstream flow, and generating the overflow of inspection wells in the internal streets of the Santa Ines neighborhood.
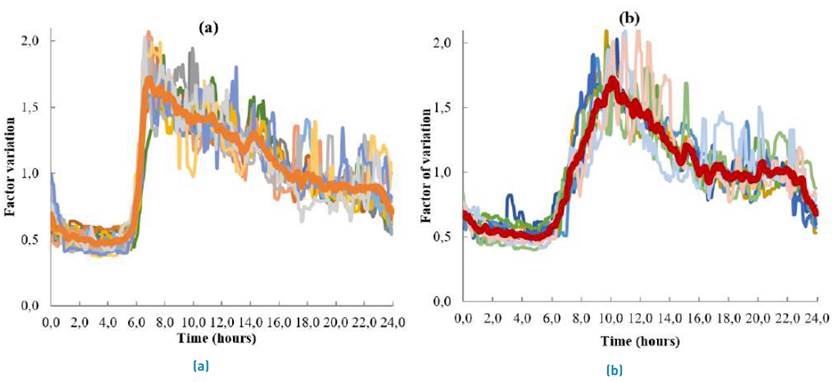
As it is a combined sewage system, for the dry period registered in the week of August 1 to August 21, 2018, periodicity in the registered hydrographs could be observed, demonstrating increases in wastewater flows during the hours of maximum water consumption. Starting from the mean base flow rates of wastewater, the mean variation curve for weekdays and weekends of the Santa Ines drainage district was obtained [Figure 9].
4. Conclusions
Rainfall and water flows were monitored for 4 months. During this period, inspection and monitoring was carried out in order to establish the physical and functional conditions of the installed equipment. The representativeness of the rainfall and flow events was established by comparing the data registered in the installed equipment, verifying the magnitude and the time of occurrence between hydrographs and hydrograms. In periods of dryness, it was possible to observe the periodicity in the registered hydrographs, obtaining increases in wastewater flows for the hours of maximum water consumption.
In the construction of the hydrodynamic model Santa Inés zone 1. The basin was disaggregated on a detailed scale, obtaining 56 drainage sub-basins, for which the width of the basin was calculated according to the three physical and drainage conditions. The sub-basins were drawn, taking into account the existing exit points or sinks connected to the sewer system.
This study was based on the actual sewage hydrographs measured in the main discharge of the urban basin. For calibration purposes, initial hydrological losses and roughness coefficients were used as parameters and included Depression storage (Dstore) for permeable and waterproof covers, Manning number for permeable and waterproof surfaces, and Manning number for drainage system pipes (Roughness).
The relative errors of the peak flow, peak time and total discharge volume were simultaneously less than 20% as the model validation criterion. The Variation coefficient is in the range of 0.1-0.2. Obtaining admissible values within the adopted goodness criteria, on the other hand, the RMSE results presented a good balance of flow rates between the simulated and observed hydrographs for the different calibration events. Thus, it can be concluded that the disaggregation of the hydrodynamic model at a detailed scale, reduced the degree of uncertainty in the evolution of the flow.
Two areas susceptible to flooding were identified. In these areas it was evidenced that the inspection wells overflowed resulting in water flowing outside of the system. The most vulnerable manhole is identified as IDF PATP3912 and registers a flooding rate of 259.48 l/s. The total flood volume is
1.57x10 ^ 6 liters. 82.70% of the collectors in the system were also identified as operating at hydraulic capacity, with a full tube or exceeding 93% of hydraulic capacity, in the 35th minute of the simulation and 94.87% in the 40th minute.
In conclusion, the calibration and reconstruction of the crest of the relief structures of the sector is recommended due to the previously established high input of rainwater flow to an interceptor whose main function is to conduct wastewater, resulting in unfavourable operating conditions. The optimization of these structures will allow control over the dilution of residual water, favoring the operation of biological processes in the Tunja wastewater treatment plant.

