


 English (pdf)
 Article in xml format
 Article references
 Send this article by e-mail
 Cited by SciELO
  Cited by Google
  Similars in
SciELO
Similars in
SciELO  Similars in Google
 Permalink
1. Introduction
The need to transport hydrocarbons in their liquid, gaseous or multiphase mixtures thereof and even in the presence of solid components, is required by several industries, particularly the oil industry. When offshore fields are exploited, very long pipelines are generally used to bring both oil and natural gas to shore, as well as risers to bring the produced products from the seabed to the surface. These pipelines are exposed to both regular marine currents and periodic oscillating flows such as those associated with marine waves. During typical operating conditions in the oil industry, the superposition of the complex dynamics of alternating vortex detachment, due to marine currents that impinge on the pipeline with the oscillating flow from the marine waves can also occur in the resonance range associated with the natural frequency of the structure. This can lead to an increased amplitude of pipe oscillation, causing accidents due to the fatigue of the pipes[1].
The study of vortices detachment from structure due to flows, particularly cylindrical structures, has been the subject of numerous studies which have been collected in significant reviews[2-5]. Aspects such as the effects of pipe mass and internal flow on pipe dynamics were analysed, both experimentally and numerically as well as on vortices dynamics and fluid structure coupling as a result of energy transfer between the flow and the pipeline. Additionally, an analysis of the synchronization phenomenon deserves a special mention. This occurs when the vortex detachment frequency is very close to the natural pipe frequency, the amplitude of the oscillation increases substantially when synchronizing both frequencies and producing a resonance as reported experimentally by[6] and[7]. Feng[8] showed that this resonance occurs mainly when a dimensionless number called reduced velocity, U/(f n D), is in the interval between 4 and 8. In reduced velocity definition, U is the free stream flow velocity, D is the cylinder diameter and f n is the natural structural frequency. Oscillation amplification due to subharmonics of the main frequency may occur at other intervals of reduced velocity. When synchronization coincide with the oscillatory flow frequency, catastrophic consequences could occur by further increasing of the oscillation amplitude, leading to irreparable damage to the mechanical structure[1].
In general, several years ago, as mentioned by[1], most studies that analysed this type of flow used the Morrison approach[9], which consists in the combination of inertial and drag forces that can be expressed as an ordinary differential equation that models the pipe behaviour in the direction of incident flow, without taking into account the effects of vortex detachment. Anagnostopoulos and Iliadis[10] modelled the oscillations of an elastic cylinder in an oscillatory current superimposed on a uniform current, using the finite element method to analyse the effects of the relationship between the frequency of the oscillatory flow and the natural frequency of the structure, in the flow patterns for various Keulegan-Carpenter numbers in laminar flow.
Considering the effects of vortex detachment requires the direction transverse to the incident flow to be included, to build a model with two degrees of freedom. The characterization of pipeline dynamics in the presence of an oscillatory flow with a frequency ω, whose velocity is computed as U=U 0 +U m cos(ωt), is expressed as a function of a dimensionless number similar to the relative velocity, defined as the Keulegan-Carpenter number which is defined as Kc=2πU m /(ωD)[1]. Thus, for Kc> 4, a complex vortex shedding dynamic is established and the shedding frequency f s changes successively with increasing Kc, taking values that are approximate multiples of the oscillatory flow frequency. Meneghini[11] carried out a numerical study using the discrete vortices method on risers subjected to an oscillatory flow, with the aim of obtaining the relationship between the amplification factor of the drag as a function of the relationship between the amplitudes of uniform and oscillatory flows and the Keulegan-Carpenter number. In particular, they analyse the repercussions that the variation of the relationship established between the flow components entails in drag behaviour in the in-line direction, in addition to studying the similarities and discrepancies of the results obtained by numerical methods with those proposed by theoretical models, and thus subsequently comparing them with the experimental results obtained by[12].
Nevertheless, even though the oscillation magnitudes in the transverse flow direction are much larger than those of the oscillations in the flow direction,[13] showed that when oscillations in the flow direction become appreciable, the amplitudes of the oscillations in the transverse direction of the uniform flow are affected. More recently,[14] using the finite element method modelled systems with two degrees of freedom that considered the effects of turbulence using the SST (Shear Stress Transport) model, analysing the effects of the Keulegan-Carpenter number on flow patterns. Recently,[15] studied the vibrations induced by vortices of a cylinder forced to oscillate harmonically in an oscillatory flow, finding a predominance for frequencies associated with the first two harmonics of the natural frequency and the frequency of the oscillatory flow. However, despite the great effort made to analyse these types of flow, to our knowledge no other study has focused on determining the differences in predicting the amplitudes of the oscillations when using models of one or two degrees of freedom.
In this study, two models for the dynamics of an underwater pipeline are compared, the first one is a one degree of freedom model that only considers oscillations of the pipe in the direction of flow with another model that considers additionally the pipeline oscillations in the perpendicular direction to the incident flow. The influence of the relative values of the excitation frequency of the incident flow with respect to the natural frequency of the pipe, as well as the effect of the relative value between the amplitudes of the oscillating component and the uniform flow are studied. Furthermore, a comparison with the simplified nonlinear model proposed in[1] is developed.
2. Description of models
2.1 Mathematic model
In this work, the dynamics of a vertical pipe or riser[16] subjected to an oscillatory flow was analysed. The flow is composed of free uniform U 0 and oscillatory U m cos(ωt) components, respectively, as shown in Figure 1a.
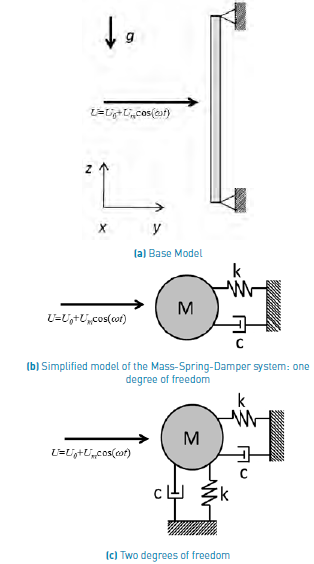
Usually, pipe dynamics of these types of configurations are modelled as a mass-spring-damper system [1], where k and C represent proportionality constants that allow the effects of tension forces and the structural damping of the pipe to be included, respectively.
Depending on the number of directions that the pipe can oscillate, a one-degree-of-freedom (1 DoF) model that only considers oscillations in the in-line direction [Figure 1b), and a model that additionally allows oscillations in the transverse or cross-flow direction, two-degrees-of-freedom (2 DoF) model, have been developed, as shown in Figures 1b and 1c, respectively.
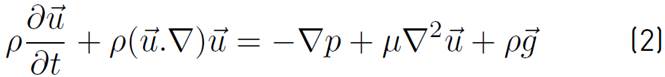
The equations of movement that govern the flow of fluids in these systems, conservation of mass and linear momentum, considering laminar flow, are Equations (1) and (2)[17]:

where t is the time,
 is the velocity field, p the pressure,
 and
and
 are the density and dynamic viscosity of the fluid, respectively, and
 is the gravity acceleration. The fluid is water and the gravitational effects were not considered because they act in a parallel direction to the pipeline axis.
The structural model is represented by Equations (3)[18]:
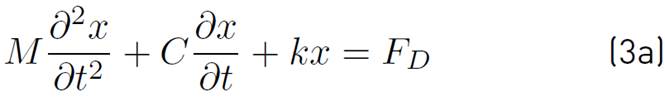
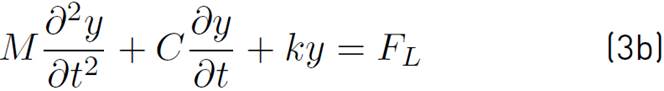
where x and y are the in-line and cross-flow cylinder displacements, respectively, M is the structural mass, C and k are the structural damping and structural stiffnesses (equal in both directions) respectively, and F D and F L are the drag and lift forces, respectively. Equation (3)b is only considered for the 2 DoF model.
2.2 Computational model
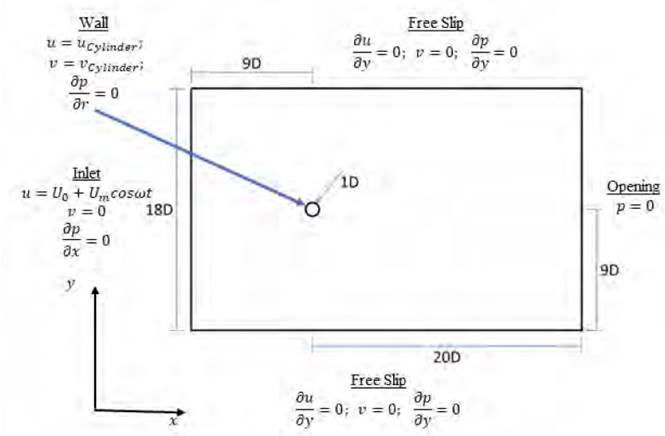
These equations were solved numerically using the ANSYS-CFX software, which has been intensively validated in this type of flow by[19] who studied the variation of the Strouhal number, the lift coefficient and the resistance coefficient for the flow around of a static cylinder in a laminar regime and thus obtained a sensitivity analysis of its values in regards to the proximity of the domain boundaries to the cylinder. Figure 2 shows the dimensions of the computational domain following the recommendations of[19].
The mesh was designed to allow it to be modified and refined in more detail in sections near the cylinder and by concentrating displacement in specific regions. The domain is divided into 19 blocks, as shown in Figure 3.
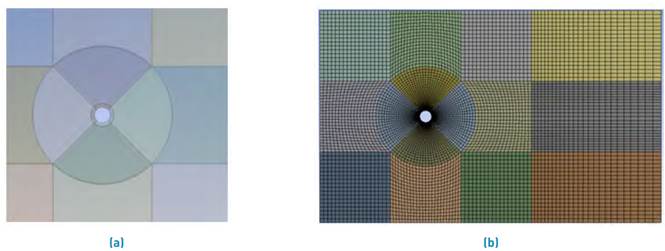
The four rigid blocks adjacent to the cylinder are shown in Figure 3b, and the mesh is built in them so that the perpendicular distance between the cells and the cylinder walls remains almost unchanged during the oscillations, trying to preserve the uniformity of the elements closest to the cylinder. Thus, during the oscillations of the pipeline, the integrity of these elements is not compromised by relatively large displacements. The mesh elements in the area near to the cylinder are more refined, with a ratio 1/30 times the diameter of the cylinder.
The boundary conditions are shown in the Figure 2. They are: (a) non-slip condition on cylinder walls, (b) symmetry on the front and anterior face (not shown in the Figure given the characteristics of the software used), (c) Dirichlet conditions for the velocity at the domain inlet, (d) fixed pressure at the exit and, (e) free slip condition in the upper and lower walls, respectively.
The Reynolds number was kept under 150 to assure that the flow was laminar in all the physical domains[20, 21], including the wake behind the pipeline. To assure this condition, physical and geometric parameters were selected to guarantee values of reduced velocity (U/fD) were in the range where lock-in regime occurs[1].
The time step was selected to have a Courant number less than 1 once a quasi-periodic regime was achieved. This choice also ensures that the cylinder moves slowly, avoiding distortions in the moving grid and convergence problems in the structural solver. In all the analysed cases, numerical parameters were selected in order to have numerical residues of equations of mass and linear momentum conservation under 10-4
3. Results
3.1 Validation
For model validation, the predictions of amplitude of oscillation in the model of one degree of freedom were compared with the approximate solution presented by[1], who studied the response to an oscillatory flow of a system that possesses a one degree of freedom, in line with the flow, as the relationship between the excitation frequency given by the flow and the natural frequency of the system is varied. Blevins[1] used Morison's approach and proposed a model of one degree of freedom that requires the solution of a nonlinear ordinary differential equation (due to the term associated with drag). The parameters used were estimated in such a way that they fulfil the dimensionless relationships presented in Table 1.
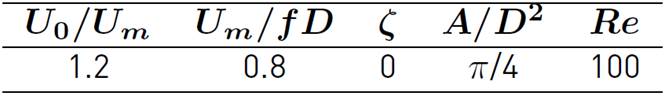
where U 0 and U m are the constant and oscillatory components of the velocity incident flow, respectively, f is the oscillatory frequency of that velocity, D and A are the diameter and the cross-sectional area of the pipe, respectively, ζ is the damping and Re is the Reynolds number. Starting from the relationships expressed in Table 1, the other properties necessary for simulating the validation case are determined and are presented in Table 2.

The stiffness constant of the structure to define the properties of the pipe is determined from the natural cylinder frequency, using the relationship between the natural frequency of the system and the excitation frequency.
Three meshes were used for the grid independence analysis. A medium mesh with 7,788 elements and sizes of the first elements adjacent to the pipe of 1/30D was used to run the simulations. A finer mesh with 13,620 elements and a coarse mesh with 4,556 elements were used to analyse the convergence of the numerical results, ensuring in both meshes a proportional density distribution of elements consistent with that of the medium mesh. The results obtained showed that the average mesh allowed us to obtain numerical solutions independent of the degree of mesh refinement. Figure 4 presents the results obtained with the three meshes tested.
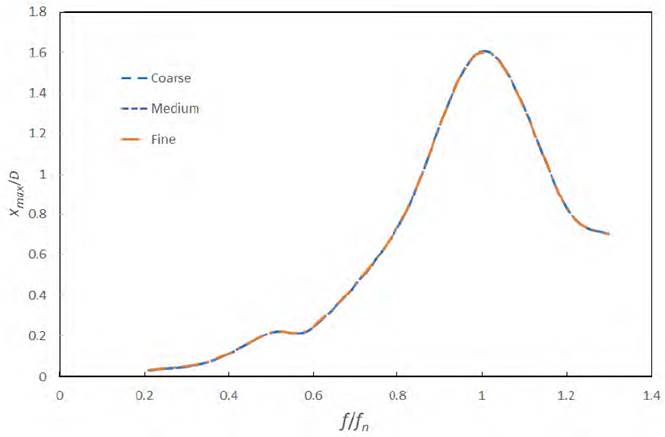
Figure 4 Comparison of the maximum oscillation amplitudes for different frequency relationships for the three meshes considered
The comparison between both models shows that for a range of values where the frequency ratio is less than that of the resonance state (f/f n <1), where f n is the natural frequency of the system, the results obtained approximate those established by[1] model; unlike f/f n >1 values (higher than resonance), where considerable differences between both models are evident, as shown in Figure 5.
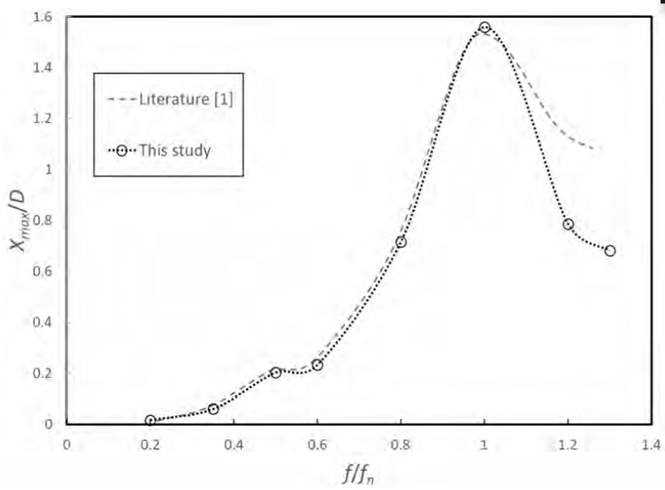
Figure 5 Comparison of theoretical and numerical models of the maximum oscillation amplitude for different frequency relationships
These differences can be explained because[1] extremely simplifies the effects of the external flux considering only one degree of freedom. Additionally, the numerical model is able to provide an adequate description of the inflection of both curves for low oscillation frequencies, around the frequency relation 0.5, where a sub-harmonic of the dominant frequency is found. Therefore, this model can be used with confidence to study pipeline dynamics considering both in-line and cross flow degrees of freedom.
3.2 Comparison between one and two degrees of freedom models
When comparing the results between the models of one and two degrees of freedom, it can be observed that adding another degree of freedom to the system does not seem to significantly influence the maximum oscillation amplitude in the in-line direction (parallel to the flow), with the exception of the amplitudes corresponding to f/fn=0.5, as shown in Figure 6. This aspect will be analysed later.
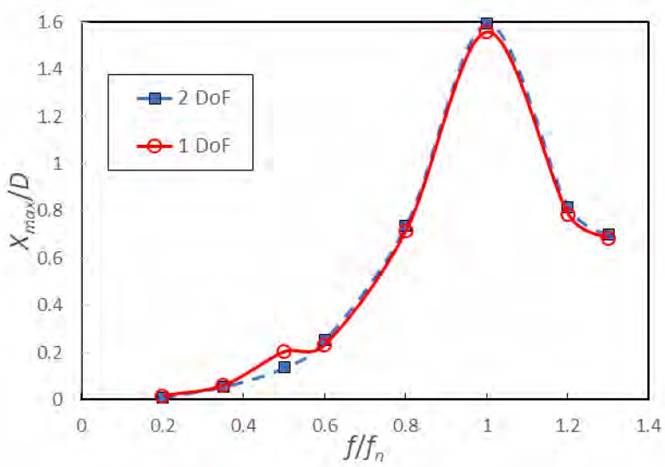
Figure 6 Comparison of maximum oscillation amplitude for different frequency ratios for models of one and two degrees of freedom
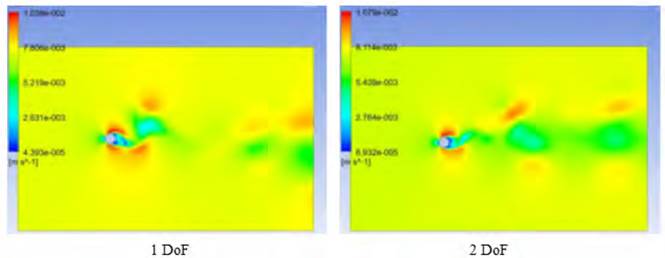
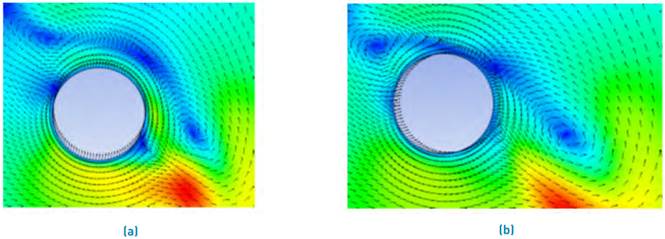
The results obtained mostly present a percentage difference of less than 10%, except for the case for which the excitation frequency is equal to half the natural frequency of the system (f/f n =0.5) where the percentage difference was 33.6%. However, these amplitudes are far from the maximum obtained for a ratio of frequencies equal to 1, which are approximately eight times larger. Therefore, important consequences are not expected due to these differences for the practical purposes. However, the flow pattern for the same instant of time shows notable differences between the two cases in the surroundings of the cylinder for a frequency ratio of 0.5, as shown in Figure 7; unlike what happens with a frequency relationship equal to 1, resonance, in which the flow at the periphery of the cylinder has great similarities. This behaviour complements the results obtained for the amplitudes.
It is important to highlight that the 2 DoF model does not show a peak for values of f/fn=0.5 such as it is found by the 1DoF model. This same resonance subharmonic is also obtained by[1], by solving both linear and no linear models based on ordinary differential equations which consider fluid flow forces through of values of mass added and drag coefficients constants. Therefore, it is possible to conclude that this peak is not a subharmonic resonance but is the result of limitations of simplified models 1 DoF models in capture the flow dynamics when f/fn=0.5 where drag and lift coefficient trends of the 2 DoF model are very different to the trend of drag coefficient from 1 DoF model as it is shown in the Figure 9.
Figure 8 presents the cylinder trajectories for four different frequency relationships. For those values where the frequency relationship is not 0.5, it is notable that although considerable amplitudes are observed perpendicular to the flow, these do not seem to greatly influence the horizontal displacement of the pipe. The most notable case is that corresponding to a frequency ratio of 0.35 where the amplitude in the cross flow direction is almost 8 times that the obtained in the in-line direction; analogously, it occurs for a frequency ratio of 1.3 where the maximum amplitudes are similar to each other.
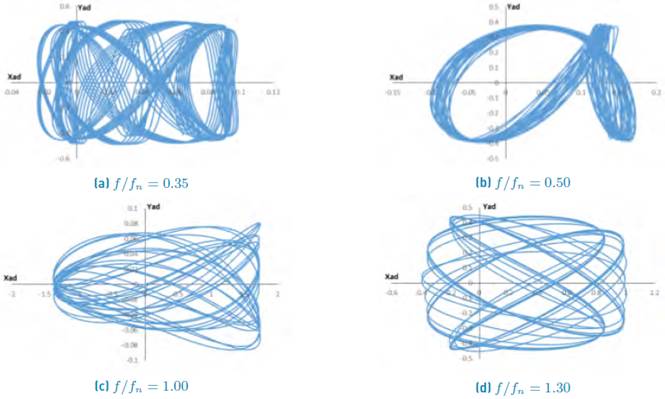
Even though a complete fatigue life study requires the mechanical properties of the pipe material, it can be inferred from the results obtained from the numerical simulation, with one and two degrees of freedom models, that it is necessary that any fatigue analysis should be carried out with the values of forces on the pipeline obtained from the simulation considering two degrees of freedom, because they show appreciable amplitudes in both directions, parallel and perpendicular to the flow, unlike the model of one degree of freedom that can only be capable of predicting amplitudes in the direction parallel to flow. Furthermore, it is important to highlight the synchronization of movement observed between both directions shown in Figure 8b for a frequency ratio of 0.5. This synchronization cannot be captured by the 1 DoF model and it is the main cause of differences between predicted by 1 DoF and 2 DoF models in amplitude motion for this particular ratio of frequencies.
In addition to observing the amplitudes corresponding to the various frequency relationships, the behaviour of the drag coefficients was also evidenced as the f/fn ratio varied, which is presented in Figure 9.
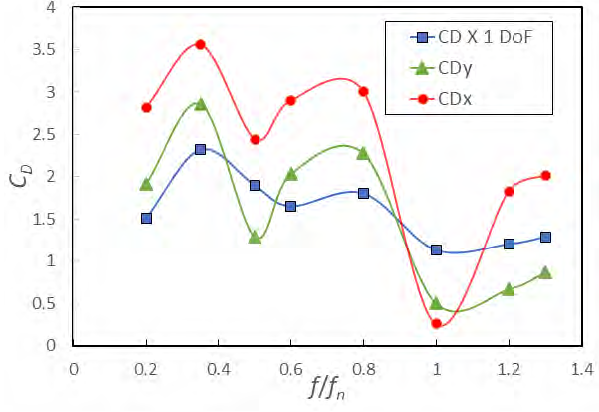
Figure 9 Average values of the drag coefficient in on-line direction CD (1 DoF), CDx (2 DoF) and cross flow direction CDy (2 DoF)
Comparing the behaviour trend of the amplitudes [Figure 6] and the drag coefficient [Figure 9], it can be seen that when the frequency ratio value f/fn is 1, that is, resonance, the amplitudes grow to reach its maximum value unlike the drag coefficient values that decrease from this point. It can be inferred that this inversely proportional behaviour is due to the fact that when the pipeline resonates with the flow, the pipeline does not "oppose" the force generated by the medium because both are at the same vibration frequency and therefore the amplitude of the oscillations is greater when the drag is less. Both models follow the same trend.
However, it can be seen that the drag coefficient values in the in-line direction are consistently lower for the 1 DoF model compared to the 2 DoF model, while the drag coefficient values in the cross flow direction are consistently lower than values of drag coefficient in in-line direction but they have the same order of magnitude. This fact reinforces the need to carry out 2 DoF analyses of subsea pipelines when aspects such as fatigue life of the structure must be considered.
3.3 Influence of relative values of the oscillatory flow component (Um) compared to the uniform component (U 0 ) in drag coefficient
Meneghini [11] describes the behaviour of the relationship between the drag coefficient corresponding to an oscillatory flow U m and that of a uniform flow of velocity U 0 through a numerical model based on the method of discrete vortices for a fixed pipe. This behaviour is divided into two cases of interest, U 0 < U m and U 0 > U m . Figure 10a compares results of[11] with seven numerical simulations corresponding to values of U 0 /U m 0.4, 0.5, 0.6, 0.8, 1, 2 and 4. For U 0 < U m , it is observed that there is a significant difference in terms of the magnitude of the drag coefficient, but that the trend of both models shows a decrease as it approaches U 0 /U m values equal to one. However, the difference between the experimental results of[12], shown in green in Figure 10a and those obtained (in blue in Figure 10a) in this work follow the same trend.
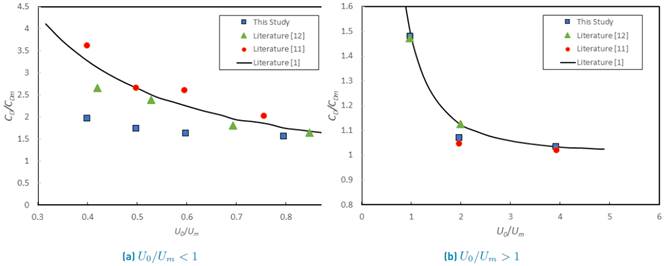
Figure 10 Drag amplification factor for a cylinder subjected to an oscillatory flow for values of U 0 /U m <1 and U 0 /U m >1
For the values of U 0 > U m , the trend of the numerical values obtained approximates the values described by[11], where it is established that as U m decreases in relation to U 0 , the drag acquires a behaviour similar to that in a uniform flow as shown in Figure 10b.
Additionally, a correspondence could be seen regarding the flow patterns that appear in the vortex street in different cases for values of U 0 /U m >1, with the results of[11], as can be seen in the Figure 11. For values of Uo/Um=4, Figure 11a shows a narrow wake, qualitatively similar for the results shown by[11]. Similarly, Figure 11b shows that for U 0 /U m =2, the wake opens very close to the cylinder showing excellent agreement with the results of[11].
As the relationship between U 0 /U m decreases, the vortex street pattern becomes distorted, to such an extent that the vortices can be visualized in unexpected regions, as seen in Figure 12.
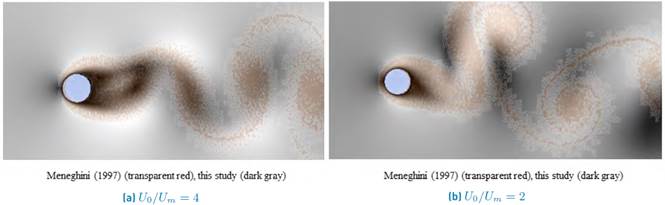
Since the numerical model used by[11] does not consider structural movements, this type of flow pattern is quite difficult to observe in their simulations.
4. Conclusions
The analyses performed show complex flow dynamics around a underwater pipeline subjected to a combination of a uniform flow and an oscillatory component. The predicted values of the flow variables and the displacements of the structure with models that consider two degrees of freedom are remarkably close to those of a single degree of freedom. However, in some cases, the oscillation amplitudes in the transverse flow direction can be much higher than the amplitude of the oscillations in the incident flow direction, which could have important consequences when estimating fatigue life in the materials used for pipes.
It is important to point out that, contrary to the predictions obtained using the 1 DoF model and the simplified linear and non-linear models, and based on the solution of ordinary differential equations that represent the effects of fluid flow through constant coefficients[1], there are no resonance conditions at the subhamonic at f/fn = 0.5. This behaviour was evidenced by a synchronization between motions in in-line and cross flow directions and by the presence of a relative minimum of drag and lift coefficients values that cannot be captured for 1 DoF models. In addition, it was corroborated that flow patterns in the wake are very different between the 1 DoF and 2 DoF models. Consequently, based on these results, no special precautions are necessary when considering field applications.
Variations in the magnitude of the oscillatory component notably influence the behaviour of the vortex street behind the pipeline. When the oscillatory component U m is less than that of the uniform flow U 0 , the behaviour of the vortex street is like that usually observed in a uniform flow. In the opposite case, for U 0 <U m , the vortex street is very distorted, vortices in front and behind the cylinder can be observed, as a consequence of the combination of both components of the flows and the movement of the pipe.
Otherwise, concerning drag behaviour, for values of U m < U 0 , the drag can be approximated to those of a uniform flow, while for U 0 < U m , the drag on the pipe increases compared to that obtained by a uniform flow.
In futures studies, the influence of the Keulegan-Carpenter number, considering turbulent flow regime on the amplitudes of the oscillations of the pipes should be analysed in more detail, as well as conducting fatigue life studies considering the results presented herein.

