


 English (pdf)
 Article in xml format
 Article references
 Send this article by e-mail
 Cited by SciELO
  Cited by Google
  Similars in
SciELO
Similars in
SciELO  Similars in Google
 Permalink
1. Introduction
The recognition of physical activities aims to understand the actions carried out by people and how they interact with their physical environment. Some of the areas of application are videogames, robotics, rehabilitation, sports engineering, safety, among others[1-4]. In this way, the identification of activities seeks to track the human body’s movements[1, 4, 5]. Different sensor methods such as depth cameras, inertial measurement unit sensors (IMU), and electromyography sensors (EMG) have been used to detect physical activity. Kinect One® is one of the most widely used non-invasive devices for motion tracking. This device records different types of data, such as articulated points, depth maps, and video. However, it poses practical problems with partial occlusions of the objective[6-9]. In other works, IMU sensors have been used, which measure the acceleration changes generated by movement. Although there have been advances using this sensor method, the advances have been invasive and require a device network to track activity[10, 11]. Other approaches have used electromyographic sensors (EMG) to measure muscle contraction and extension and detect movement[7]. Although these methods are robust to partial occlusions, both IMU’s and EMG’s require more than one sensor to completely register different activities; this is made computationally in the algorithm development process[2-7]. Modern approaches suggest that an activity can be represented as a continuous sequence or actions, known as primitive movements. In other words, the segmentation of activities into simpler components that are configured in n specific order can be classified using a learning machine approach. Although this approach produces satisfactory findings, a large volume of information is presented when labeling the data, making this process extremely expensive. Furthermore, determining a window size is a subject of study, and there is no satisfactory solution for it yet[1, 6, 7, 12, 13]. In other case studies, a codebook has been built with the key positions for each of the activities. Unfortunately, this process can only be applied with the articulated points of the skeleton, which limits the usage of other sensor methods[13]. The combination of different types of sensor devices has been an emerging topic of study in the activities recognition. However, there are a few studies where the fusion of more than two types of multimodal sensor system is performed[14-16]. In state of the art, combinations such as Kinect One® + IMU, Kinect® + EMG, and EMG + IMU y Kinect One® + IMU + EMG are reported[6-16]. This method has been found to attain a more satisfactory performance with respect to the methods that mix one or two types of devices[17-21].
The work from[16] carries out the fusion of the Kinect One®, IMU, and EMG for the characterization of the movements through two redundant classifiers (SVM and a hidden Markov chain (HMM)) where efficiency greater than 95% in the detection of activities is achieved. Although satisfactory findings are computed, their computational cost is high, and the number of activities under study is limited, which does not allow evaluating the real scope of the method. On the other hand, the state-of-the-art reports difficulties in classifying primitive movements claiming issues in the labeling and overlapping the data. Therefore, a penalty paradigm is required in order to assign less weight to data that biases the model. For instance, some papers have achieved satisfactory findings in classification problems where overlapping conflicts regarding the data reported.
This article studies the usage of SVM penalized classifiers as methodological tools to increase performance detecting primitive movements. In summary, it follows the procedure shown in[13-16] with a penalized classification model in the recognition of sub-activities using the SVM sanctioning strategy explained in section 2. The findings are validated and compared with different sensor methods and state-of-the-art models. The main contributions of this article are:
Construction of an annotated database with the synchronized registration of three sensor methods (Kinect One®, IMU, and EMG). The same configuration proposed by[16] is used to construct the database extending it to 10 physical activities.
A procedure that improves the performance of the primitive movement classifier through a paradigm of data penalization that can compare its own performance with similar methodologies that do not consider penalization[13-16], evidencing the benefits of the proposed technique.
This article is organized as follows. Firstly, a methodological section shows the summary of the procedure used to recognize physical activities, emphasizing the methodological instruments utilized. Secondly, a section goes over the findings where the performance of the method is evaluated and quantified. Lastly, a section describes the conclusions and further discussions of this research.
2. Methodology
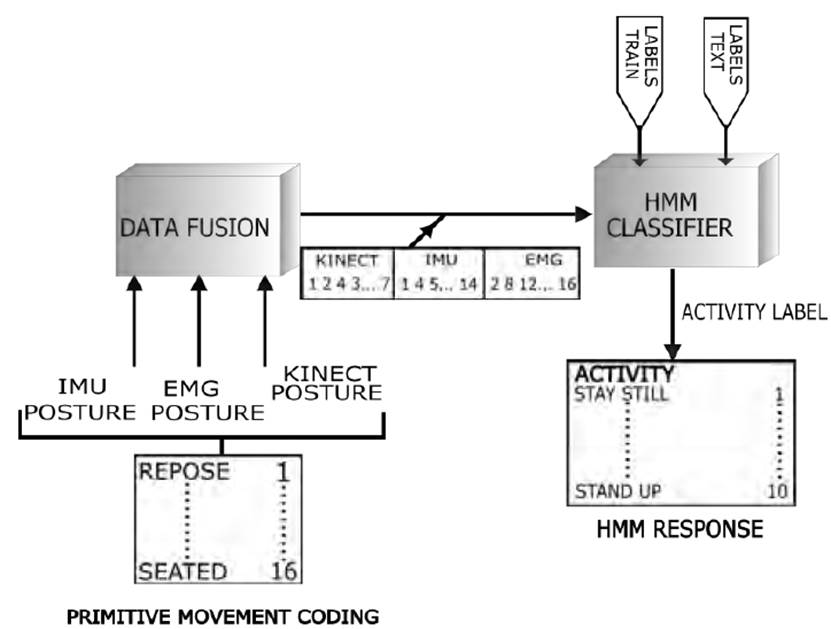
Figure 1 shows the methodology used for human physical activity recognition, mainly based on the work shown in[16]. The method starts with the identification of the primitive movements that later determine the activity performed according to the coding or sequence of the sub-movements. In turn, the model controls a task based on the execution of a sequence of simpler sub-tasks through a hybrid model between HMM and SVM, as is pointed out by[22]. This means that the SVMs segment the input data, and the HMMs use the output of the SVMs to determine the most probable sequence regarding time; thus, the methodology allows the execution of new actions according to a set of known movements. Moreover, it is possible due to the characteristics of the support vector machine to classify multidimensional data and to identify the HMMs ability when they operate with temporary sequential data[12, 22, 23]. It is important to point out that the HMM allows decoding the labels computed by the penalized classifier of micro-movements (sub-activities) and then reconstructing and recognizing the physical activity. Modern deep learning methods have been introduced to identify human physical activities achieving good findings when compared with classical techniques. However, they have been considered under a procedure that classifies the movement first and predicts the activity later, giving context to the movement. The foregoing disagrees with the approach to classifying human activities by primitive movements since the merged micromovement space is small, discrete, and inhomogeneous[24].
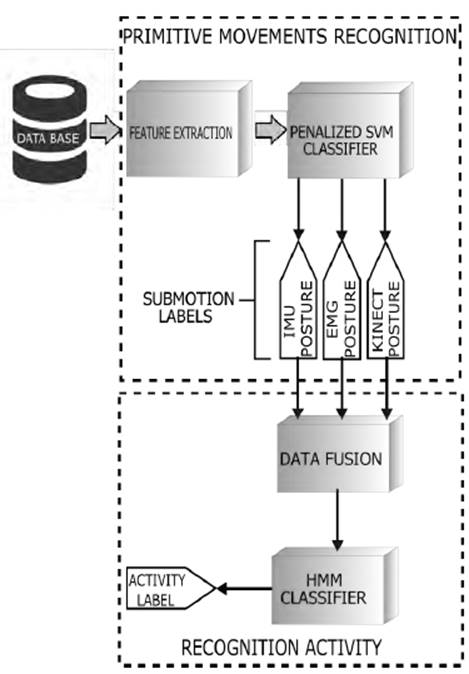
Unlike the work by[16], a penalized SVM is introduced in order to punish atypical and spurious data. Consequently, the performance and efficiency in the detection of the sub-movements through a sanctioning paradigm can be evaluated.
2.1 Data capture system
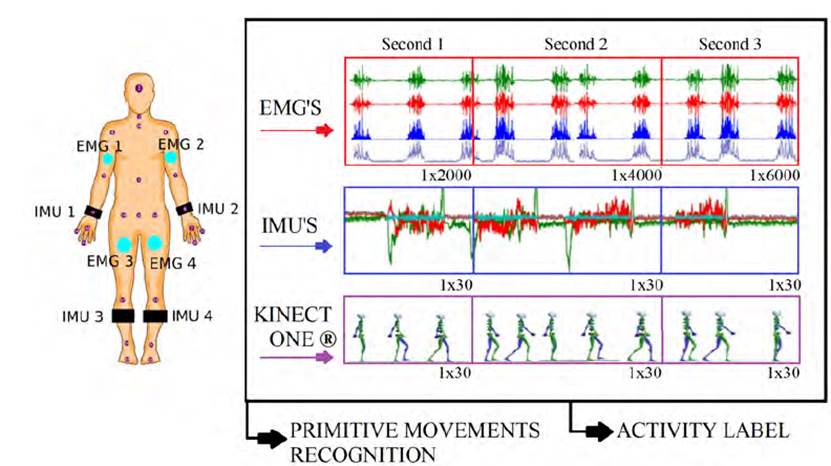
A database consisting of 10 activities with some challenges in classifying activities such as walking and jogging, sitting, and getting up, among others, was created. The construction is divided into two tasks. Firstly, there is a storage of the synchronized record of the sensors (Kinect One®, IMU, EMG) in a binary structure. The data acquisition was carried out through the LabView Software following the suggestion expressed by[16, 25]. Figure 2 shows a graph that summarizes this stage. It is important to say that there are different articulated points for each sensing modality, where the articulated points of the Kinect One® are represented with ψ using Cartesian coordinates system, the acceleration vector IK is delivered by the IMU sensor, and EMG is an information vector which takes information by electromyographic sensors.
The second stage consists of labeling the activities as well as the primitive movements of the executed sequences. The first sequence was determined according to the ones presented in[1, 15, 16, 24, 25, 26]. Table 1 lists the 10 activities with their respective labels provided in this work. The data was retrieved from 12 participants (8 men and 5 women with 5 repetitions).
The primitive movement labels were constructed by segmenting the signal for each submovement sequence for each of the actions. Therefore, the data collected in three seconds (see Figure 2] is divided into N windows. These signals are stored in a file encoded according to the following structure: Base {Example} {Second} {Sensor} {Segment}.
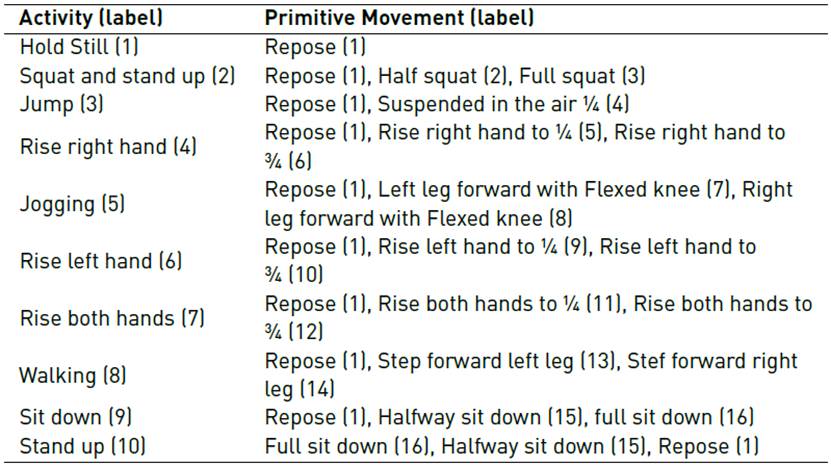
On the other hand, the labeling of the database was carried out manually. In this way, it was possible to observe the spatial distribution of the different postures provided by Kinect One® during the recording time, establishing the separation between each of the submovements. The selection of each primitive movement is achieved by analyzing the execution of each activity. In addition, the phases introduced in the study of the kinematic analysis of the upper and lower limb of the human body used in[27-30] were considered. Table 1 summarizes the primitive movements that were determined for each activity. After recording the execution of different physical activities, these data are segmented into small windows to obtain the primitive movements, producing a new database, which presents unbalance and overlapping issues. This is probably because during the developments of the activity, there are micro-movements that appear more frequently. For instance, positions like standing still have more samples than movements such as raising the left hand to ¼. There are also overlap issues with the EMG sensor network, a problem also reported in[16].
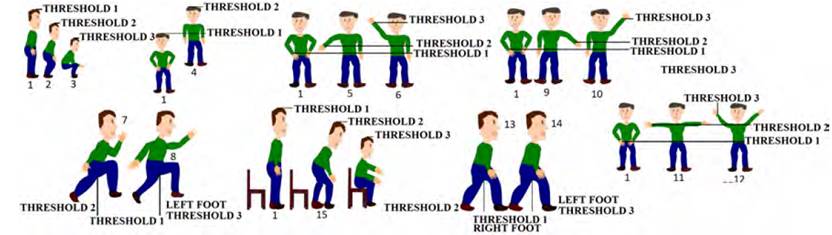
Figure 3 shows the thresholds of the labels established for each of the activities, considering the primitive movements defined in Table 1. Although threshold management could be considered a way to solve the issue, this approach does not accurately describe the activities and, requires human intervention for different cases[16].
2.2 Primitive movement recognition
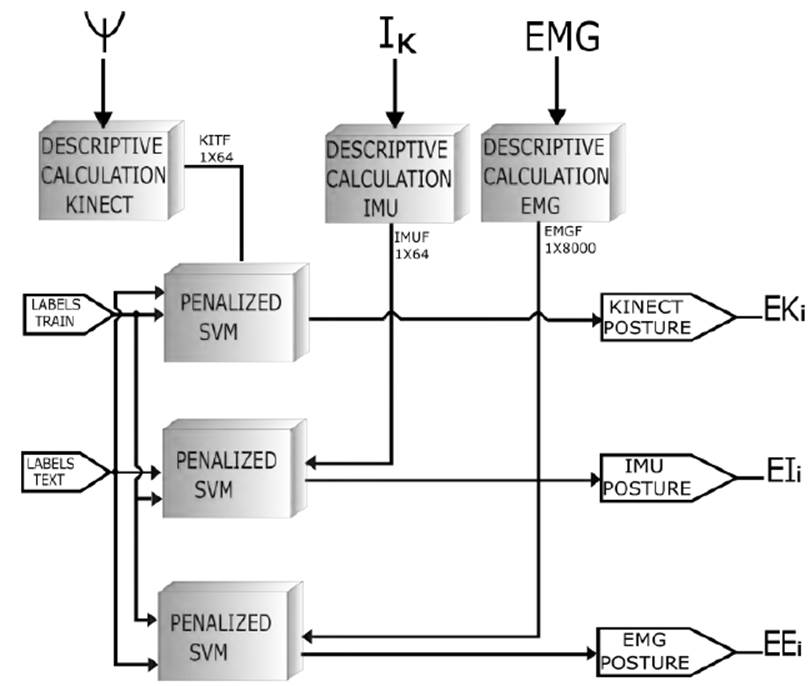
In this section, a dictionary describes the set of sub-movements as designed. Figure 3 summarizes the process for primitive movement detection for each sensing modality.
Kinect one® feature extraction
For all 25 join points provided by the Kinect One® (see Figure 1], the following descriptors were computed (polar and statistical) at a frequency of 15 Hertz[31, 32]:
Polar Features[33]
Each joinpoint was transformed
 to the polar plane by using the center of mass as the origin of coordinates
 of the Kinect One® join points (see Figure 1], which allows obtaining the vector Equation (1).

Where P
i
is the feature polar vector in the i-th sampling window for i={1,2,3}, r
j
and
 are the radial and angular components, respectively, of the joinpoint, with j = {1,… … .25}. Figure 4 shows a graphical diagram primitive movements detection.
Statistical Descriptors
The arithmetic mean (m
x
m
y
m
z
) and the variances (v
x
v
y
v
z
) of the spatial coordinates of the Kinect One® join points {x, y, z} and their polar equivalent
 were calculated with respect to the centers of mass {CM
x
, CM
y
, CM
z
}, obtaining the following feature vector Equation (2).
were calculated with respect to the centers of mass {CM
x
, CM
y
, CM
z
}, obtaining the following feature vector Equation (2).

Where
 are the mean of the polar coordinates and
 their variances. Finally, the total feature vector for each join point KITF
j
Equation (3) of the Kinect One® was calculated by concatenating P
i
and MP. For more detail of the process of these descriptors refer to[7].
their variances. Finally, the total feature vector for each join point KITF
j
Equation (3) of the Kinect One® was calculated by concatenating P
i
and MP. For more detail of the process of these descriptors refer to[7].

IMU Sensor network feature extraction
The IMU network data (see Figure 2] focuses on measuring the tri-axial components supplied by this network; the vector (a x , a y , a z ) is obtained, where the variables are the rectangular acceleration components. Then, we calculated the Roll and Pitch orientations by performing the spherical coordinates conversion. This way, vector I k Equation (4) is reached at each sampling time and for the k-th IMU of the network, k is defined as k = {1,2,3,4}. The sampling frequency for each k sensor was 30Hz.

The characterization of the vector I k is performed by calculating the characteristics based on the physical parameters of human movement[34] (measurement of the AI, variance of AI (VI), area of magnitude of normalized signal SMA, dominant direction eigenvalues EVA, average acceleration energy AAE and average rotation energy ARE). Additionally, statistical measures to I k , which are the arithmetic mean and the variance of the rectangular and spherical components of the accelerations were computed, obtaining the following vector Equation (5):

With IMH = [AI VI SMA EVA AAE ARE], Im a = [m ax m ay m az m ar m ap ] and Iv a = [v ax v ay v ar v ap ]. Where m aw and v aw is the arithmetic mean and variance of the rectangular and spherical components of I k , with w = {x, y, z Pitch, Roll}. For more detail of the process of these descriptors, refer to[7].
EMG Sensor network feature extraction
As can be seen in Figure 1, during this stage, four muscles of the body are sampled at a frequency of 2KHz, obtaining an analogous signal in the p-th EMG sensor being p = {1,2,3,4}. Then, sampling window V q was characterized by a Waveleth transform, acquiring a feature vector EMG p Equation (6), whose dimensions are 1 × 2000. For each window q, the following feature vector reached.

2.3 Primitive movement classification
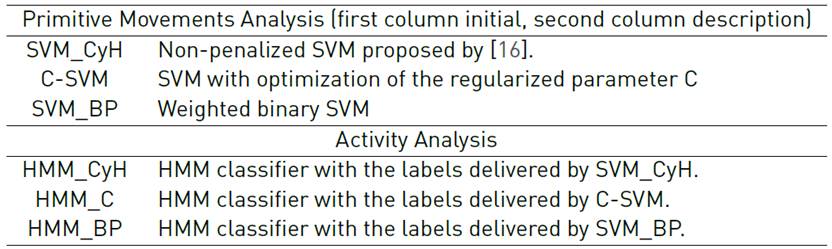
Three models of multiclass support vector machines with several classification strategies were used. Firstly, the C-SVC penalty method was used (see Figure 5a)[35]; secondly, the Weighted Binary SVM was implemented[36] (see Figure 5.b); and lastly, a classic SVM method was used. For all the models, a Gaussian kernel with a radius of 1x10⁻⁴ was established by coupling the database in section 2.2. In this case, it is preferred to penalize the data in the database because they present issues such as class overlapping and unbalance, in addition to the Kinect One® partial occlusions or auto-occlusions, or loss of connection in the acquisition systems of the signals from IMUs or EMGs, which affect the performance and efficiency of the classifier in the identification of the primitive movements[16-37]. For more details, refer to[22]. On the other hand, the specified value of
 corresponds to an initial value[6-16], which is refined in a search grid through a Monte Carlo experiment.
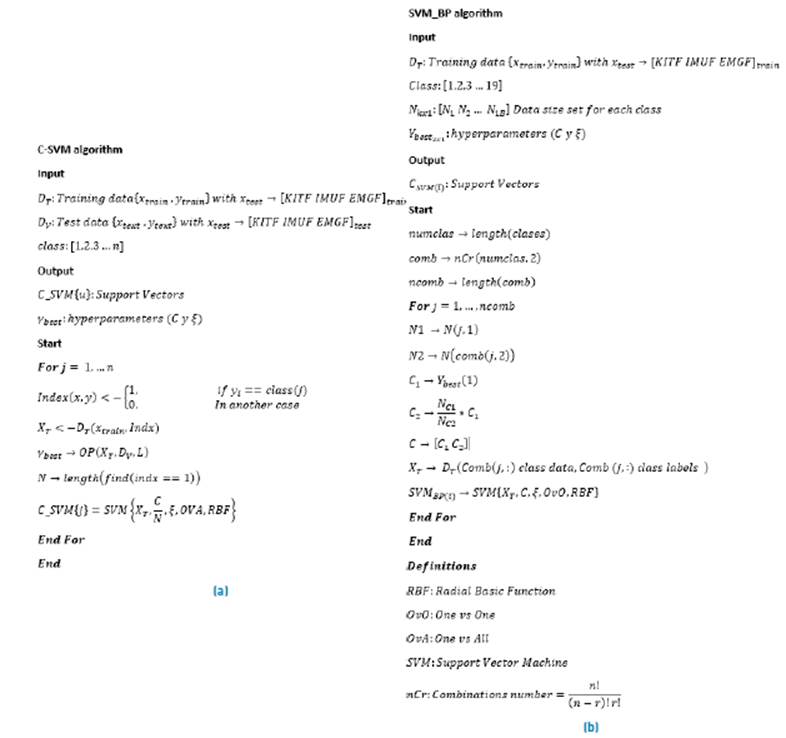
On the other hand, the penalized models seek to punish the regularization SVM parameter (C y ξ) considering the size of the data in the search grid. For this specific case, the Bayesian Optimization Procedure (OP) was implemented. This algorithm allows computing the regularization parameters of the penalized strategies (C and ξ), given the training vector D t and the validation vector D v .
The value of this parameter can be very small (close to zero) or very large (tend to infinity), allowing the data penalization that is on the wrong side of the margin limit and thus minimizing the training error. However, these methods are sensitive to atypical information present in the data, the error is increasing in a linear process. Therefore, it is important to choose a suitable initial value for C[38]. Some authors recommend performing an observation grid by finding a value for C within the range in order to maximize the margin while penalizing the data located on the wrong side[36, 39]. In this work, an observation grid of [1x10⁻³, 1x10³] was selected to compute a C value for each class (see Table 1]. On the other hand, these models consider the size of the training data set for the penalization of the regularization parameter C, which operates differently for each case. Assuming that SVM is a bi-class approach, with C-SVC there is a value of C with respect to the size of the data set to be classified, while with binary-weighted SVM, two values of C (C 1 , C 2 ) for each one of the classes are obtained.
3. Activity recognition
Based on the list of activities listed in Table 2 and the response of each of the SVMs, a posterior merge is developed, and the HMM is applied to identify the physical activity. Therefore, a vector of characteristics EF is created that linearly concatenates and no weighting the labels generated by the classifiers of each sensor during the observation window of three seconds, as shown in Figure 6. Equation (7) describes the vector structure EF.
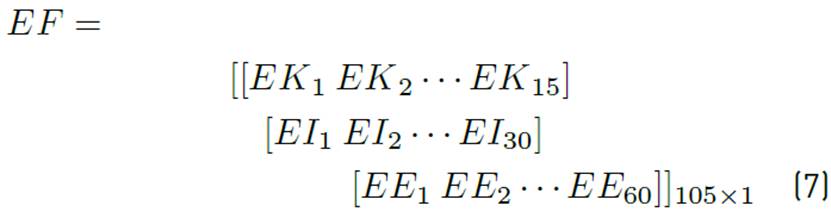
Where:
EK: Feature vector of the SVM provided by the Kinect One®.
EI: Feature vector of the SVM provided by the IMU sensors network.
EE: Feature vector of the SVM provided by the EMG sensors network.
3.1 Model classification, training, and validation
The evaluation and validation of the model by using the cross-validation strategy through iterations in a Monte Carlo experiment with the stop criteria ||diag (M k ) - diag (M k-1 )|| < 0.001 were performed, where diag (M k ) is the vector generated by the diagonal of the confusion matrix, and k is the current average Monte Carlo iteration. The training data set (according to the database) of the model established in this work was 70%, and the remaining 30% was used for validation; the fragmentation of these percentages was performed randomly for each iteration. This allows observing the behavior of the HMM in the activity classification with different input data. In this last process, 24 states and 32 centroids for the construction of the codebook were used. To evaluate the classifier’s performance, the confusion matrix, and the total number of hits per iteration were calculated and evaluated, respectively, determining the average behavior of the findings.
4. Experiments and findings
This section shows the experimental findings that validate the proposed methodology. These are divided into two sections. Firstly, the performance findings in the primitive movement classification stage are documented, in such a way that the returns are recorded for both the SVM penalized cases (C-SVM and weighted binary SVM) with respect to the model proposed in[16]. Secondly, the results are taught in the physical activities classification stage; in addition, the efficiency of the HMM model is evaluated for different types of fusion of the sensor modalities. Given the large number of experiments carried out, the confusion arrays are omitted. It is decided to specify the classes with low and high performance, as well as the average behavior of the findings. For the identification of each finding, the coding of the experiments is presented based on Table 2:
The physical activity recognition for the following sensor combinations was performed:
Kinect One®, IMUs, EMGs, Kinect One ® + IMUs, EMGs, Kinect One® + IMUs, Kinect One®+ EMGs, IMUs + EMGs, Kinect One®+ IMUs + EMGs.
The metric chosen to show the findings in this work is the mean value of correctness and standard deviation.
4.1 Primitive movement analysis
Figure 7 shows the results obtained in the identification of primitive movements using the Kinect One® modality. A high performance of the experiments is evidenced, reaching efficiencies higher than 90%. In general, it should be noted that the SVM-BP method presents better performance than the one obtained with SVM_CyH. However, class 16 (axis of the abscissa) presents a low yield close to 20%. On the other hand, the C-SVM strategy shows a more stable behavior with a success rate greater than 90%. Figure 8 shows the results obtained for the primitive movements classification using the IMU sensor network. The penalized strategies (C-SVM and SVM_BP) have a performance value higher than 90% of accuracy. On the other hand, it is evident that these have a better performance than the one computed by SVM_CyH. It is highlighted that the SVM_BP method presents the highest efficiency with a success rate of 96.86% ± 0.01%. Figure 9 shows the performances of the classifiers by using the EMG sensor mode, where a low performance in comparison with those obtained in Figures 7 and 8 was observed. In summary, the SVM_BP method presents a better performance with 67.51 ± 0.01%. However, class 8 showed a low percentage of success of 11.85 ± 0.01%, which suggests the inability of the classifier to detect it. Although this result is not adequate, the other methods also show a similar trend of low efficiencies. This could suggest that the extraction of characteristics under this modality may not be representative. Although it is not possible to obtain a competitive detection with the EMG sensor modality, it is inferred that the penalized strategies manage to improve the performance of the classification with respect to the non-penalized model SVM_CyH. On the other hand, Figures 7, 8, and 9 show better performance under the SVM_BP paradigm.
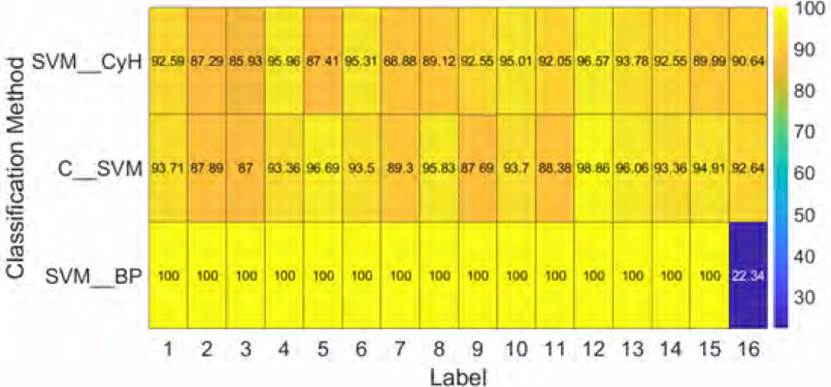
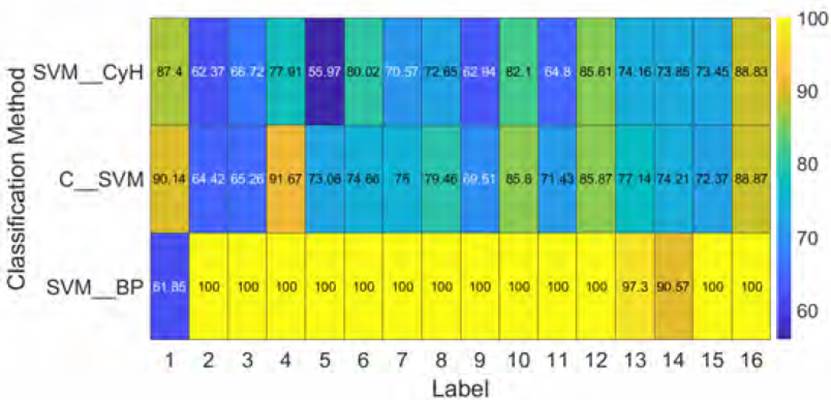
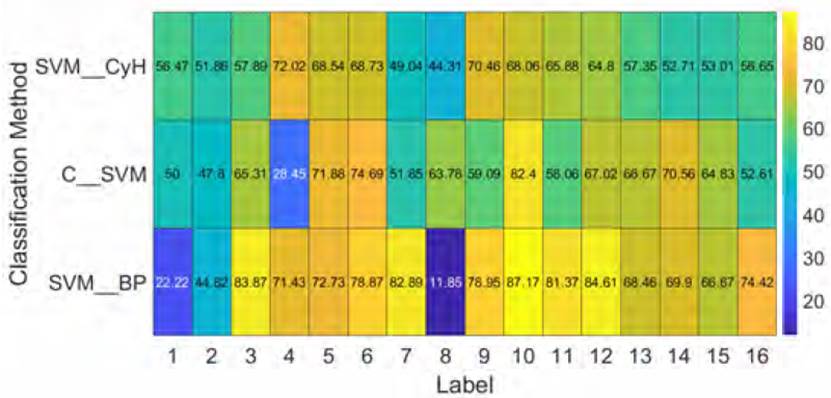
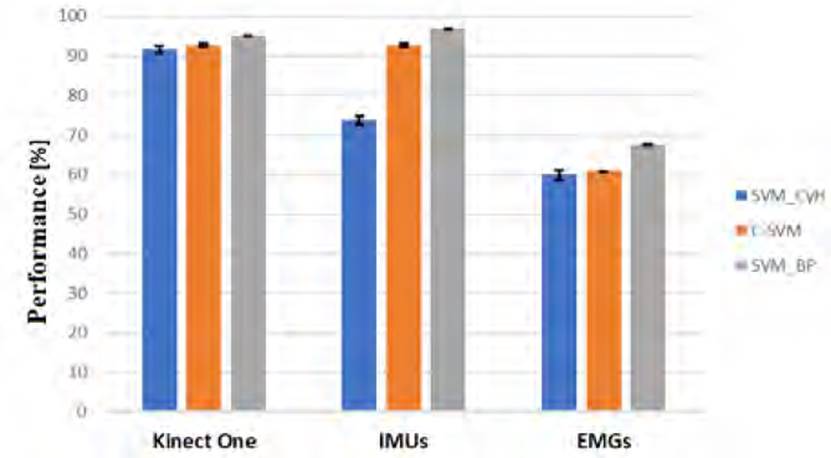
Figure 10 shows an average result that summarizes the finding shown in Figures 7, 8, and 9. It is important to highlight that the three sensor modalities under study present a better performance in the classification of micro-movements when the penalized strategy is coupled through SVM_BP and C-SVM. On the other hand, it is interesting to observe how the identification of primitive movements is more stable under this paradigm.
4.2 Physical activity recognition
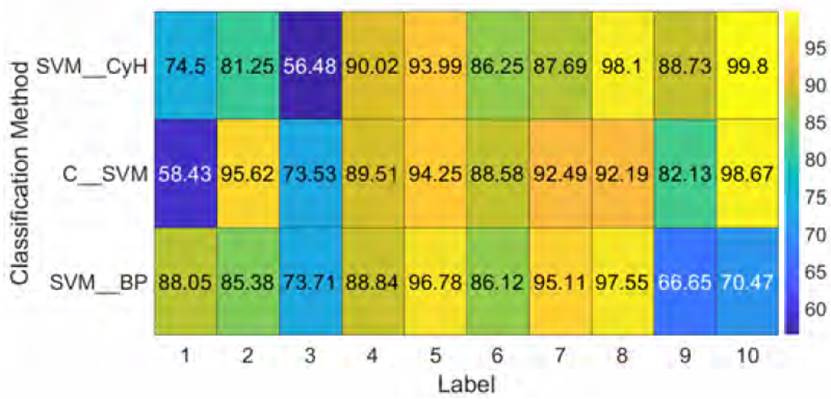
Figures 11, 12, and 13 show each sensor modality results. In summary, the performance of the activity classifier under the Kinect One® modality or with the IMU sensor network in most classes is greater than 90%, except for activities 2 and 3 with the HMM_CyH and HMM_C strategies, and activities 1, 9, and 10 with the HMM_BP technique in the Kinect One® modality. With the IMU sensor network, there are some issues with labels 3 and 5 by applying HMM_CyH and HMM_C algorithms, where efficiencies are under 80% of accuracy.
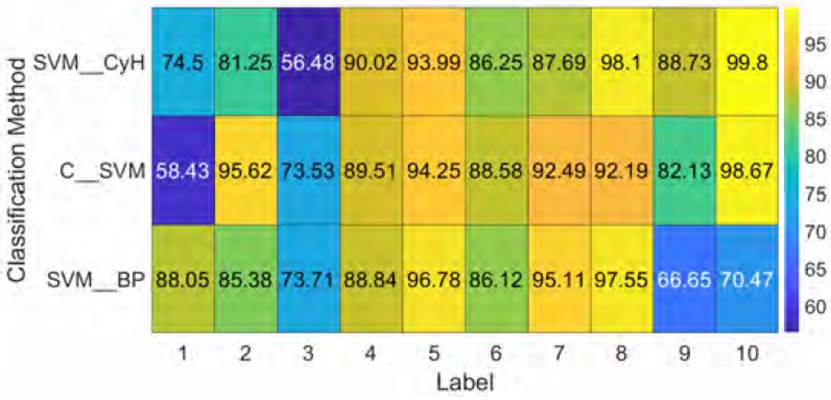
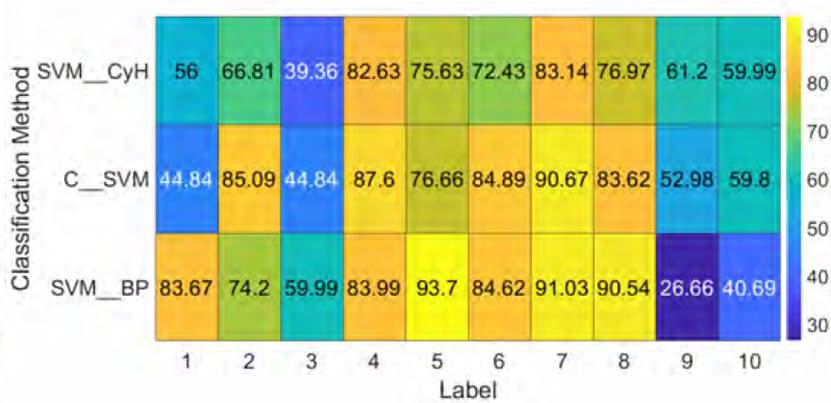
The same outcome is observed with classes 9 and 10 of the HMM_BP model. On the other hand, with the EMG sensor network, an acceptable performance was achieved because label 7 (see Figure 13] shows the highest percentage of success compared to other activities, exceeding 83% of accuracy. The results suggest that only one sensor modality is sufficient for physical activity recognition. Although acceptable detection was managed with the EMG sensor modality, strategies to improve its performance should be explored in further studies. Meanwhile, Figure 14 shows the performances for the three human physical activity identification techniques are higher than 90%, under a structure of IMU sensors. On the other hand, the results do not show a significant statistical gap between them. At the same time, the three classification methods show an activity detection less than 70% of accuracy due to the sequence of labels generated by the SVM. Comparing Figures 11, 12, and 13, the sensor modality with the best performance for human physical activity recognition is the IMU sensor.
Kinect one® + IMUs experiment
Figure 14 shows the results of the fusion of two sensor modalities, reaching a performance greater than 82% with the HMM_CyH and HMM_C methods. It is important to highlight that the identification of activity 1 presents a performance of 100.00% for the three models under study. However, the lowest performance is shown by the HMM_BP method with 11% contrasting with those computed by HMM_CyH and HMM_C, which were 70%, respectively.
Kinect + EMGs experiment
Figure 15 shows that this combination of sensors performs poorly for classes 1, 2, and 3, making it for motion detection.
IMUs + EMGs experiment
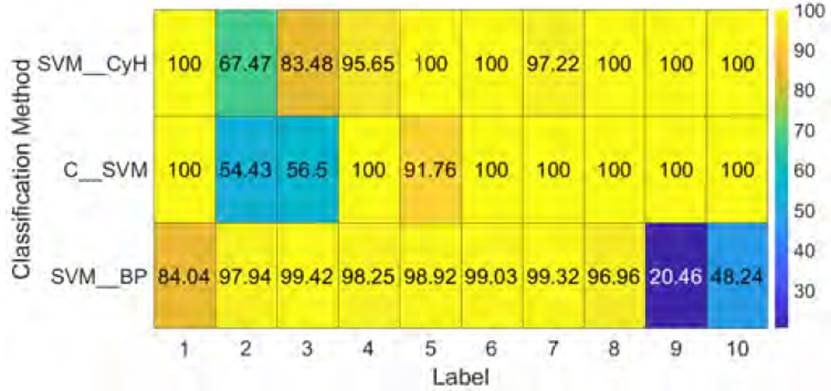
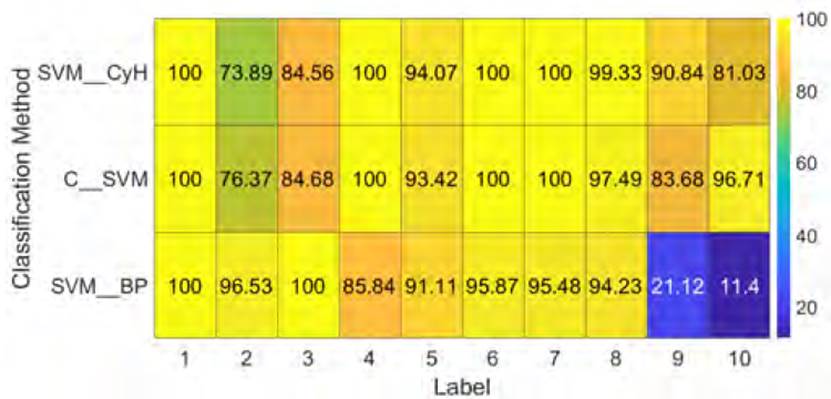
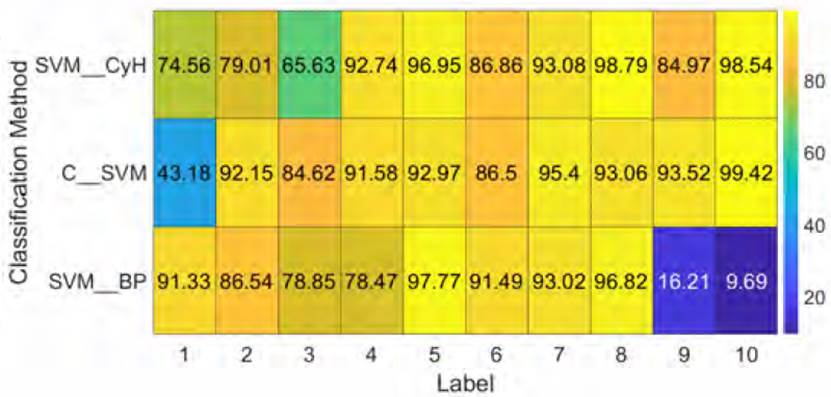
Figure 16 shows that the fusion of these two sensor modalities allows attaining a performance higher than 84%, where with activity 10 under the HMM_CyH and HMM_C methods, efficiencies greater than 98% are achieved, similarly with the HMM_BP strategy it stands out a yield close to 100% with the label 8.
Kinect one ® + IMUs + EMGs experiment
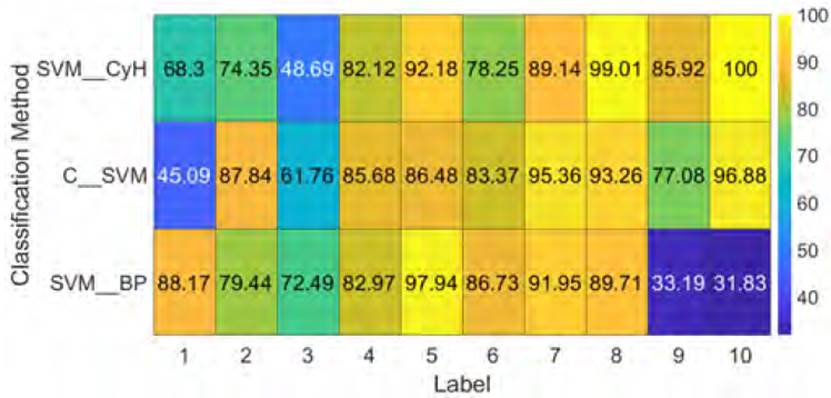
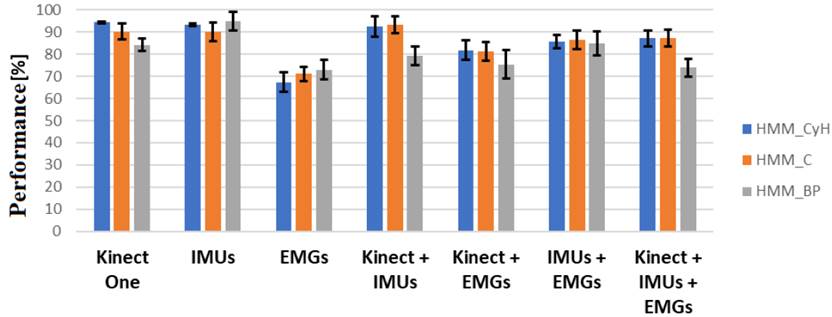
Figure 17 shows the results obtained under the fusion of the three sensor modalities, where the methods HMM_CyH and HMM_C present similar performances of approximately 87%. On the other hand, class 10 with the HMM_C method shows a 100% hit rate, unlike the HMM_BP method, where this class shows the lowest hit rate with 9%. Similar to what is shown in Figure 11 and Figure 18, the results (means ± standard deviation) of Figures 11 to 17 are condensed. It is observed that in the detection of the activities, the penalized strategy is competitive with respect to the non-penalized one (HMM_CyH). This suggests similar performances of human physical activities identification regardless of the penalty.
5. Conclusions and recommendation
This research work carried out a comparative study by articulating different learning models for primitive movement identification. These models[16] were compared against a punished paradigm that uses penalized SVM. The research found out that either of the two penalty methods increases the classifiers’ performance for the detection of primitive movements[16]. For the Kinect One®, the best result is achieved using the weighted binary SVM, which has an efficiency of 95.15%. For the IMU sensor network, the weighted binary SVM generates the best results with 96.86% accuracy. This method generates these results for the two sensor modalities due to the consideration of an existing imbalance between the classes, which improves the separation boundary. On the other hand, in the activity detection stage using HMM, it is possible to show that the Kinect One® sensor generates detections with greater efficiency, with a 93.23% performance. It was also found that merging different modalities does not always improve detection performance. This can be observed in Figures 15, 16, and 17, where these are reduced in the combinations that add information from different sensory sources. This data contradicts the results obtained in the work by[16] because by extending the database, the complexity of the data increases, and the sensors can deliver information that biases the model.
It is important to highlight that in this work, the database of physical activities developed by[16] was extended in 10 activities with the synchronized recording of the Kinect One®, IMUs, and EMGs, where more join points of the human body and 16 primitive movements were included. This finding means a significant contribution to the study of these methodologies. Indeed, it evaluates the performance based on the variations of activities and sub-movements to be identified in order to determine the scope or restrictions they present.

