


 Inglês (pdf)
 Artigo em XML
 Referências do artigo
 Enviar este artigo por email
 Citado por SciELO
  Citado por Google
  Similares em
SciELO
Similares em
SciELO  Similares em Google
 Permalink
1. Introduction
It is well known that oil manufacturers add a certain percentage of detergents as additives to the engine’s lubricating oil in order to contribute to engine cleanliness, provide protection and neutralize potentially corrosive acids[1]. Thus, detergents aid in the control of deposits and help keep contaminants suspended in the oil so they can be carried to the filter and removed. Some detergent chemicals, in addition, also neutralize the acidic by-products of combustion. In doing so, they function as corrosion inhibitors[2].
Additives, therefore, help the engine by protecting it against the elements that can appear in the engine oil either from production (manufacturer), external atmosphere, and/or engine parts that wear out. Here, it must be stated that oil manufacturers do not list their oil composition (since it is an industrial secret), and also because it depends on the necessities of each engine and the fundamental application for which the engine is intended. The typical metallic elements that can be found in the additives of engine oils are: Zinc, Phosphorus, Calcium, Sodium, Barium, Boron, and Magnesium, in different concentrations and for different purposes[3]. However, as it will be shown later in this paper, depending on the content of certain elements found in a sample, they might be coming from the wear and not really from the lubricant additives (see Table 1].
Naturally, it is evident that after using the engine oil, the additives are not only are consumed, but the oil gets contaminated due to physical or chemical impurities.
The analysis of contaminants in fuels and lubricants is nowadays an important and growing tendency; in part due to the environmental regulations worldwide (see, for example[4], [5]). In that sense, in the case of the automotive industry, for example, the majority of the reports are made mainly with the purpose of reducing the contaminants (such as phosphorous, sulfur, and metals) when the lubricants are being manufactured (see, for example, references[6], [7]), so that manufacturers also help not only in protecting the engine by adding additives but also in reducing the pollution or other possible types of environmental contamination.
On the other hand, in mechanical workshops, it is very important to perform analysis in engine oils mainly considering the following reasons[3]:
to evaluate characteristics of the oil being used.
to diagnose oil conditions.
to optimize periods of use.
to track the machine’s mechanical condition
Thus, mechanical workshops execute lubrication programs in order to i) improve the reliability of the components and/or monitor the condition of the lubricant, ii) reduce unscheduled stops, iii) schedule maintenance activities more efficiently, iv) detect potential failures before they occur and v) reduce lubricant consumption by arranging optimum oil drain intervals.
On the other hand, it is also important to mention that for decades, some of the most frequent techniques employed to analyze the engine oil elements with diagnosing purposes have been the Atomic Absorption spectroscopy, Ferrography, and Infrared spectroscopy (see[8]). Currently, the energy dispersive X-ray fluorescence spectroscopy (EDXRFS) and the inductively coupled plasma atomic emission spectroscopy (ICP-AES) have also been added and are frequently used for determining elements in both liquid and solid samples. Authors in reference [9] have made an attempt to investigate the adaptability of the EDXRFS for elemental analysis of different engine oils when compared with the results given by ICP-AES. This is due to the elemental composition of engine oil changes during its normal use.
Several reports have also been found in the literature for the determination of the elemental composition in oils by using the EDXRF technique (see[10], [11], [12]). However, to the best of the author’s knowledge, only references[3], [8], [13], and [14] were found with the purpose of detecting and correcting the engine parts that wear out more easily and contaminate the engine oil when something is not functioning properly in the engine. Though, except for the works of Tormos [3] and Valderrama and López [8], none of the cited studies were specifically done for the automotive industry.
This paper presents an analysis, by means of the X-ray fluorescence (XRF) technique, in used oil extracted from “hot” and “cold” engines of five 2.5 liter engine pick-up trucks in order to determine the elements present and to evaluate the effectiveness of the technique in helping with predictive maintenance of the trucks. Here it is important to remind that 2.5 L (or 2,500 cc) is related to the sum of all cylinders’ displacements. The XRF measurements were developed by means of the “standard-less” and the “calibrated” methods also to allow a comparison between them and to evaluate the effectiveness of each of the methods in this type of samples.
2. Experimental procedure
Before explaining the materials and methods, it is necessary to say that the use of a synthetic oil of known composition would help allow engine wear elements to be traced. However, as said previously, every oil composition is an industrial secret, and it was not possible to use such method here.
Two different commercial diesel engine oils were used in this research: SAE 10W-40 and SAE 15W-40. This was as a decision taken by the maintenance workshop which provided the samples for this study as they decided to change the oil type from SAE 10W-40 to SAE 15W-40 while the experiments were being performed. Therefore, as a reference, two samples, one for each diesel engine oil type, were taken directly as they come from the manufacturer. These commercial reference samples of diesel engine oils were thus labeled as 10WV for SAE 10W-40, and 15WV for SAE 15W-40. From here, readers should understand that the term “clean oils” is used for both unused commercial oils 10WV and 15WV.
For the used engine oils, a set of five 2.5 liter engine pick-up trucks were selected for this experiment. All the trucks were chosen in such a way that the vehicle’s utilization was in the range of about 85,000 to 160,000 Kilometers. Every time a truck was brought to the maintenance workshop, a sample of engine oil was extracted at half of the oil deposit (crankcase) for all the trucks in two ways:
by ensuring that the oil was still hot, i.e., when it is supposed that all the elements present in the oil were still mixed,
when the oil was cold, i.e., when it is expected that the heavy elements have already fallen to the bottom, so that they were no longer mixed.
So, using these methods, 2 or 3 sets of each, “cold” and “hot”, engine oils were taken from every truck. Again, it is important to highlight and to keep in mind that during their maintenance, the trucks were lubricated with the two types of diesel engine oils 10WV and 15WV mentioned above in different periods of time. Also, the “used” samples were labeled as: Truck X where X is the vehicle number (from 1 to 5).
The XRF measurements were carried out by a benchtop XRF spectrometer -PANalytical MiniPal2 equipped with low power, Rh anode X-ray tube, and a Si-PIN semiconductor detector. All measurements were performed at least twice in order to obtain more accurate results and obtain the error bars. The conditions for the XRF experiments were the following:
The ones by means of the “standard-less method” with open filter, under helium, at 10 kV, 3 µA and during 120 seconds. It is important to say here that the standard-less method was applied only for the “hot” samples i.e., for the samples that were taken when the oil was still hot.
The ones by means of the “calibrated method” with open filter, under helium, during 140 seconds for each sample and i) with 10 kV and 20 mA for the heavy elements, and ii) with 6 kV and 60 mA for the light elements.
For the calibrated methods, seven samples were prepared from a “highly contaminated” engine oil (this term will be explained later), and measured by means of atomic absorption spectroscopy (AAS), and thus, obtaining accurate data for the calibration of the XRF equipment. A brief description of the preparation of the seven samples for the AAS technique is given next:
in order to have a mixture of the components of the “clean oils” (both 10WV and 15WV) within the “contaminated” oil, the set of seven samples were prepared by using equal contributions of 10WV and 15WV in different percentages of them, mixed up with the contaminated oil.
The clean oils amounts vary from 80% in sample S1 to 20% in sample S7 in steps of 10%. This means that sample S1 is made of 40% of 10WV + 40% of 15WV + 20% of contaminated oil, and sample S7 has 10% of 10WV + 10% of 15WV + 80% of contaminated oil.
These seven samples were then measured by means of the atomic absorption spectroscopy (AAS). Unfortunately, due to technical limitations, the AAS measurements were performed only for the Al, Co, Cr, Ni, Si and Fe elements. The later XRF measurements (i.e. the ones by means of the calibrated method) were, therefore, only limited to these elements in order to follow exactly the results obtained by the AAS technique. However, as it will be shown in the following section, these chosen/measured elements come mainly from the wear of the motor and not from other components such as additives [8], [15], so that this ensures that the obtained results by the XRF technique will accomplish their main purpose which is to help with the predictive maintenance of the trucks (in case of by XRF, any of the elements results in a high content).
3. Results and discussion
Table 1 summarizes the elements that, according to literature ([1]-[3], [8], [12], [13], [15], [16]), and experienced engineers, might come either from the engine wear (EW), from external contamination (EC), and/or from the additives (Add). The table is also presented essentially as “guidelines” because that information is not easy to be obtained in any specific book.
The upper part of the table contains the typical element limits for Diesel engine oil. These values are used as guidelines for the interpretation of the XRF results, and are classified as moderate or critical. Obviously, no maintenance action is required for moderate levels, and any value higher than the critical range requires immediate action.
It must be remarked here that there are not limit values for the elements coming from the additives because, as said before, supplying additives depends on the necessities of each engine and the fundamental application for which the engine is intended. However, an oil for diesel engines such as the ones with technical specifications given by API CI-4 (to which the SAE 15W-40 belongs), will have about 3300 ppm of detergent/dispersant.
3.1. The standard-less method
Figures 1 to 5 show the XRF results and the resulting elemental composition (in percentage) for all the trucks. In these results, no traces of Al have been found (so, they are not reported here). Column charts are made with the purpose of having a visual indication of any existing trend for each element (with the vehicles utilization). As a reference, all the figures also display the obtained values for the two (unused) commercial diesel engine oils.
Figure 1 Resulting elements for the hot samples from Truck 1 as obtained by XRF via the standard-less method. The values indicated in the table below the figure are given in %
Figure 2 Resulting elements for the hot samples from Truck 2 as obtained by XRF via the standard-less method. The values indicated in the table below the figure are given in %
Figure 3 Resulting elements for the hot samples from Truck 3 as obtained by XRF via the standard-less method. The values indicated in the table below the figure are given in %
Table 1 List of detectable elements in engine oils. Sources: references [1]-[3], [8], [12], [13], [15], [16]
a To convert from ppm to percent, the given ppm value should be divided by 10,000. Thus, x(%) = x(ppm)/10, 000.
Two main conclusions can be extracted from these figures/results:
several of the elements that come from the engine wear have been detected (see Table 1]. However, all of them have also been detected in the two (unused) commercial diesel engine oils, except the Cr in the 10WV, and Mg in the 15WV, which were not detected in any of the two samples. One possible explanation for these detections is that in the standard-less method, there might be superposition of energy peaks, and the elements represented in the spectrum do not actually correspond to the real elements present in the sample.
even if they are low values in content, in general, the resulting values are still extremely high if compared with the values shown in Table 1 (notice that the values listed in the table are in ppm). So, the results obtained by the standard-less method would suggest an immediate action for all the trucks.
Thus, since one of the main objectives of this study is to evaluate the applicability of the XRF methods, these results suggest that, although the XRF technique is able to detect any trace/presence of all possible elements, and with a high sensitivity, the standard-less method is not the most appropriate for measuring this kind of samples. This is because within the technique, the energies can be mixed up and the detected Kα lines could be actually Lα lines from other elements. For clarification, and also with the purpose of collecting the information in one specific place, the following lines are dedicated to give a brief description for each of the “obtained” oil elements in order to interpret the results in case these elements were indeed present in the oil.
First of all, it is obvious from the results that Zn is the element with the highest concentration in the measured samples. As shown in the elements of Table 1, Zn is coming from oil additives, from which the main candidate is the zinc dialkyldithiophosphate (ZDDP). It is widely used in lubricating engine oils playing a role as both, an antioxidant and an anti-wear additive (and multipurpose in general) which acts as a film to surround metal parts, helping to keep them separated [3], [17]. The obtained Zn values are therefore, harmless to the engine.
Magnesium is commonly used in engine oils as magnesium sulfonates and it is related to the detergent additive packages mentioned above [1]. It provides some alkalinity to help neutralize acids formed from diesel fuel combustion. Some manufacturers reportedly prefer its use because they feel it improves rust production. Regarding the results of the specific measured samples, the obtained traces of Mg will not damage the engine. Also, as said before, this element was not detected in the commercial engine oil 15WV.
Silicon is used in many oil types as an antifoaming additive. However, silicon could come from a variety of sources such as silicon sealant, steel metal alloy, foundry dust, common dirt, fly ash, coolant additive, etc. Considering this, it is very important to know these sources in order to conclude why/how the silicon is present in the oil and to take future actions to remove the silicon if necessary [18].
It is indispensable to consider that silicon is the second-most abundant element on the planet after oxygen. However, as such, it is not found naturally in elemental form but rather combined with oxygen in a compound called silicon dioxide (SiO2) (or silica). Silica occurs in a free form (quartz, sand, etc.) or combined with a variety of metallic oxides, in which case it is called a silicate (e.g., Felspar). Silicone is another class of silicon compounds that should not be confused with silica and silicates. Silicones are man-made organic compounds that find extensive application in the polish, paint, and lubrication industries [19].
Silica and silicates make up a large proportion of the earth’s crust and as such are present at high concentrations in natural soils and dusts. It is for this reason that silicon is used as the main indicator of dust entry into a component [19].
Figure 4 Resulting elements for the hot samples from Truck 4 as obtained by XRF via the standard-less method. The values indicated in the table below the figure are given in %
Since the content of Si increases in the samples taken from the Trucks 3 to 5, it is assumed that its presence is due to atmospheric dust (Silica). In Trucks 1 and 2, the value decreases, even when compared with the the two (unused) commercial diesel engine oils (although this element, should not have been detected in the commercial ones). This decrease is probably due to a change of the air and fuel filters when the truck was brought in for maintenance.
A low amount of the sulfur element can also be detected in the samples. This is because the additive ZDDP, which was mentioned before and is used almost universally in engine oils, contains four atoms of sulfur, two of phosphorus and one of zinc (which can form ash) [20]. In addition, sulfur is used in many extreme pressure (EP) oils as an EP additive. When there are elevated temperatures, such as those experienced by the engine due to the amount of work (RPM), the sulfur reacts forming a sulfide layer. Extreme pressure agents bond to metal surfaces, keeping them from touching even at high pressure. However, sulfur content is critical for oil manufacturers due to the later atmospheric contamination. Thus, its amount as additive depends on the necessities of each engine.
Tin (Sn) is the only element that presents the most notorious changes among the samples. In all the cases there is a small increase with the vehicles utilization, except for Truck 2 where it decreases. This last case is probably due to the change of the air and fuel filters mentioned above. From the results, notice that the two (unused) commercial diesel engine oils already have similar Sn values (at least for the “clean” 15WV sample) so, the Sn might not really be in the samples, but it is an effect of applying an erroneous measurement method. In any case, Sn is usually found in bearings (Pb-Sn, Cu-Sn, Al-Sn), brass or bronze bushings, flashing from pistons and lubricant lines. Tin associated with lead and copper in engines indicates bearing wear [15], [16].
Figure 5 Resulting elements for the hot samples from Truck 5 as obtained by XRF via the standard-less method. The values indicated in the table below the figure are given in %
Analyzing the obtained values for the remaining four elements Fe, Ni, Cu and Cr, the measured samples (from Trucks 1 to 5) have about the “same” elemental content if compared with the content of the (unused) commercial diesel engine oils. Since these elements come only from the wear of the engine, these values should not have been detected in the unused engine oils. Thus, again, these results might be due to the superposition of energy peaks, and they might not be the real elements present in the sample. Anyway, a brief explanation of the presence of each of the elements in the engine oil is also given next.
Because iron is the most used construction material, sources are often varied [16]. It mostly comes from cylinder liners, gears, crankshaft, camshaft, bearings, housings, rust, rings, valve train, oil pump gear, rods, wrist pins, and cast iron components [15], [16]. It is usually found as fine particles due to abrasion or wear.
Nickel is probably the most common metal found in engines, gear systems, hydraulic systems, and transmissions. It comes from roller bearings, camshaft and followers, thrust washers, valve stems, valve guides, alloy valves, crankshafts, bearings, and shafts [15], [16].
Copper is a soft metal present in gears, main and rod bearings, thrust washers, oil cooler cores, clutch plates, brass and bronze bushes, and roller bearing outer cage. In engines, its presence should be due to internal coolant leaks (as the water pump leak) or coolant core. If copper is found along with potassium, sodium and glycol, it will be coming from the oil cooler, but if it is found along with lead and tin, it will be coming from bearing or bushing [15], [16].
The presence of chromium indicates something harder is present usually silica and alumina. It is a hard metal generated from roller bearings, piston rings, shaft plating, shafts, rods, gears, needle bearings, liners, exhaust valves and stainless steel alloys. As said before, Cr has not been detected in the “unused” 10WV sample.
3.2. Atomic absorption measurements
In order to carry out the “calibrated methods” for XRF, obviously, it is necessary to calibrate the equipment with samples with a high degree of certainty on their elemental composition. For doing this, AAS results were used for the calibration of the XRF equipment.
The samples for AAS, explained in the experimental section, were obtained by using an engine oil which, in principle, is expected to have higher values of engine wear elements, or better called here as “highly contaminated” engine oil. Thus, an engine oil sample was extracted from a vehicle which had more than 200,000 km and which did not comply with the periodical maintenance, as established by the factory (in this way, it is expected that the engine oil would have a bigger amount of contaminant elements).
It should be highlighted here that all vehicles in this study were brought to the maintenance workshop as expected by the manufacturer but this one used for the AAS measurements was not. AAS results are listed in Table 2.
For readers who are not familiar with the XRF technique, it is important to say that these resulting calibration values are directly entered to the XRF machine, so there is no need to show a calibration curve here.
Figure 6 Resulting elements for the hot samples from Truck 1 as obtained by XRF via the calibrated method. The values indicated in the table below the figure are given in ppm
3.3 Thecalibrated method for themeasurements of the “hot samples”
As in the previous case, the Figures 6 to 10 display the XRF results for the hot samples of the 5 trucks by means of the “calibrated method”. In these figures, their resulting elemental compositions are shown in parts per million (ppm).
From the results, it is clear that there is a big difference when compared with the standard-less results shown before. Since these results are comparable with the ones of the AAS technique, they are more reliable, and therefore, it can be concluded that using the calibrated method is not only more accurate but also necessary. Also, from these results, it is important to highlight that in the case of the trucks selected here, all the elements are found to be at a moderate level (see Table 1], so no action is required for any of the trucks.
As expected, by performing the calibrated method, none of the 6 elements shown in Table 2 were found in the two (unused) commercial diesel engine oils (so, they are not shown) because these elements are coming from the engine wear or, as in the case of Si, also from external contamination.
In these results, in addition, the only one of the obtained elements that was not mentioned/described before is the aluminum. It generally comes from pistons, engine block, turbo bearings, main and rod bearings, pumps, thrust bearings and washers, plates and aluminum castings [15], [16].
In Figure 6, it is clear that when the kilometers increase, there is a slight increase in all the elements except for aluminum and silicon. The increase is most probably because the air and fuel filters were not changed (- it is changed at the maintenance workshop every 10,000 km -), which produces more contamination of elements and therefore an increase of them. The Al and Si have reduced their values probably because the oil has been changed.
The result, especially for the Al, might be experimental since it drops completely to 0,0.
In Figure 7, there are several changes of the elements for higher mileage. For example Cu, Cr, Ni, and Fe have a tendency to decrease from the first sample (104,750 km) to the second one (110,068 km). This might be due to the change of the oil (from 10WV to 15WV) at that point. As said before, this was a decision taken by the maintenance workshop. In this case, however, the Si and Al have also increased with the increase of the kilometers, but they are still within the moderate level. Then, most of the measured elements decrease again from the second sample to the third one (115,111 km), but this time, this was probably because the air and fuel filters were changed. This confirms the necessity of changing the oil and the air and fuel filters more frequently. It is also important to highlight the sensitivity of the technique with any change, which is ideal.
In the results obtained in Truck 3 [Figure 8], the trace of elements also increase in the first two samples (147,654 km and 152,064 km, respectively) except for the Cu (which is almost the same value) and the Ni, which decreases a minimum amount. It is normal to have a slight increase or decrease of the elements. There is nothing unusual in these samples even when these first two samples were lubricated with the 10WV oil, while the sample with 157,430 km was lubricated with the 15WV oil. This change is the most probable reason why the traces of Cr and Fe have decreased. In this case, however, atmospheric dust might have been the reason for the small increase of Si.
In Figure 9, all the elements are present in a very low amount. Since the values remain almost constant, here the attention is paid to the Al and Si in the first two samples (94,528 km and 100,605 km, respectively).
Figure 8 Resulting elements for the hot samples from Truck 3 as obtained by XRF via the calibrated method. The values indicated in the table below the figure are given in ppm
Figure 9 Resulting elements for the hot samples from Truck 4 as obtained by XRF via the calibrated method. The values indicated in the table below the figure are given in ppm
Considering the low amounts detected, there are noticeable changes in these two elements. The increase of the Al might be due to any of the parts described before and the Si from the atmospheric dust. However, these values (including the Fe) decrease again in the third sample, 104,745 km, when the oil and the air and fuel filters were changed.
Finally, when looking at the results obtained for Truck 5 in Figure 10, it is clear that there is not a considerable variation among data, and the values remain at a moderate level.
3.4. The calibrated method for the measurements of the “cold samples”
Figures 11 to 15 display the XRF results by means of the calibrated method for the cold samples and their resulting elemental composition. In this case, the results are also shown in parts per million (ppm).
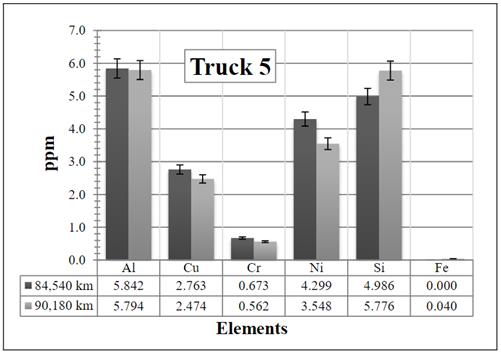
Figure 10 Resulting elements for the hot samples from Truck 5 as obtained by XRF via the calibrated method. The values indicated in the table below the figure are given in ppm
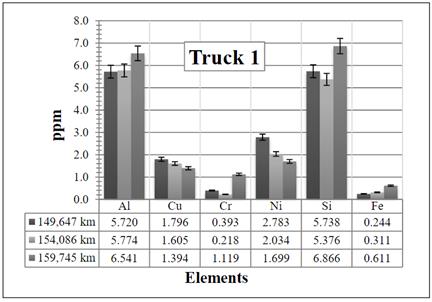
Figure 11 Resulting elements for the cold samples from Truck 1 as obtained by XRF via the calibrated method. The values indicated in the table below the figure are given in ppm
As it was previously expected, as a general rule in these results, it is obvious that there is a decrease in all the elements present if they are compared with the results of the calibrated method for the “hot samples” [Figures 6 to 10]. This is because when the cold samples are taken, the heavy elements are stored at the bottom of the crankcase, causing a decrease of these elements in the sample. This method is therefore, not ideal (since cold samples might lead to wrong results) and it is recommended to take the samples when they are hot.
In any case, a brief description of the behavior of the elements, according to the results, is given next.
Figure 12 Resulting elements for the cold samples from Truck 2 as obtained by XRF via the calibrated method. The values indicated in the table below the figure are given in ppm
In Figure 11, it is clear that the sample 159,745 km has a value for the Al, whereas in the “hot case” [Figure 6], the same sample did not show any Al traces. However, as said before, this result could be only experimental. The remaining elements are resulted in low traces and remain at a moderate level.
In Figure 12, notice that both, the Al and the Si are zero for the sample 149,647 km. This result could be experimental (i.e. only present in this particular sample). However, the sample was measured twice to corroborate any possible mistake, but the same result was obtained again. The most logical explanation for this is that the elements went to the bottom of the crankcase. Also supported by the fact that the same vehicle gave values when the oil was hot (mixed).
In Figure 13, the elements are also constant, except for the Al, which is zero in all the used samples. Again it might have gone to the bottom of the crankcase.
Figure 14 shows minimal changes, especially for the decrease of the elements Al, Cu, Ni, and Si when comparing the samples 100,605 km and 104,745 km. It is assumed that the changes occur because the first of these two samples was prepared with the 10WV oil and the second one with the 15WV oil.
Figure 15 also shows a decrease especially in Al and Si. Again, these elements might have gone to the bottom of the crankcase.
4. Conclusions
For the first time, in this study, it has been possible to perform an analysis, by using the two methods of the X-ray fluorescence technique in used engines oils of 2.5-liter engine pick-up trucks: the standard-less and the calibrated one.
Figure 13 Resulting elements for the cold samples from Truck 3 as obtained by XRF via the calibrated method. The values indicated in the table below the figure are given in ppm
Figure 14 Resulting elements for the cold samples from Truck 4 as obtained by XRF via the calibrated method. The values indicated in the table below the figure are given in ppm
Figure 15 Resulting elements for the cold samples from Truck 5 as obtained by XRF via the calibrated method. The values indicated in the table below the figure are given in ppm
If the analysis of engine oil samples, as the ones presented in this paper, are to be performed by means of the XRF technique, it is recommended to use only the “calibrated” method, since the nature of the method is in a more controlled way.
When comparing the results for hot and cold samples, it has been proven that in the cold samples, the heavy elements are stored at the bottom of the crankcase (as expected) and therefore, causing a decrease of the elements. Thus, it is recommended to collect the samples when they are still hot because of cold samples might lead to wrong results.
Any trace of the elements found in the engine oil samples coming either from the detergents/additives (added by the manufacturer to the engine’s lubricating oil), external contaminants (such as dust) and/or from the engine wear can be detected with the XRF technique. However, in future experiments, in order to obtain data with higher precision, the XRF technique with calibration curves should be used for the detection of these heavy metals generated by the engine wear.
From the XRF results, all the elements are found to be at a moderate level, so no action is required for any of the trucks.
The results also suggest that the change of the air and fuel filters, and also the change of the engine oil, when the truck is brought in for maintenance, causes a decrease in the majority of the elements found in the engine oils. To avoid corrosion or higher content of the elements, this could be an important factor to take into account for the predictive maintenance of the trucks. It is therefore, recommended to change them on a more frequent basis.
It is also important to mention here that the use of the two different diesel engine oils did not generate damage to the engine (or any wear) though the XRF technique detected such an oil change.

