Inglés (pdf)
 Articulo en XML
 Referencias del artículo
 Enviar articulo por email
 Citado por SciELO
  Citado por Google
  Similares en
SciELO
Similares en
SciELO  Similares en Google
 Permalink
1. Introduction
The global contribution of buildings to energy use, both residential and commercial, has gradually risen in developing countries, exceeding figures between 20 % and 40%, and has surpassed other primary industries: manufacturing and transport industries. Development in the population, growing demand for housing facilities and comfort levels, and increasing time spent within houses would ensure that the upward rise in energy demand persists in the future [1]. Residential and industrial consumption of energy is increasing at an annual rate of 0.4 % to 0.5 % per annum from 2018 to 2050 [2], according to the US EIA (Energy Information Administration) evaluation. The use of renewable energies would also be an indicator of a viable future for energy development in houses. In the urban area, small or micro-wind turbines have lately gained more interest. There are some benefits of integrating wind turbines into buildings. The electricity generated by the wind turbine can be fed directly into the building's electrical circuits, which could minimize the expense of linking the distribution network to the local grid and eliminate losses in energy transport. Several efforts have been made to make a structured grouping of wind turbines coordinated, but this provides a slight advantage as their practical utility drastically reduces the number of basic designs. Wind turbines are classified based on their aerodynamic functions, followed by the turbine's configuration and construction. The aerodynamic function of the rotor is defined by whether the wind turbine derives its power primarily from the rotor-acting air stream's aerodynamic drag or whether it is capable of capturing the aerodynamic lift produced by the flow across streamlined bodies. In particular, several attempts have been made in Germany, the US, and the UK to grow and refine this form to commercial maturity. Musgrove (British Engineer) suggested straight blades as H-rotors with variable rotor geometry to control the strength and turbine RPM. However, the cost of this principle is still high as compared with horizontal-axis rotors. The Darrieus H-rotor turbine [3] was developed by a German manufacturer and had features such as a basic structure and a generator, which are directly built into the rotor without using a gearbox.
VAWTs, particularly the Darrieus lift-type rotors, appear to be the most suitable turbines in the building environment because of their unique properties, independent of wind direction, low noise, and vibration intensity. Some studies have shown that in skewed flow and horizontal wind turbines, H-Darrieus produces higher power output but suffers from a decrease in power [4].
2. Turbine description
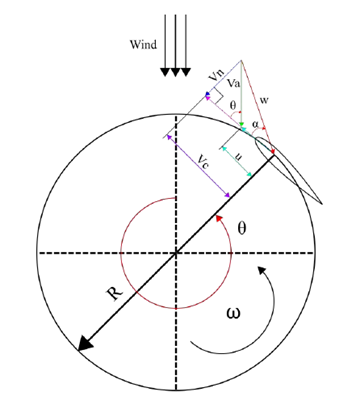
The wind flow flows over the turbine blades composed of an airfoil cross-section profile to create beneficial torque and power. A relative velocityW is produced, as with any airfoil, due to a vector difference between absolute wind velocity Va and peripheral blade velocity u, as shown in Figure 1. The tip speed ratio (TSR) is a ratio of the tip blade velocity ωR to the freestream wind velocity, and this ratio
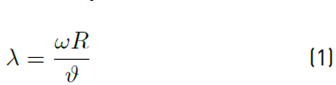
is defined as Equation (1).
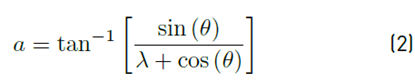
From the analysis of the velocity triangle [Figure 1], a relation between the attack angle α, the azimuth angle θ, and the tip speed ratio (TSR) λ was defined; this relation is given by Equation (2).
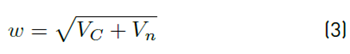
The relative flow velocityw can be obtained as Equation (3):
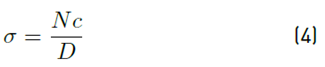
Where the chordal velocity component is represented by Vc and the normal velocity component is represented by Vn. The values of the angle of attack with the azimuth angle variance can be estimated from Equation (2), but the crucial factor for defining the geometry of the vertical axis wind turbine is the rotor solidity, which can be determined as Equation (4):
As shown in Equation (4), the solidity is a function of the number of blades N, chord length C of the airfoil, and the diameter D of the rotor.
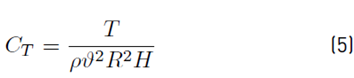
A Darrieus wind turbine performance is a function of several parameters, such as wind speed ϑ, mechanical output power P, mechanical torque T on the turbine axis, rotor radius R, fluid density ρ, and turbine height H. In this case, due to 2D analysis, H=1. Through combining these parameters, the torque and power coefficients equation can be obtained and written as follows Equation (5) and Equation (6):
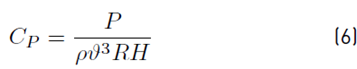
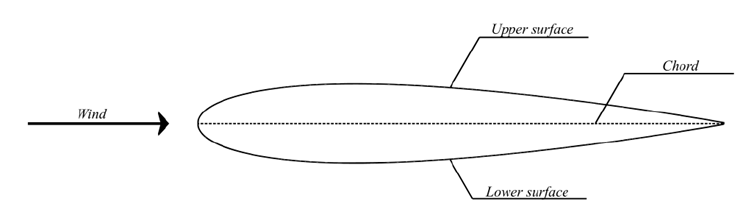
Where Cp and CT are the torque and power coefficients, respectively. NACA 0015 airfoil [5,6] is the airfoil being studied. The length of the airfoil’s chord is 250 mm, and the turbine radius and height are 1250 mm and 1000 mm, respectively. In Figure 2, the profile of the airfoil NACA 0015 can be seen. Researchers working on airfoil for VAWT applications have suggested three design variations which have been independently shown to optimize airfoil aerodynamics and thus increase the self-starting capacity. First, Hill et al. [7] Investigated the self-starting capacity of an H-rotor Darrieus turbine under steady wind conditions using wind tunnel experiments and numerical simulations. The study revealed that a turbine with a solidity of 0.33 would self-start at a uniform freestream velocity of 6 m/s. Second, Dominy et al. [8] developed a numerical simulation to determine the parameters that determine the self-starting capability of a Darrieus turbine. The results suggest that a lightly loaded three-bladed rotor always has the potential to self-start under steady fluid conditions. At the same time, the starting of a two-bladed device is dependent on its initial rotor position. The first modification on the airfoil is the Gurney flap, which is a vertical flap.
Gurney flaps have been shown to enhance the lift coefficients of the airfoil through experimental studies [9]. A Gurney flap with a height of 1.25 percent of the airfoil chord length (c) enhances the lift with just a slight improvement in the drag coefficient [9]. This phenomenon is explained in the NACA 0012 [10] airfoil study, which states that the Gurney flap increases the suction of the upper surface of the airfoil and the pressure on the lower surface, which, in effect, increases lift. Outward dimples on the airfoil’s upper surface, the second variation, will operate as a vortex generator to enhance the airfoil lift coefficient [11]. These dimples increase the flow turbulence and reduce the wake, thus minimizing the drag coefficient. They help increase the overall lift at a higher AOA (angle of attack). The combined aerodynamic effect has also been shown to influence the angle of the stall. The third modification is an investigation of the NACA-0015 airfoil with both the dimple and the Gurney flap on the inner surface of the tail edge to improve the airfoil’s dynamic performance [12]. The study showed an increase in the average tangential force of 35 percent in steady-state and 40 percent in the oscillating case (ateach revolution) using a combination of a Gurney flap and a semi-circular inward dimple.
In summary, the aforementioned studies provide a basis for the self-starting capacity of VAWTs and geometric modifications in the airfoil, allowing us to create a structured model wherein the turbine is designed by variables such as freestream velocity, solidity, and the number of blades. Furthermore, an opening in the lower part of the airfoil is designed to optimize the geometry of the airfoil and increase the self-starting capacity of the H-Darrieus turbine by reducing the negative C T presented in the dead zone. Quantitatively, this average C T value for the dead zone is expected to be greater than 0, if this value is greater than zero (which is already at a value greater than zero since the model was performed with the previously highlighted listed studies), indicates whether the turbine has an excellent self-starting capacity and increasing the Cp along with low TSR values.
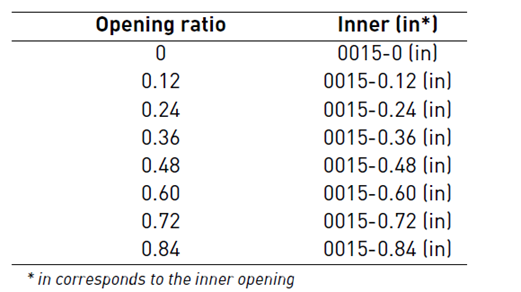
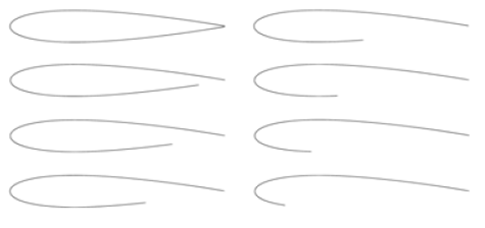
In this analysis, the mounting ratio was set to 0 (the chord length’s midpoint), defined as the ratio of the chord length’s leading point to its mounting point. The opening location and opening ratios are described in Figure 3. For the airfoil used, seven opening ratios of 0.12, 0.24, 0.36, 0.48, 0.60, 0.72, and 0.84 were investigated. The opening ratio corresponds to the ratio between the opening size and the chord length of the airfoil. The opening location corresponds to the opening position, where the opening position is on the lower (inner) surface of the NACA 0015 airfoil. Eight [8] unique opening ratios are shown in Figure 3, where the opening is situated on the inner side. Location and opening ratios without considering the shaft were tested at the same mounting ratio. Each case is given an abbreviation mentioned in Table 1 in order to discuss the simulation results. The Cp and C T of this rotor are simulated at 10 m/s wind speed applied on the inlet.
3. CFD strategy and validation
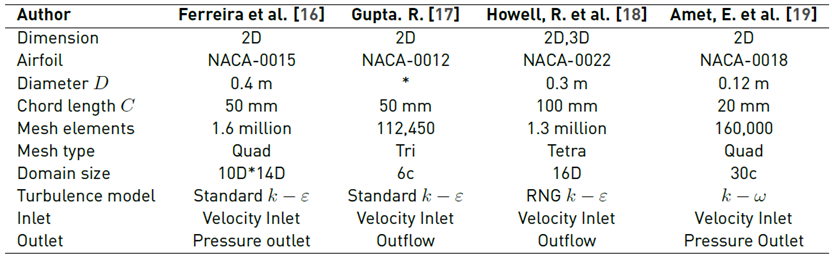
The Momentum, Vortex, and Cascade are the models widely used for the Cp calculation of the VAWTs. In 2008, Islam [13] listed the advantages and drawbacks of the three approaches. One of the essential tasks of these models is to build the aerodynamic airfoil database [14]. However, it is difficult to find reliable aerodynamic databases with a low Reynolds number range [15] and an entire range, particularly for opening NACA airfoils. Consequently, this new hybrid rotor’s performance estimation and examination were carried out using AOA equal to 0. CFD research on VAWTs has received much attention today due to the rapid growth of computational capabilities. Table 2 briefly summarizes the CFD simulations of VAWTs implemented by different authors. Most of them reach a consensus on CFD modeling conditions, including inlet, outlet, domain size, pressure-velocity algorithm, and others. Therefore, based on this summary, ANSYS FLUENT will be used as the solver applying the finite volume method to discretize the governing equations.
Zhang et al. [20] predicted drag and lift forces, pressure, and velocity field for a full-scale passenger vehicle with two independent front-end configurations using four RANS models. The models were the realizable k − ε, the AKN, the SST k − w, and the V2F [21]. They observed that the realizable k − ε was better than the other three RANS models for the base model. However, due to its reasonable accuracy, low cost of calculation, and rapid recovery time, the RANS model may still be the right choice for predicting drag values. Although the drag coefficient is not the most appropriate parameter for an in-depth study of this proposed model, the lift coefficient is one of the parameters that attracts attention to H-Darrieus turbines because this type of VAWT operates primarily through a lift, emphasizing that a higher lift coefficient translates into a higher power coefficient; however, this cost of lift results in the turbines decreasing in self-starting performance. Mohamed et al. [22], In their study of the performance improvement of the H-Darrieus rotor, defined k − ε as the turbulence model. In comparison, with the experimental study of Takahashi et al. [23], it was found that the approximate percentage error between the results of the power coefficient was 10.71%, giving reliability in the use of the realizable k − ε model for this study. The model is typically used for external flows with complex geometry.
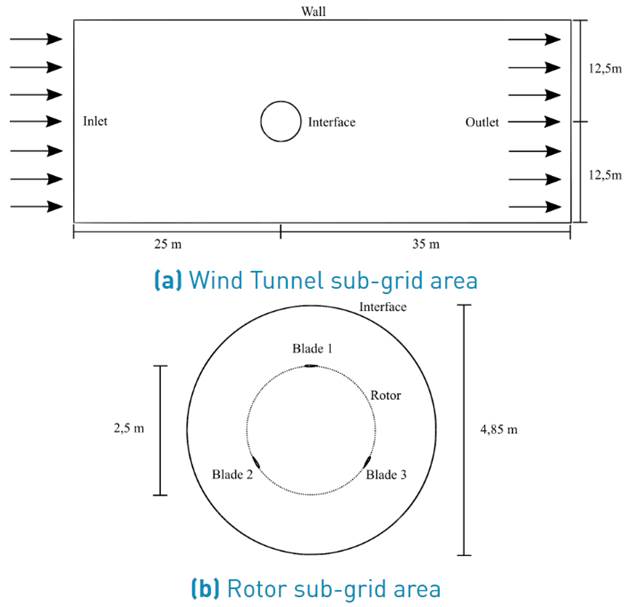
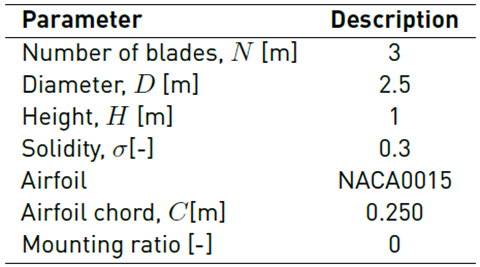
A rectangular flow domain with appropriate dimensions is introduced, the rotor radius is 1.25 m, and from the article posted by Raciti, C.M. et al. [15]. The inlet and outlet boundary conditions have been adjusted. Table 3 summarises the geometrical characteristics of the VAWT. The domain dimension in width and length, respectively, is between 10 and 20 times the turbine diameter [16]. Figure 4 displays the main dimensions of the control domain.
The sliding mesh method is used, and the selected grid type is the unstructured grid.
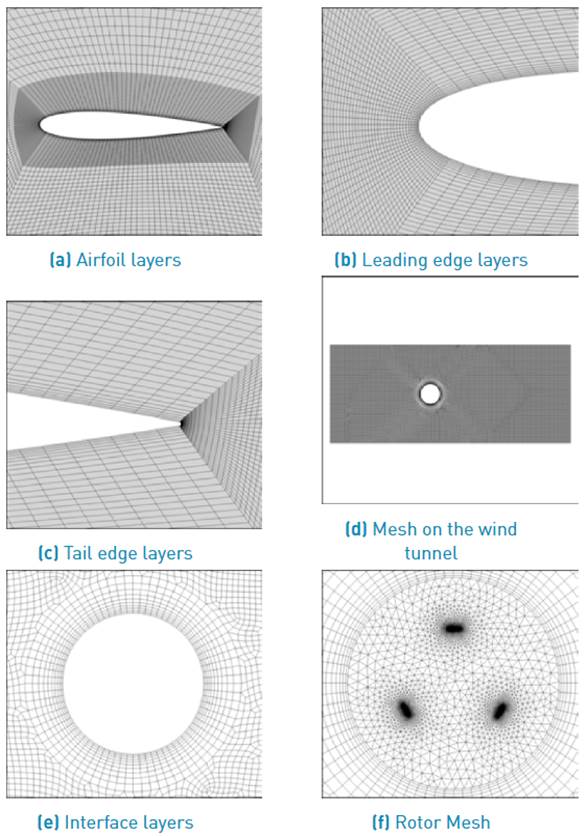
An unstructured grid consisting of triangular elements is adopted for both fixed and rotating flow domains. In the vicinity of wall borders, the unstructured grids are significantly increased to obtain a normalized wall distance. It is accomplished using 25 boundary layers with a growth rate of 1.2 for the open Darrieus turbine on all wall surfaces (e.g., the blades). Since the model uses NWT (Near-Wall Treatment) functions, specifically EWT (Enhanced Wall Treatment), a y + equal to 30 was defined to avoid conflicts when using NWT for y + numbers less than 30. To calculate the height of the first mesh cell off the wall required to achieve the desired y + using flat-plate boundary layer theory is given by the Equation [7]:
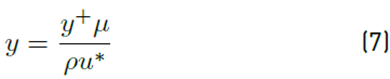
Where y + value indicates the wall spacing in (m), dynamic viscosity μ, fluid density ρ, and dimensionless velocity u∗.
The simulation is performed with constant inlet velocity (10 m/s) in all simulations and preserves constant. Both boundary streamlines (e.g., normal derivatives of dependent variables are zero) are subject to symmetry boundary conditions, as seen in Figure 4. The interface boundary condition is used on the circumference of the rotating zone to keep the continuity in the flow field. A non-slip moving is used for the blade surfaces. Figure 5 shows the mesh on the control domain Five different time-step sizes (10, 5, 2.5, 1, 0.5) have been studied by McLaren [24]. He found that, for the three smallest time-step sizes, the Cp ranges by just 1.5 percent; it is also found that the variation between five steps is not that substantial considering time-saving and reliability issues [24], so the analysis uses 2.5º per time step.
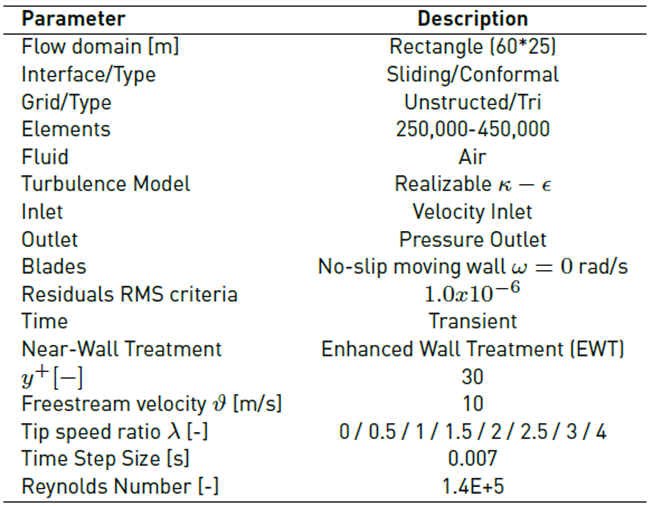
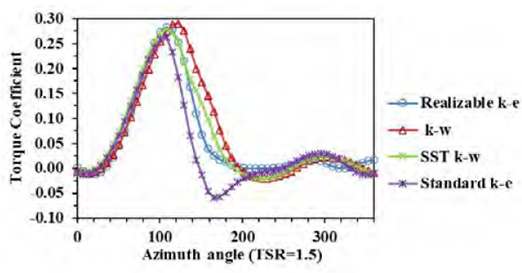
Convergence conditions were established to obtain a periodic variance of the torque coefficient and satisfy a maximum residual value of 1.0x10⁻⁶. Finally, the three-blade torque coefficient was controlled and reported to determine the maximum power coefficient of the Darrieus rotor. Table 4 summarises the grid and boundary conditions. The effect of four turbulence models has been investigated and compiled quantitatively. SST k - w model [25], k − w [26,27] realizable and standard k − w. Figure 6 shows the curves of the four turbulence models proposed. Realizable R was selected due to the model results compared to SST k − w and k − w does not exceed a relative error of 5%, giving reliability for this case. Also, the technique offers good convergence and is not memory-intensive. Based on the CFD strategies, this new case was modeled following the experiment performed by McLaren [24] (the model currently used) to validate the simulation results.
The comparison between the experimental and simulated results is presented in Figure 7. It is found that the simulation results are positively adapted to the experimental results. However, a remarkable divergence is found for the TSR point equal to 1.5. This divergence may be caused by the 2D [24] simplification of the 3D model or a possible underestimation of the drag force caused by the turbulence model setup. Despite this, the model has adapted once more when the TSR reaches a value of 2, indicating that the maximum value of Cp is the same as the experimental result.
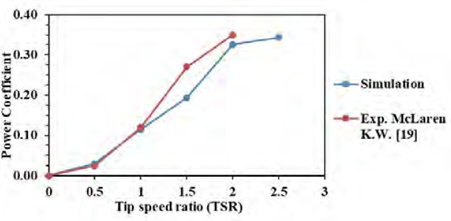
Additionally, the simulated model shows the same behavior contrasted with the experimental model. The conclusions obtained from this simulation also coincide with the study carried out by Ingham [28], who carried out a CFD mesh independence for the study of a Darrieus rotor. It is highlighted that one way to increase the accuracy of the simulation results is to preserve the conformity of the mesh by avoiding hanging nodes or by using tools provided by the software itself, in the case of ANSYS FLUENT highlighting the use of hanging node adaption because it provides the ability to operate the mesh with variety in the shape of the cell including hybrid meshes. Although this scheme presents excellent flexibility of the mesh, it requires additional memory to maintain the mesh hierarchy used by the rendering and mesh adaptation operations.
4. Simulation results
4.1 The impact of the opening on the C p as a TSR function
Figure 8 shows how the curves for the C p work quantitatively with the effect of the opening ratio as a function of TSR.
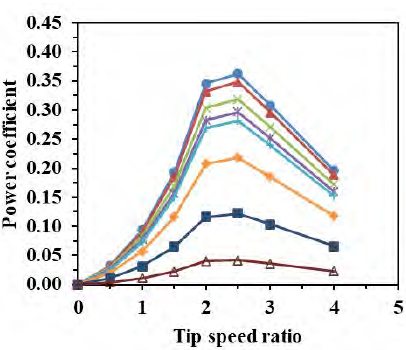
The new model rotor has a diminishing value of maximum C p as the opening ratio. One possible cause for these reductions is that with the change in the opening ratio, the distance of the trailing edge in the lower surface went forward, which increased the distance region within the airfoil. When the rotor opening ratio is more significant than 0.48, the C p LP exceeds 30 percent. However, if the opening is a successful option may depend on the overall measurement of more minor C p losses and a significant C T improvement.
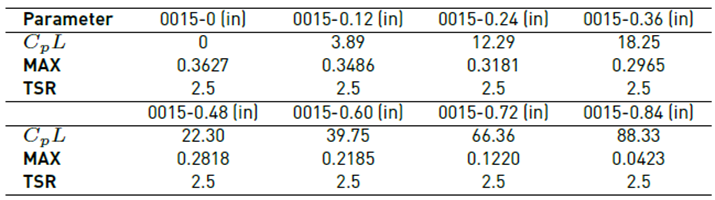
It is also essential to recognize that the power curves of the rotor with the opening are identical to each other while the TSR is less than 1.5. It is maybe because it is not possible to contrast the flow separation induced by the opening with the lower TSR dynamic stall. Nevertheless, the opening flow separation overrides the dynamic stall at high TSR. Another interesting finding in Table 5 is the TSR value of the maximum C p for all openings when it exceeds 2.5.
4.2 The effect of the opening on the ACT as a function of TSR
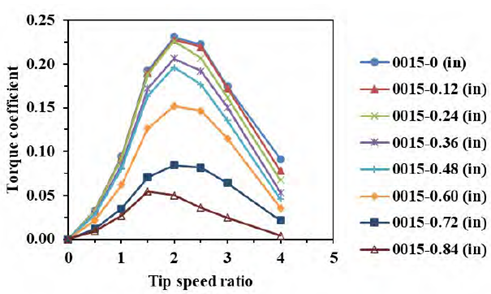
Figure 9 displays rotor curves with various opening ratios AC T (Average torque coefficient) opening ratios. The AC T variable structure is relatively similar to the C p . Notice that the rotors with an opening ratio less than 0.36 present similar C T at TSR equal to 1.5, which indicates improvement on C T of the new model. The average AC T value reduces as the opening ratio increases, unlike the TSR value of the maximum C p . However, for all rotors, the TSR value for a maximum AC T is stable, in this case being 2, except for a rotor with an opening ratio of 0.84. This shows that the opening ratio has a slight impact on the overall AC T TSR value. It is found that the higher opening ratio of the rotor does not indicate a higher AC T at low TSR. Higher AC T at low TSR will allow the rotor at low TSR range to pass a standard low solidity Darrieus rotor dead band. Nevertheless, there is no such dead band at a low TSR range for any rotor in this analysis due to the high solidity model.
4.3 The effect of the opening on the CT as a function of TSR
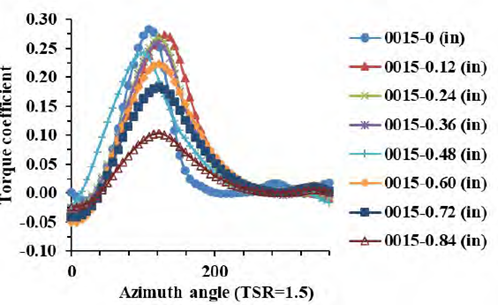
Figure 10 shows the No.1 blade variation in C T . The patterns of C T variability of eight opening ratios in the upwind region at a set TSR are reasonably similar to one another. The average C T of the eight rotors occurs at the same azimuth angle. It suggests that the opening has a slight impact on the location of maximum C T . This loss is near the maximum C T point in the region (45 azimuth angle).
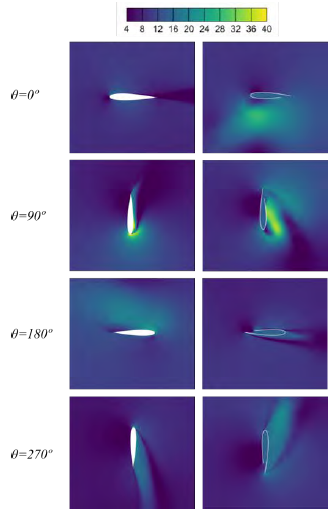
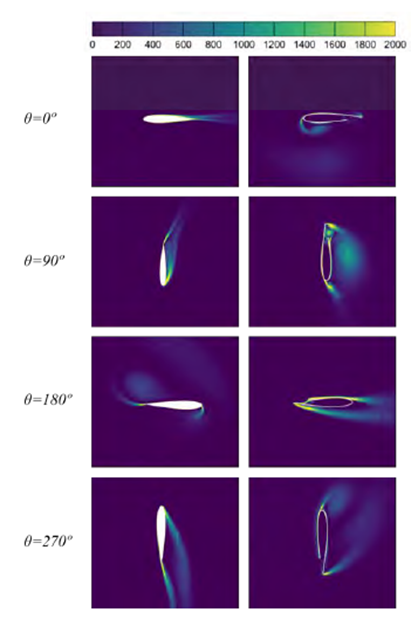
The C p and C T would decrease with the growth of the opening ratio. The opening has a reasonably significant adverse impact on C T in the upwind area. Although there is a positive effect on the C T in a particular part of the downwind zone, the beneficial impact on the downwind zone is substantially lower than in the upwind zone, thereby lowering the C T .Figure 11 shows the vorticity magnitude, and Figure 12 shows the velocity magnitude for a TSR of 1.5. It is observed that the velocity decrease in the leading-edge zone is much lower with the opening compared to the airfoil without opening. Because of the opening, the flow does not impact the blade uniformly, and it is also observed that the flow is dispersed in the upwind zone, creating a small vortex that is redirected towards the opening, causing the flow to enter inside the airfoil opening; as a result of this phenomenon, the airfoil loses some of its velocity and the torque coefficient decreases. This decrease in velocity is accentuated between 180- and 360-degrees azimuth because the airfoil is in the dead zone; however, the airfoil performs optimally between 90- and 180-degrees azimuth because the flow is more uniformly distributed, increasing its velocity.
5. Conclusions
The article aims to carry out a thorough analysis of the performance of a new Darrieus rotor type with different opening ratios located on the lower surface. Results have shown that C P LP increases with an increase in the opening ratio. The C P LP of the opening rotors ranges from 3.89% to 88.3%. While there is a positive effect on C T in some downwind zone areas, the positive effect in the downwind region is much smaller than the negative effect in the upwind zone. The positive effect in the ownwind zone is much smaller than the negative effect in the upwind zone. As a result, by increasing the pening, the C T is reduced. Based on the results, the rotors with 0.12 to 0.36 considering the C P LP, C T increase, and AC T increase are the desirable rotors for the opening located at the lower surface.