


 Inglês (pdf)
 Artigo em XML
 Referências do artigo
 Enviar este artigo por email
 Citado por SciELO
  Citado por Google
  Similares em
SciELO
Similares em
SciELO  Similares em Google
 Permalink
1. Introduction
The waters born in the Andes Mountain range are sources of natural aquifers, which reach the flat and low parts through infiltrations. Due to runoff, these waters are considered free of anthropogenic pollutants, and as they flow in the rivers, they carry the particulate material due to erosion, natural waste, domestic and industrial waste [1-2], modifying their physical, chemical, and microbiological characteristics, which could lead to a decrease in its quality and availability, increasing the health risk [3-5].
The surface water available in Peru is relatively abundant; however, it presents uneven spatial distribution, which makes its quality critical in some hydrographic regions [6]; thus, the water of the Chumbao River born in the micro-basin of the same name at 4600 m of altitude, in an area of low vegetation. It has as its main use to cover agricultural demands and, to a lesser extent, the populational and energetic needs [7-8]. This is the reason why the quality of the water is affected because of the expansion of domestic and agricultural activities, causing deterioration of the ecosystems surrounding the river [8], mainly in the districts of San Jerónimo, Andahuaylas and Talavera, which due to lack of adequate drainage and sewerage systems considerably increase the risk of contamination.
The quality of the water is relative to the use given and is related to some physical, chemical, and microbiological parameters, according to the regulations of each country [9]. Peru has Environmental Quality Standards for Water (ECA), which establishes maximum permitted values of substances and pollutants, differentiating the use of water [10].
There are methodologies for assessing and evaluating water quality, such as the water quality index (WQI) [11-14] and the water pollution index [15-16]. These indexes allow evaluating the degree of contamination present in a water body by grouping physical, chemical, and microbiological parameters reducing the information to a simple expression or a single value [15,17]. Knowing the pollution indexes allows determining the type of environmental problem and making an easy estimation due to the small number of variables involved.
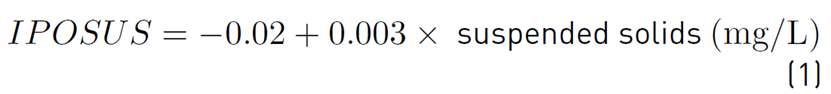
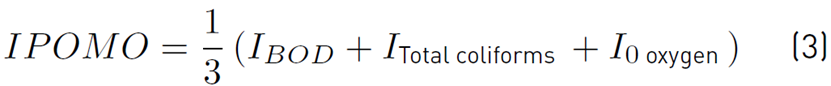
These pollution indexes are the IPOSUS (pollution index by suspended solids) which is an important indicator of the physical degradation of water and the presence of contaminants due to the concentration of suspended solids [18-20]; The IPOMI (Index of Pollution by Mineralization) groups hardness as a measure of calcium and magnesium ions, coming from the dissolution of rocks and minerals [21-22] , alkalinity reflecting carbonate and bicarbonate anions [23], and conductivity related to the amount of dissolved ions [24]; The IPOMO (Index of Pollution organic matter), represents the organic contamination of a water body, groups the biochemical oxygen demand, percentage of oxygen saturation and total coliform [25]; and the IPOTRO (Index of Trophic Pollution) which measures the total phosphorus concentration, and is an indicator of eutrophication [26].
Identifying in a fast way the water quality of a high Andean River along its path and its variation will allow immediate actions to be taken as a response to remedy these events. Thus, the objective of the research was to evaluate the spatial and temporal variation of the pollution indexes of the water of the high Andean micro-basin of the Chumbao River.
2. Materials and methods
2.1 Study area
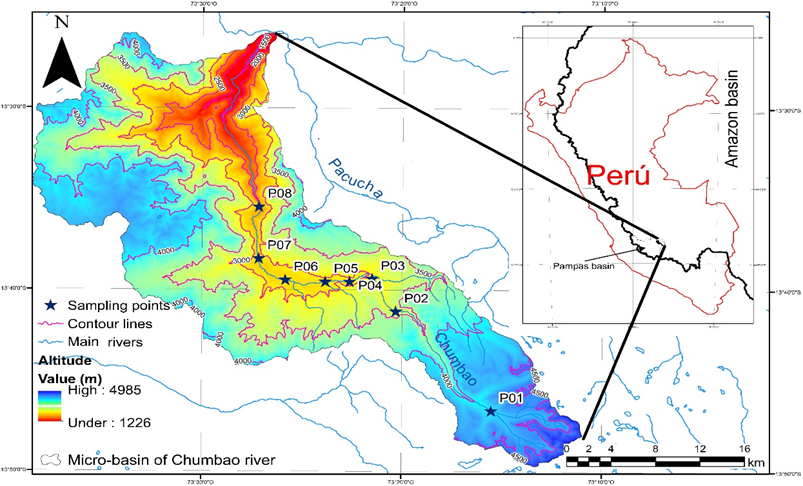
The study was carried out in the Chumbao River, geographically located in the southern highlands of Peru, Apurímac region, Andahuaylas province. Hydrographically, it belongs to the Pampas River basin, a tributary of the Apurímac River. The main tributaries are the Pampahuasi, Paccoccocha, Antaccocha, and Huachoccocha lagoons [Figure 1]. The area of influence presents intense rainfall between October and March (from 500 to 1,000 mm/year) and temperatures from 5 to 23 °C, and average relative humidity of 55%, with a Cwb climate according to Köppen climate classification.
2. 2 Sampling and analysis
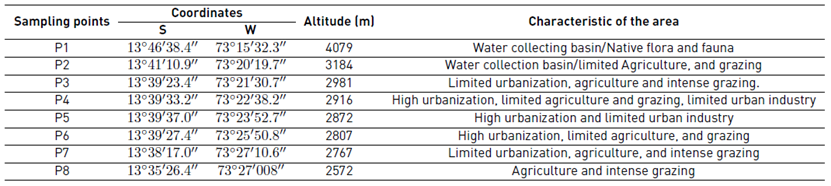
Point samples of water were taken from 8 points along the river, from the head of the basin (13° 46'38.4” S, 73° 15'32.3” W, and 4079 m of altitude), to the area known as Sotoccmachay (13 35'26.4” S, 73° 27'00.8” W, and 2572 m of altitude) (see Table 1], during the rainy and dry seasons.
The sampling was carried out according to the criteria established by the National Protocol for Monitoring the Quality of Surface Water Resources (ANA-Perú) [27].
Physical, chemical, and microbiological parameters of the water were determined in the field and laboratory according to the methodologies shown in Table 2; the analyses were carried out at the water control and analysis research laboratory of the José María Arguedas National University, Andahuaylas, Peru.
Table 2 Parameter Analysis Methods
| Parameter | Method | Reference |
|---|---|---|
| Physical | ||
| Conductivity | Electrometric | User manual. Multiparameter HI 9829 - Hanna |
| Suspended solids | Gravimetric/Stove | Method 2540-D [28]. |
| Chemical | ||
| Alkalinity | Spectrophotometric | User manual. IRIS model UV-Vis spectrophotometer - Hanna. |
| Hardness | Spectrophotometric with EDTA | User manual. IRIS model UV-Vis spectrophotometer - Hanna |
| Total phosphorus | Spectrophotometric | Method 4500-P E [28]. |
| Oxygen saturation | Electrometric | User manual. Multiparameter HI 9829 - Hanna |
| Biochemical demand oxygen | Respirometric | Method 5210 D [28]. |
| Microbiological | ||
| Total coliforms | Multiple tubes | Method 9221B-9221C [28]. |
2. 3 Determination of pollution index
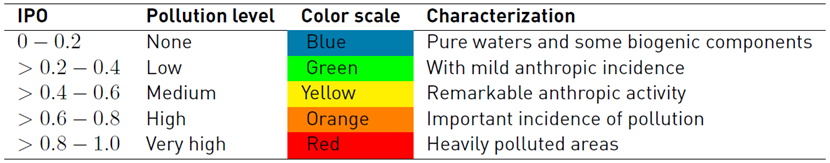
The IPOSUS, IPOMI, and IPOMO, were determined through Equation [1], [2], and [3] respectively [15], the evaluation of each contamination index was detailed in Table 3.

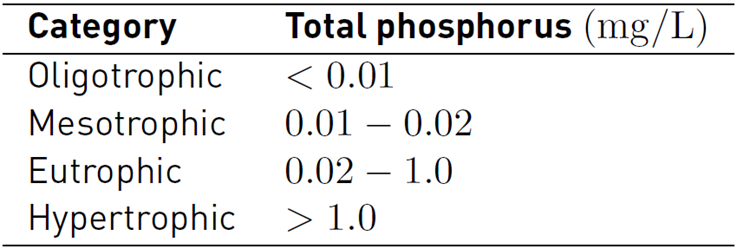
IPOTRO was determined by direct reading of the total phosphorus concentration, which defines a discrete category (see Table 4].
3. Results and discussion
Conductivity is an indicator that allows a first approximation that occurs in a water system due to different factors [29]; the water samples at the sampling points and seasons showed significant difference (p-value < 0.05), ranging from 29.33 to 305.67 µS/cm in the rainy season, and from 92.00 to 914.00 µS/cm in the dry season [Table 5]. It was observed that conductivity increases considerably as the downstream river flows in both seasons. In P1 (4079 m of altitude) in the rainy season, the conductivity was 29.33 µS/cm, which indicates a low presence of soluble ions; this value approximately tripled in the dry season (92.00 µS/cm). This must contribute to the low dissolution due to the absence of rain; it was observed that in the urban influence points from P4 to P7 at 2916 m of altitude, the conductivity increases considerably from one season to another, reaching approximately quadruple the conductivity; this is due to the high anthropic activity, whose wastes are directly thrown into the Chumbao River, such as household wastewater and waste from agricultural activities, granting higher quantity of soluble ions to the river water [30]; however, these values are below the ECA for river waters (< 1,000 µS/cm) (Category 4: Conservation of the aquatic environment) [10]. A similar behavior was observed by [31] in the Utcubamba river in Peru, and [32] in Wen-Rui River of eastern China.
Table 5 Conductivity and total suspended solids of the Chumbao River water
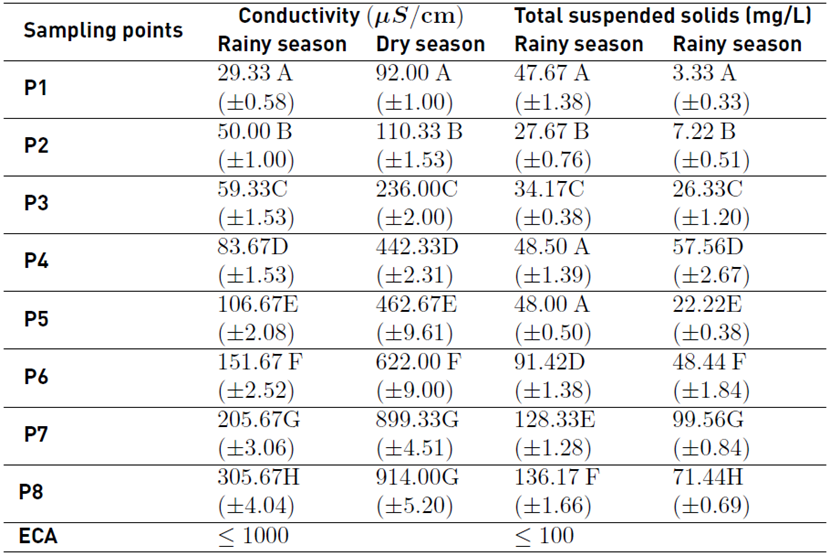
Mean (± standard deviation). Same letters indicate no significant difference at 5%
On the other hand, totals suspended solids reported in the rainy season ranged from 27.67 to 136.17 mg/L, and from 3.33 to 99.56 mg/L in the dry season, showing a significant difference (p-value < 0.05); all the sampling points of both seasons except for points P7 and P8 in the rainy season presented acceptable values according to the ECA [10]. It was also appreciated that the values reported in rains were higher than in the dry season; this is attributed to the slope of the river, which increases the surface runoff from the area adjacent to the river, transporting sediments such as clays, silt, organic and inorganic matter, making the water turbid [33], affecting the passage of light, and limiting the development of aquatic life [34].
Likewise, the suspended solids downstream, near the urban area (P3 to P7), were higher than in the headwaters for both seasons, mainly due to the extraction of aggregates (sand, gravel, stone), construction activities, alteration of the soil by crops, and deforestation, considerably increasing suspended particulate matter.
The hardness of the water of the Chumbao River reported a significant difference between sampling points and study seasons (p-value < 0.05). It was found that it ranged between 13.56 to 69.80 mg/L in the rainy season and in the dry season from 23.76 to 250.98 mg/L [Table 6], increasing downstream. However, in the dry season, higher values were reported due to the absence of rain, which increases the concentration of carbonates, which depend on the characteristics of each geological zone and soil type [22-35]]. High carbonate content was also observed in the points near the urban area (P3 to P7), because around points P2 and P3, non-metallic extractive mines are located, using river water for washing the extracted material, which returns to the river without any treatment.
Table 6 Chemical parameters of the water samples of the Chumbao River
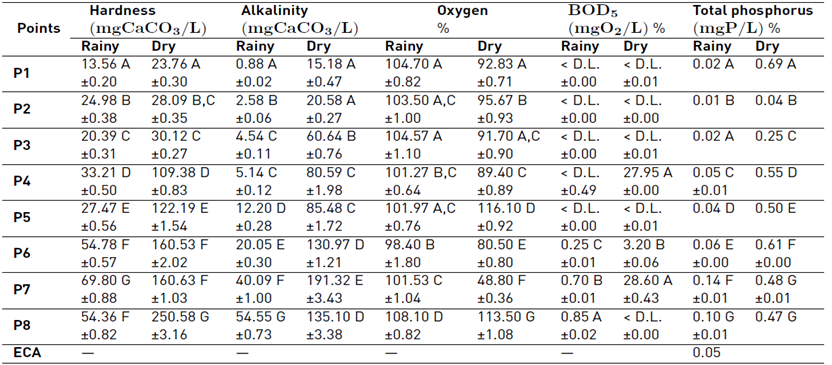
Mean (± standard deviation). Same letters indicate no significant difference at 5%. D.L. (detection limit)
As a result of the evaluation, the alkalinity ranged from 0.88 to 54.55 mg/L in the rainy season; and from 15.18 to 191.32 mg/L in the dry season (p-value < 0.05) [Table 6]; it was observed that this variable increases as the water flows downstream, being higher in the dry season. This fact is due to the high slope of the river (approximately 4%), which allows the fixation of CO2 in the water body; however, for P1 to P4 in the rainy season, low values were reported, making the water highly susceptible to acidification in this area [25-36], although this would be subject to the flow of the river.
In the case of the dissolved oxygen, it varied from 98.40 to 108.10% in the rainy season, and from 48.80 to 116.10% in the dry season (see Table 6]. Observing defined areas, from P3 to P5 in the rainy season, the DO decreases slightly, being this a zone of degradation and decomposition due to the presence of organic matter that comes mainly from domestic wastewater and solid waste [37]; this same behavior occurs in zones P3, P4, P6 and P7 in the dry season. In contrast, P8 in both seasons, a recovery zone is observed due to the absence of urbanization; however, the high levels of dissolved oxygen in the water of the Chumbao River are due to the geomorphology of its course [38-39].
In P1, P2 and P3, it is observed that the BOD is not detectable (< D.L.) [Table 6], since around these points there are no dwellings that can produce waste, there are low agricultural and livestock production, and little presence of vegetation, therefore a low presence of carbonaceous matter [40]. Regarding P4 and P5 (from 2916 to 2872 m of altitude), these points have a low populational density, but they develop intensive agricultural and livestock activities, using pesticides and herbicides without control [7], whose residues are transported to the river by runoff or irrigation of residual water, considerably affecting the microflora and microfauna of river water, which could inhibit the decomposition and degradation of the organic matter [41,42]; this same behavior occurs in P8 in the dry season.
On the other hand, the points from P6 to P8 showed low BOD values from 0.25 to 0.85 mg/L in the rainy season, while in the dry season the values reached up to 28.69 mg/L. These areas have a high populational density and in most cases the wastewater and solid waste are thrown off into the river, which favors the increase of BOD [40].
Regarding total phosphorus, it is observed that P1 in the rainy season reported 0.02 mg/L and in the dry season 0.69 mg/L; this considerable difference is due to the low flow of the river in the dry season. Similarly, migration of native birds and auquenids such as vicuña (Vicugna vicugna) are observed. These animals defecate on the banks of the Chumbao River and near the tributary lagoons. This fact increases the levels of phosphorus [43-44], but this decreases rapidly at P2 (0.04 mg/L).
Likewise, it was observed that the phosphorus level increases as the river water flows, exceeding the ECAs established for this parameter (0.05 mg/L) [9], as a result of the dissolution of rocks and phosphate minerals in the headwater and surrounding areas. These levels increase more in urban areas because wastewater is thrown into the river, which comes from homes, agricultural activity, and car washes, which use detergents, a similar behavior reported by [45] and [32].
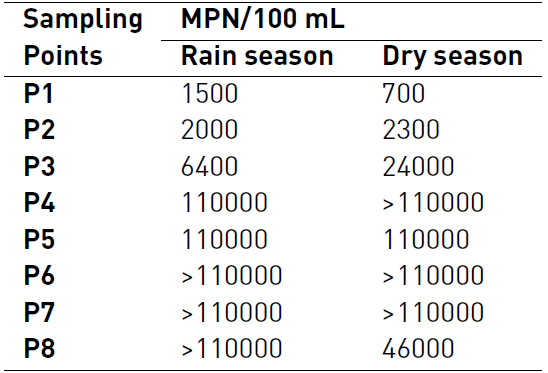
Table 7 shows the level of total coliforms at the sampling points; a considerable increase was observed from P3 in both seasons, indicating anthropic activity, mainly due to the presence of livestock stables near the banks of the river in P3 and P4; likewise, a considerable increase of 11x104 MPN/100 mL was observed from P4, largely due to the discharge of domestic wastewater, and animal slaughter beds, whose used water is discharged directly into the river without any treatment, increasing the microbial load mainly of thermotolerant coliforms [46,47].
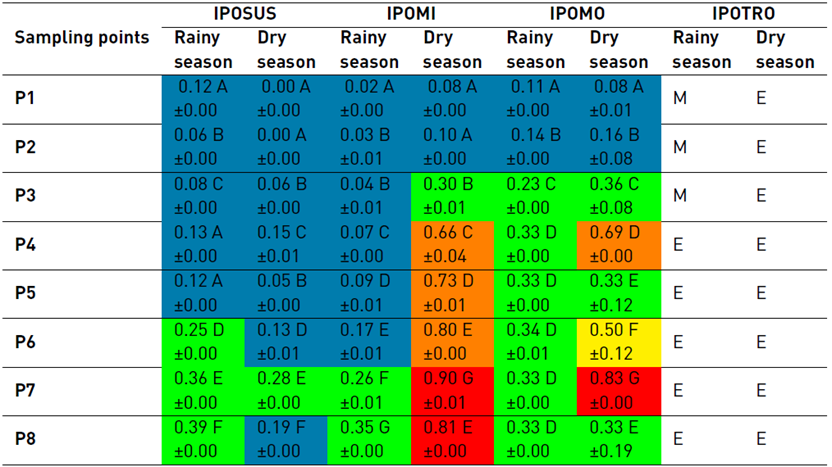
Regarding pollution indexes, the IPOSUS determination [Table 8], in the rainy season from P1 to P5, indicated "none pollution", while from P6 to P8 it showed "low pollution" by suspended solids; on the other hand, during the dry season, it was reported as "none pollution" at all points, except in P7, which indicated "low pollution"; this increase of "no pollution" to "low pollution", is mainly due to erosive and extractive processes [15,48], which occur near the banks of the Chumbao River; however, levels of "medium pollution" to more, would be related to health risk, because of the adherence of toxic substances and pathogenic bacteria to suspended solids.
Concerning the IPOMI, two evaluations were observed in the rainy season, "none pollution" from P1 to P6, and "low pollution" due to mineralization in P7 and P8, indicating low contamination due to the presence of ionized minerals. In contrast, in the dry season, four valuations of contamination by mineralization were observed, in P1 and P2 "none pollution" was reported, indicating pure waters and with low biogenic contributions, low in P3, that is, a slight anthropic incidence; "high pollution" "from P4 to P6; and "very high" in P7 and P8 indicating "excessive pollution" by mineralization mainly attributed to high conductivity values, followed by hardness and to a lesser extent by alkalinity, as mentioned by [49] and [34].
Table 8 Water pollution indexes of the Chumbao River
Mean (± standard deviation). Same letters indicate no significant difference at 5M, mesotrophic; E, eutrophic. D.L. (detection limit)
The determination of the IPOMO (see Table 8], in the rainy season, reported two valuations for pollution due to organic matter, P1 and P2 "none pollution", P3 to P8 showed "low pollution". In the dry season, P1 and P2 showed "none pollution"; P3, P5 and P8 "low pollution", P4 "high pollution", P6 "medium pollution", and P7 "very high pollution", the varied behavior in the dry season is related to the BOD level (see Table 6], those values were below the detection limit, and this would be due to the presence of pesticide and herbicide residues present in the water, which could cover the IPOMO values.
The contamination by nutrients evaluated through the IPOTRO evidenced that the water of the Chumbao River, in the rainy season, in P1, P2 and P3 reported a mesotrophic state, which indicates clear waters, with the presence of aquatic plants, with low levels of nutrients; in contrast from P4 to P8 in the rainy season, and from P1 to P8 in the dry season, the eutrophic state was reported, which indicates that the river water presents high levels of nutrients associated with the concentration of total phosphorus [44].
4. Conclusions
The water of the high Andean River of the Chumbao presented a longitudinal and seasonal variation of the pollution valuation, calculated through IPOSUS, IPOMI, IPOMO, and IPOTRO, reporting no pollution for the sampling points near the head of the basin, between 4100 and 2900 m of altitude; however, pollution appears when the river passes through populated areas, reaching valuations from low to very high pollution.

