


 Inglês (pdf)
 Artigo em XML
 Referências do artigo
 Enviar este artigo por email
 Citado por SciELO
  Citado por Google
  Similares em
SciELO
Similares em
SciELO  Similares em Google
 Permalink
1. Introduction
Cities are one of the highest energy consumers in many industrial and high-population countries, so much research is underway to promote the development of “Low Carbon Cities”. This concept has primarily focused on ways to reduce the impacts of current energy consumption in transportation and buildings [1]. Improved data about global energy consumption reveal systemic patterns and trends that can be useful for solving current energy issues. In this regard, looking at the worldwide European Union (EU) scenario, in the last decade, there was even a slow but continuous decrease of in energy consumption [2]. This is due to the EU’s rigorous policy regarding the reduction of energy consumption. This means that, in recent years, many governments are moving in the direction of sustainable development [3]. In this scenario, buildings bear a large responsibility as they account for about 40% of energy consumption and 36% of CO2-eq emissions in the EU. For this reason, it is fundamental to act on them to strongly reduce energy consumption and polluting emissions. In fact, by improving the energy efficiency of buildings, it is possible to reduce total EU energy consumption by 5-6% as well as CO2-eq emissions by about 5% [4]. Therefore, the mandatory improvement of the energy performance of existing buildings, as well as the high energy quality of new constructions, has been established by several European guidelines, Directives and Regulations. The European Union's 2010 Energy Performance of Buildings Directive (EPBD) recast[5] became a milestone in this respect, as it introduced for the first time the concept of 'nearly zero energy buildings' (nZEB), describing a desirable balance between renewable energy generation and energy consumption in buildings and urban districts. Inefficient building construction and equipment leads to an increased in GHG emissions, having a deep impact on climate change. A building’s operation is subject to several driving forces like climate, site and location, geometry, façade and fenestration, architectural design, internal loads, ventilation systems, heating and cooling equipment, and control units. During its 50-100 years lifespan, a building may change its operational requirements[6]. Therefore, it is necessary to develop analytical methods to model building performance under future scenarios in response to climate change.
Designs of high-energy performance using optimization techniques have had a significant diffusion in the last few years. Many studies have been performed to find out which are the best strategies to minimize building energy needs and many other objective functions like global costs, environmental impact, occupants’ discomfort [7]. There are different methodologies to quantify the building energy performance, which can be differentiated into three categories: statistical models, numerical models, and hybrid models [8]. The statistical models use mathematical correlations between the building’s constructive and operational properties and the environmental conditions to which they are subjected with their energy behavior. These approximations usually do not require physical information of the building and are fed by real data [9,10]. The numerical models use physical principles to characterize a building energetically through the knowledge of its constructive, operational, and functional characteristics [11]. These kinds of approaches solve a set of mathematical equations that describe the energetic behavior of the building [12,13]. The hybrid models use numerical models coupled with statistical models to characterize the energy behavior of buildings. This methodology solves a set of mathematical equations defined by numerical models using real databases as inlet information [14,15]. Asadi et al. [16] proposed an optimization technique that makes use of a genetic algorithm and artificial neural networks, with the aim of minimizing the retrofit cost, the energy consumption, and the thermal discomfort hours. Nguyen et al. [17] provided a more general but accurate explanation concerning the optimization process in building design. The “parametric simulation method” approach is very common to improve building energy performance. Using it, the designer must vary the input of each variable with the aim of highlighting the effect of the selected variable on the objective functions. The “simulation-based optimization” or “numerical optimization” approach is more robust; it performs sequences of progressively better approximations to a solution that satisfies an “optimality condition”, previously defined. This permits the attainment of the optimal solution to a problem [18] with lower computational time and effort. The simulation-based optimization of building performance is usually conducted automatically by means of the interconnection between a building simulation software and an optimization “engine”, which implements one or several optimization algorithms that need to be properly set [19]. A simplification of the building model to be optimized should be done, but it is crucial to not over simplify, to avoid the risk of inaccurate modeling of building phenomena. Regarding errors, it is fundamental to say that they may occur because of infeasible combinations of variables (e.g., windows areas that extend the boundary of a surface), output reading errors (as in the interconnection between GENOPT [20] and TRNSYS [21], etc. To minimize such errors, some authors run parametric simulations to make sure that there are no failed simulation runs before running the optimization [17]. Finally, it is important to verify if the solutions found are reliable and robust. There are no standard rules for this task, but the literature provides many strategies like the sensitivity analysis [22,23], the brute-force search method [24], or the comparison with different models [25].
The operation of a building management system has many uncertainties that produce strong deviations from the real situation: representative climatology [26], volumetry or operating characteristics [27]. The main objective of this article is to establish a relationship between the thermal loads of a free-running building with different construction parameters that define it, such as height, envelope properties or ratio of windows on the external façades. This work takes place under the Spanish research project SISGENER [28] that aims to develop a low-cost comprehensive energy management system. This system establishes, in an optimized way, the management of the energy generation and consumption that is carried out in buildings with centralized services, implementing new predictive techniques on simplified dynamic models [29], facilitating preventive maintenance tasks. One of its objectives is the development of simplified buildings models and energy systems with low computational cost to characterize their energy behavior. As the considered parameters are easy to obtain for any building, it is easy to extend the study to a district level, defining its building stock. The knowledge of the thermal load profile for one or a few reference buildings in a location makes it possible to estimate the overall needs of all the buildings in a district [30]. An estimation of the future demand allows optimizing the production and maximizing the use of renewable energies, reducing convectional energy consumption without losing comfort conditions, thus achieving an efficient production from an energy and economic point of view, complying with the principles that govern Smart Cities.
The optimized evaluation of a building management system requires an adequate characterization of heating and cooling loads. In this work, a numerical methodology has been used to estimate the thermal loads of a building according to different inputs. The knowledge of the physical balance is a key aspect to understand the sense of the constructive parameters influence. For this purpose, a sensitivity analysis has been carried out through a simulation environment that combines a dynamic simulation program with an optimization program. The interconnection between these tools gives numerous simulation batteries that consider different options of a free-running building with constant temperature set points. Subsequently, a comparison between the obtained thermal loads has been made to determine the influence of the analyzed variables. Sensitivity analysis is a valuable tool for both energy simulation models and observational studies in building energy analysis. Therefore, sensitivity analysis has been widely used to explore the characteristics of building thermal performance in various types of applications, such as building design [31,32], calibration of energy models [33,34], building retrofit [35], building stock [36], the impact of climate change on buildings [37]. Its methodology is the same in different types of applications in building energy analysis. Typical steps for implementing sensitivity analysis are: determining input variations, creating building energy models, running models, collecting simulation results, running sensitivity analysis, presenting sensitivity analysis results. The methods for sensitivity analysis applied in the domain of building analysis can be divided into local and global approaches [38]. Local sensitivity analysis is focused on the effects of uncertain inputs around a base case, whereas global sensitivity analysis is more interested in the influences of uncertain inputs over the whole input space [39]. Therefore, the global approach is regarded as a more reliable method. Its disadvantages are high computationally demanding compared to local sensitivity analysis. Both local [35,40,41] and global methods have been widely used in building performance analysis.
This paper expands on a presentation made at the ICSC CITIES 2020 conference [42]; it deepens the work by performing a more comprehensive sensitivity analysis that includes more relevant comparisons and representative buildings that provide a more realistic view, as well as a more in-depth statistical study that allows for a more quantitative understanding of the distribution of demands and their significance.
2. Methodology
Dynamic simulation programs are excellent tools to quantify the energy performance of multiple transitory systems such as conditioned buildings. These models consider the energy balances produced by external and internal fluctuations, solving the coupled and time-dependent equations based on its boundary conditions and input variables. The use of these tools allows the estimation of the building response when different variables are modified, assessing its influence on the annual energy loads [15]. In this framework, a simulation methodology has been proposed to estimate the energy response of generic buildings when different constructive conditions are applied. This method solves a set of coupled mathematical equations with a time step of 1 hour and without real measurements.
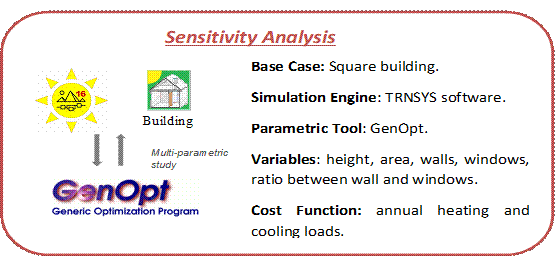
In order to study the influence of geometry and construction variables on the building thermal loads, a local sensitivity analysis has been performed. This study has been carried out coupling a dynamic simulation program (TRNSYS) [21] with a parameterization program (GenOpt) [20], as shown in Figure 1. This iterative process generates successive building models simulated with TRNSYS and automated with GenOpt, taking into account the limit ranges established for each studied variable. Three cost functions have been selected to assess the thermal performance of buildings: annual heating, cooling, and total loads.
2.1 Case study
The case study is a square floor plan building with a height between floors of 3 m, without internal gains (occupation, lighting, and equipment) that may be considered in a further study within the SISGENER project. Seasonal temperature setpoints have been fixed at 21ºC for heating and 26ºC for cooling, considered to be comfort realistic references, with 2ºC oscillation. The reference building is located in Zamora, Spain, a region characterized by a cold and semi-arid climate with little annual rainfall (Köppen Geiger classification BSk [43]). The Summer season is short, hot, and dry; while the winter season is cold and windy. The climate file provided by the Spanish Technical Building Code has been used as an inlet variable in the modeling process [44]. The dynamic simulation program TRNSYS has been used to assess the annual thermal loads required for conditioning the building. This tool executes numerical calculations in a transient regime until the convergence is reached at each time step.
2.2 Simulation environment
Once the case study has been modeled, a sensitivity analysis has been carried out in a simulation environment coupling TRNSYS, as the simulation engine, with GenOpt, as the tool for the execution of different simulation batteries. A parametric analysis has been performed, modifying only one variable in each battery while the rest remains constant. Four variables have been evaluated: number of floors, floor area, type of envelopes, and window to wall ratio with respect to the lateral envelope. Different simulation bounds have been set for the seven constructive measures proposed:
Number of building floors: 2, 4 and 6.
Floor area: 200, 400, and 600 m2.
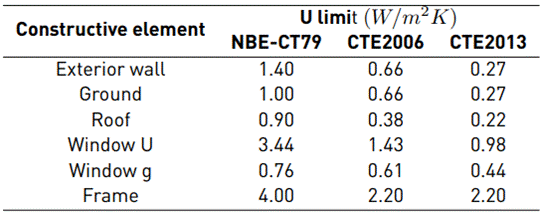
Type of envelopes according to Spanish regulations for Zamora: NBE-CT79 (normative 1979-2005), CTE2006 (normative 2006-2013) and CTE2013 (normative after 2013).
Window to wall ratio on the South, North, East and West façade: 25, 50 and 75%.
The Spanish Building Normative regulates the construction of buildings in the country depending on the age of construction. These regulations provide the limit values of the global heat transfer coefficients for the constructive elements of the building envelope. Opaque elements (roof, walls, ground) and transparent elements (glass and frames) have been defined for each normative value. The regulation on energy savings in buildings includes a national climate classification based on seasonal severities: winter severity is identified by a letter and summer severity by a number, fitting Zamora in D2. Table 1 shows the global heat transfer coefficients (U value) defined for the building envelope. The glazing elements are characterized by the heat transfer coefficient (Window U) and the adimensional solar heat gain coefficient (Window g). These meet the minimum construction and operational requirements regulated by three considered regulations (1979, 2006 and 2013) for D2 zone. Finally, the annual building heating and cooling loads have been established as cost functions in the parametric evaluation, giving a total of 2187 simulations.
3. Results
Once the parametric analysis has been executed, annual heating, cooling and total loads have been processed to quantify the thermal performance of the studied building cases. These results are assessed using as a reference the average annual thermal load per m2 of useful pavement, and the seasonal thermal loads (heating, cooling and total). The use of these references allows the comparison of the annual building needs with different volumes, attending to the compactness or the ratio between the volume of the building and the envelope area.
3.1 Global results
The processing of the annual thermal loads highlights the extreme cases (maximum and minimum) and the mean cases reached for the heating, cooling and total series obtained. Table 2 shows the geometric and constructive characteristics of these cases identifying the number of building floors, the surface area, the construction regulation, and the window percentage defined for the main façades.
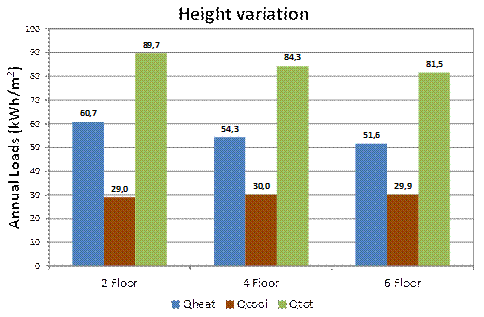
The representation of the nine-building cases processed highlights the limit ranges and the average values reached by the studied sample. Figure 2 shows the annual loads obtained for the heating series (Qheat, blue bars), the cooling series (Qcool, brown bars), and the total series (Qtot, green bars). The comparison between maximum and minimum thermal loads reaches greater differences for the heating and cooling series than for the total series.
Analyzing the results for the heating series, higher constructive quality in the envelope provides lower values of annual thermal loads. This occurs when the building cases use construction regulations after 2006. The greater the compactness, the lower the thermal loads. A strong influence is highlighted when the ratio of the glazed part to the opaque part of the façade differs depending on the orientation. Large windows in the south and east façades are associated with higher overall solar gains and morning gains, respectively, resulting in a reduction of heating loads. In these orientations, the solar accumulation at the first hours and during the day produces a positive balance in spite of the losses that are associated with bigger windows. On the contrary, a lower percentage of windows in north and west orientations provide better results in thermal heating loads, as the losses produced by large windows give rise to a negative heat balance. The global results obtained for the cooling series show that the increase of the window to wall ratio on the façade leads to greater solar gains in summer, resulting in higher thermal loads. Therefore, in order to minimize the cooling loads, the size of windows in all orientations should be minimized. The construction quality of the envelope has an important influence on the building cooling needs. The poorer quality of construction elements results in lower cooling loads. However, the maximum values are not produced for the most restrictive regulation (CTE2013); the peak is produced with the 2006 regulation (that prioritizes protection against cold climate). The greater the compactness, the lower the cooling loads. The obtained results for the total loads are very similar to those obtained for heating. In these cases, the greater annual contribution is produced during the winter period. The main difference between both series is reached for the optimization of the window to wall ratio in the façades. This is due to the fact that the total annual balance must take into account both heating and cooling, trying to minimize the thermal loads in both periods. In the annual calculation, the best combination of the window percentage to minimize the total loads is 25% in the north, east and west façades and 50% in the south façade. This combination implies minimizing the annual losses for the most unfavorable orientations, minimizing the morning heat contributions and optimizing the heat contributions provided by the south façade throughout the year. The maximum values of total thermal loads are produced with the highest percentage of windows in all orientations.
To quantify the impact obtained on the building thermal response by the proposed constructive measures, a sensitivity analysis has been performed using as reference the total thermal loads of the three mean cases. Figure 3 shows the maximum (black points) and minimum (grey points) savings in the thermal loads reached by each constructive measure for the heating, cooling, and total series. Seven cases have been studied: 1-normative variation, 2-floor variation, 3-surface area variation, 4-South window to wall ratio, 5-North window to wall ratio, 6-East window to wall ratio and 7-West window to wall ratio.
Plotted points in each graph represent the annual savings obtained for the maximum and minimum cases calculated with respect to the mean case. The most influential measures are the construction characteristics and the floor area, while the less influential measures are the building height and the north and west glazing cover ratio.
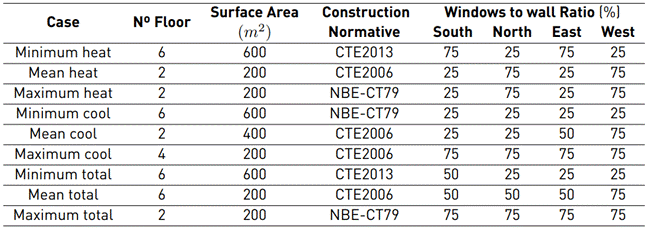
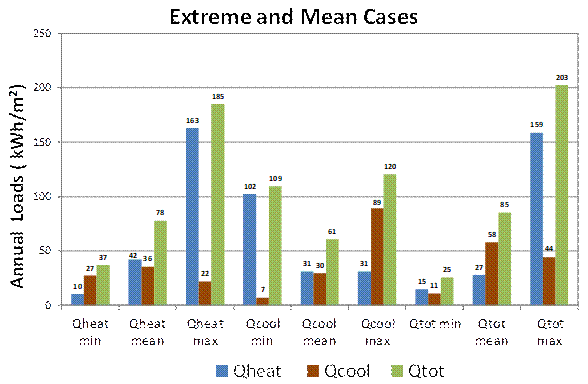
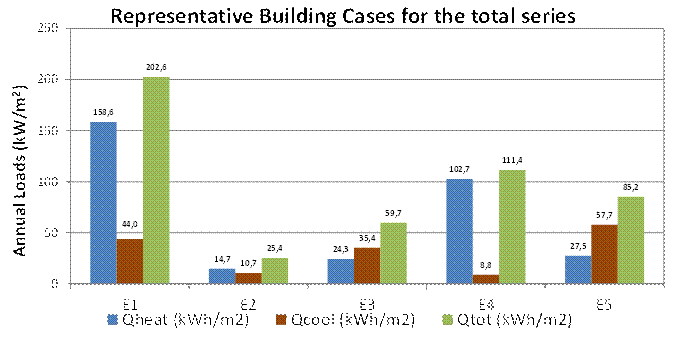
Figure 2 Annual demands for heating, cooling and total series obtained for the extreme and mean cases
The highest dispersions from the mean values are obtained when the envelope characteristics are modified according to the studied normative regulations, while the minimum deviations from the mean values are obtained when the number of floors is modified.
3.2 Representative building cases
In order to analyze the total thermal response of the building behavior under different constructive conditions, five reference building cases have been evaluated: E1, E2, E3, E4, and E5. The building case E1 represents the maximum value achieved for the total annual loads, while E2 represents the minimum value achieved for the total annual load. Cases E3 and E4 represent buildings with a total thermal load close to the mean value. E5 represents the mean total thermal loads reached for the whole year. Table 3 shows the geometric, and constructive characteristics of these representative cases.
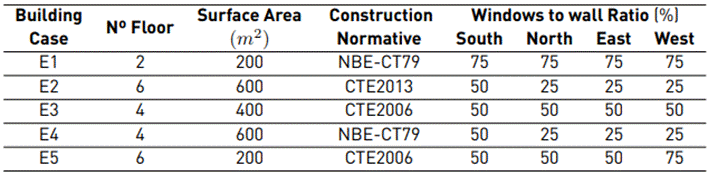
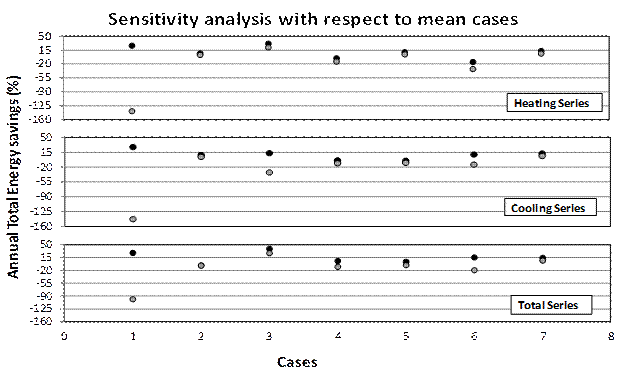
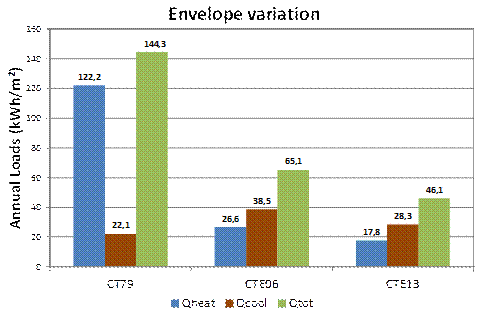
Figure 3 Annual total energy savings achieved by the heating (upper graph), cooling (middle graph), and total (lower graph) series with respect to the mean building cases
The thermal loads obtained for the five representative building cases are shown in Figure 4. In this graph, the annual values for the heating series (blue bars), cooling series (brown bars) and total series (green bars) are plotted. Comparing the two intermediate reference buildings with the complete series, E3 decreases 30% the total mean value while E4 increases 31%. In these buildings, there is an opposite situation for heating and cooling. The heating need for E3 increases the average value by 56% while for E4 decreases by 85%, being the opposite situation for the cooling needs (reduction of 19% and increase of 70% respectively). The case E4 is slightly more compact, with an envelope built under less strict regulation and a lower window to wall ratio in all orientations (except in the south façade which is the same ratio). These characteristics result in less solar gains during the winter and more losses through the envelope, which leads to higher heating and total loads. This behavior is due to the strong influence that winter loads produce on the annual calculation. As a result, the E3 building can be proposed for seasonal winter use and not be used in summer (schools). On the other side, the E4 building can be proposed for seasonal summer use (vacation housing or summer camps).
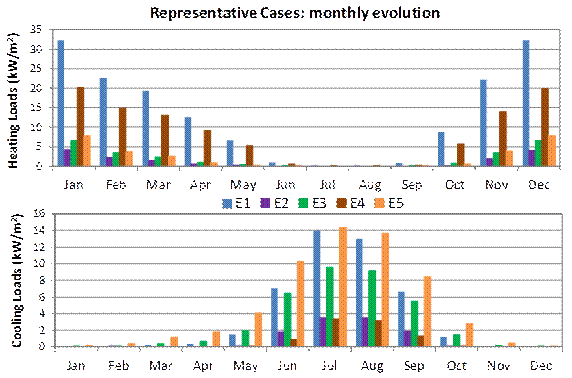
To highlight the monthly profiles achieved by the representative building cases, the heating and cooling loads of each case are plotted in Figure 5.
For the heating series (upper graph), the highest loads are reached for case E1, while the lowest loads are reached for case E2. The maximum values are obtained in January and December, while the minimum are obtained in May and October (without taking into account the summer period from June to September, where the heating loads are practically null). The intermediate building E4 is equivalent to 67% of the maximum monthly values (on average), being the closest case to E1. The intermediate case E3 obtains a monthly heating profile very similar to the mean building case E5. Finally, the case furthest from the maximum heating profile is E2, which is equivalent to an average of 8% of case E1. For the cooling series (lower graph), the highest loads are achieved for case E5, while the lowest loads are achieved for case E4. The maximum values are obtained in July and August, while the minimum values depend on the case. Cases E5 and E3 register cooling loads all the months of the year. Case 1 has cooling needs from February to November while cases E2 and E4 have cooling needs from May to September. Cases E1 and E3 are equivalent to average values of 75% and 62% of the maximum values registered by E5. Cases E2 and E4 obtain similar monthly profiles being 18% and 14% of case E5 (on average).
3.3 Influence of the constructive measures
The influence that the constructive measures have on the building thermal loads has been quantified by the sensitivity analyses performed. Several building heights, envelope characteristics and window to wall ratios on the main façades (north, south, east, and west) have been assessed. The obtained results are shown in the following figures [Figure 6 - Figure 9] that represent the average values of annual loads for heating (blue columns), cooling (brown), and total (green) series.
Influence of height on the total thermal loads
The first variable to be analyzed is the number of building floors. Three heights have been studied: 2, 4 and 6 floors with 3 m high between floors. The annual accumulated total thermal needs achieved by each case have been plotted in Figure 6. Lower heating and total loads are obtained when the building height increases with a maximum decrease of 15% for the heating series and 9% for the total series. This effect is more marked when comparing buildings of 2 and 4 floors versus buildings of 4 and 6 floors. In the first case, the percentage of decrease of total loads is 6%, while in the second case is 3%. Analyzing the cooling series, the influence of the number of floors is very slight. There is a percentage of decrease between 2 and 6 floors of about 3% being non-existent between 4 and 6 floors.
Influence of the envelope characteristics on the total thermal loads
The influence of the building’s construction parameters on the accumulated total loads is quantified, modifying the characteristics of the building envelope of the studied case. Three Spanish regulatory periods have been assessed: NBE-CT1979 (CT79), CTE 2006 (CTE06) and CTE 2013 (CTE13). Figure 7 represents the annual accumulated total thermal needs achieved by each standard.
As the construction requirements of the building improve, the annual values registered by the total and heating series decrease. This reduction is more pronounced for the regulation CTE 2006, reaching a percentage of decrease of 55% for the total series and 78% for the heating series. On the other hand, the cooling series increase for the standards after 2006 with a maximum value of 22% when comparing normative CT 79 with CTE 2013.
Influence of the floor area on the total thermal loads
Another constructive measure analyzed is the floor area defined for the complete series of the building loads. Three -floor areas are evaluated: 200, 400 and 600 m2.
The annual accumulated total thermal needs achieved by each floor area have been plotted in Figure 8. When the building floor area increases, the annual values registered for the total, heating and cooling series decrease. This reduction is more pronounced for the step between 200 and 400 m2.
Influence of the window to wall ratio for the main façades on the total thermal loads
Finally, the influence of the window to wall ratio is assessed for the complete annual series of the building loads. Four cases have been studied: North, South, East, and West façades, modifying in each one the ratio of glazing over the opaque wall. Three percentages of window to wall ratio have been evaluated: 25, 50, and 75%. Figure 9 shows the accumulated annual loads obtained for the four orientations and the three studied percentages of glazing.
The total annual needs increase as the percentage of glazing elements increases. The least marked effect is recorded in the south orientation. This façade registers the highest heating load reduction when the percentage of windows increases, compensating for the increase of cooling needs. On the opposite side is the east orientation. In this façade, the cooling loads significantly increase while the heating loads decrease with a higher percentage of windows. The effect of increasing the percentage of glazing on the north and west façades is smaller. In both cases, the heating loads increase, contrary to the two previous orientations, but the increase of cooling loads is lower.
3.4 Statistical study
Statistical analyses are carried out to quantify the distribution reached by the annual thermal loads. These studies are performed by setting the analyzed variable in the database, giving rise to batteries of 729 simulations. Three variables have been fixed: height of the building, floor area, and envelope characteristics based on the Spanish constructive regulations. Frequency and accumulated values have been calculated for the heating and cooling series.
Due to the order of magnitude of the working values, the distribution of the heating and cooling loads is evaluated in the range of 5 kWh/m2. Heating and cooling graphs have been obtained for each battery, representing the frequency values in the left Y-axis, the accumulated values in the right Y-axis and the thermal loads in the X-axis.
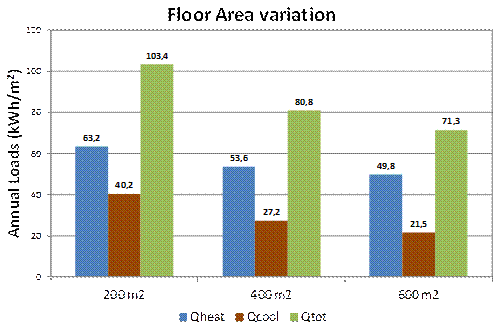
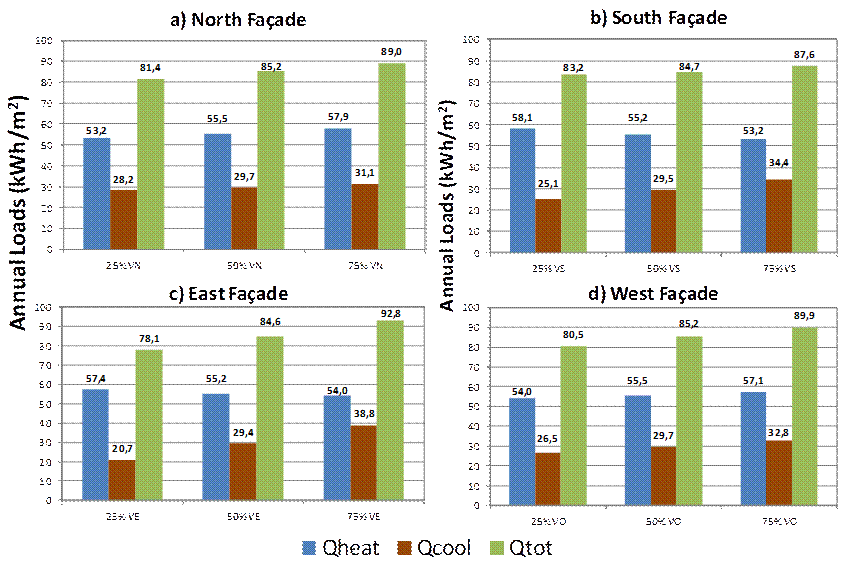
Figure 9 Accumulated total thermal loads obtained when the percentage of glazing on the north façade (a), south façade (b), east façade (c), and west façade (d) is modified
Distribution fixing the height
Figure 10 shows the annual distribution and the accumulated values obtained for the heating and cooling series. Three options have been quantified: 2 (blue format), 4 (green), and 6 floors (orange).
The heating series shows two clearly differentiated regions, one concentrated between 15-45 kWh/m2 and another between 95-165 kWh/m2, with a null area from 45 to 95 kWh/m2. This is mainly due to the strong influence that the envelope characteristics have on the thermal loads. The maximum peaks for the first heating distribution are obtained with 25 kWh/m2 frequency in buildings with 2 floors and for 20 kWh/m2 in buildings with 4 and 6 floors. The maximum peaks for the second heating distribution are obtained for 125, 115, and 110 kWh/m2 in buildings with 2, 4 and 6 floors.
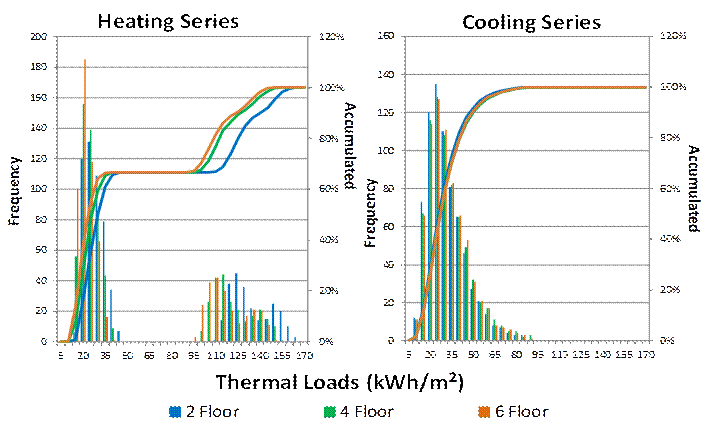
Figure 10 Annual frequency and accumulated percentages reached by the heating series (left) and cooling series (right) for 2-story, 4-story and 6-story buildings
The most striking aspect of this graph is that the higher the floor, the more concentrated the heating values. In the two regions, the accumulated values are obtained faster in 6-story buildings followed by 4 and 2. The cooling values graph is similar for the 3 heights, both in shape and values, representing a normal distribution between 10 and 90 kWh/m2 with the maximum peak achieved in 25 kWh/m2 for the three building heights. The statistical values [Table 5] indicate that the heating loads are not only lower at higher heights; the error and deviation obtained are lower, a trend pointing to more stability. The difference in height does not have such a marked effect on the cooling loads.
Distribution fixing the floor area
A statistical analysis has been carried out by setting the building floor area as the study variable. Three floor areas have been evaluated: 200, 400, and 600 m2. Figure 11 shows the annual distribution and the accumulated values reached by the heating and cooling series. The blue format represents an area of 200 m2, the green format represents 400 m2, and the orange format represents 600 m2.
Two normal distributions have been obtained for the heating series produced by the strong influence exerted by the envelope on the thermal loads. The first one is concentrated between 15-45 kWh/m2, while the second one is concentrated between 95-165 kWh/m2. Based on the frequency values, the maximum peaks for the first heating distribution are obtained for 20 kWh/m2 in the three studied floor areas. The maximum peaks for the second heating distribution are obtained for 140, 115 and 10-110 kWh/m2 in buildings with areas of 200, 400 and 600 m2, respectively. In both regions, higher percentages of the accumulated values are obtained faster for bigger areas. A normal distribution has been obtained for the cooling series, ranging between 10 and 90 kWh/m2. The maximum peaks are reached for 35-40 kWh/m2 (buildings with 200 m2 floor area), 25 kWh/m2 (400 m2) and 20 kWh/m2 (600 m2) ranges. The accumulated values are obtained faster for buildings with larger surface. The evaluation of the statistical values [Table 6] indicates that lower thermal loads, error, and deviation are reached for bigger areas.
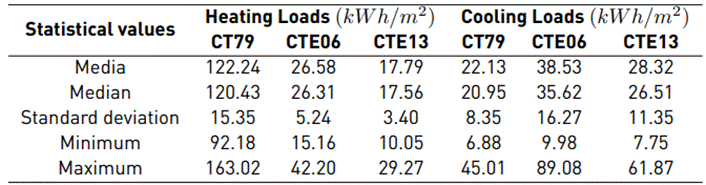
Distribution fixing the envelope
It is, therefore interesting, to carry out a complementary statistical analysis by setting the envelope, which has been shown to be the most influential variable. Figure 12 shows the annual distribution and the accumulated values reached for the heating series (left graph) and cooling series (right graph).
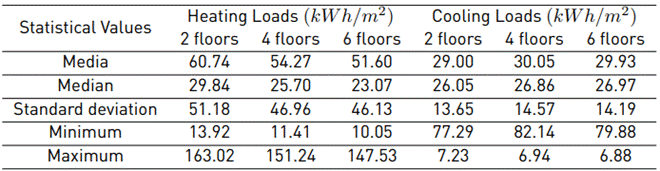
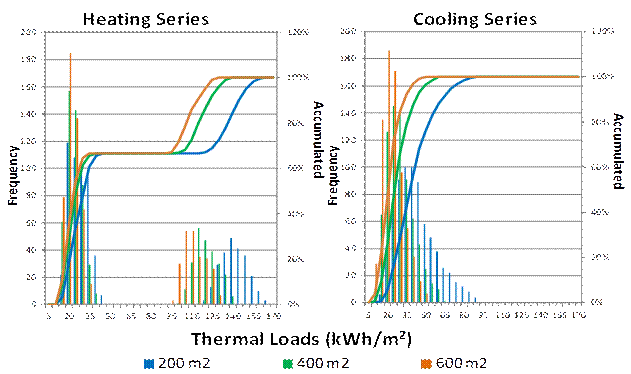
Figure 11 Annual frequency and accumulated percentages reached by the heating series (left) and cooling series (right) for areas of 200, 400 and 600 m2
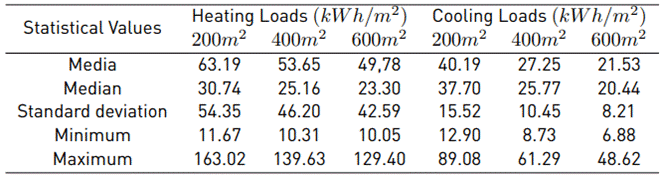
Three Spanish construction normatives have been evaluated: CT 1979 (CT79: blue format), CTE 2006 (CTE06: green format), and CTE 2013 (CTE13: orange format). Statistical studies quantify the heating and cooling trends; results are shown in Table 6.
Analyzing the heating series, two normal distributions have been obtained. The first distribution is obtained for CTE06 and CTE13 and it is concentrated between 15-45 kWh/m2. The maximum peaks achieved by this distribution are reached for 30 kWh/m2 for CTE06, and 20 kWh/m2 for CTE13. The accumulated values are obtained faster in CTE13 buildings than CTE06. The second distribution is composed of the construction regulation CT79 and it is concentrated between 95-165 kWh/m2. The maximum peak for the second heating distribution is obtained for 120 kWh/m2.
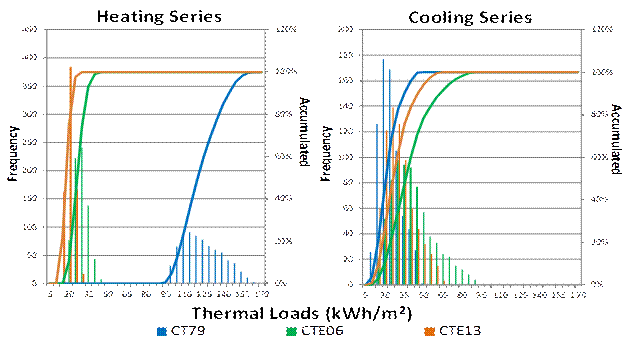
Figure 12 Annual frequency and accumulated percentages reached by the heating series (left) and cooling series (right) for the Spanish construction regulations CT79, CTE06 and CTE13
For the cooling series, a normal distribution has been obtained, ranging between 10 and 90 kWh/m2. The maximum peaks reached vary between 20 kWh/m2 for the CT79 regulation, 30 kWh/m2 for the CTE06 regulation and 25 kWh/m2 for the CTE13 regulation. The accumulated values for the cooling loads are obtained faster in buildings with the CT79 regulation followed by CTE13 and CTE06.
4. Conclusions
Within the framework of the SISGENER project, a sensitivity study has been carried out to evaluate the influence of different constructive factors on building thermal loads. The base building analyzed is a block without internal gains and located in a cold semi-arid climate (Zamora). As analysis variables, volumetry, materials of the envelope according to regulations, and size of the windows in the main façades of the building (north, south, east, and west) are considered. This study has been carried out through a dynamic simulation environment that gives rise to 2187 simulations.
The data series obtained for the heating loads generally shows higher values than those for the cooling loads. Evaluating the heating series, it is observed that the most influential factor is the variation of the materials that characterize the building envelope, followed by the variation in surface and height: Higher regulatory requirements for building envelopes, corresponding to more recent regulations, lead to lower heating loads. With regard to the window to wall ratios on the external façades, it is more influential in the South orientation followed by East and North, the least influence being on the West.
The composition of the building envelope is a very particular element when analyzing cooling. Buildings built under the NBE-CT79 standard have less thermal needs, while those built under the CTE2006 standard, which have more thermal needs. The buildings built under the CTE2013 standard correspond to intermediate cases. The window to wall ratios on east-facing façades is almost as critical as the envelope. Surface and south-facing windows have a noticeable effect, less so on west-facing windows. The variation in the window to wall ratio in North orientation, and above all in the building height, point to less influence. The variations made on the parameters analyzed, without counting the envelope, show that cooling is more sensitive to changes.
The element whose variation is most critical over the overall thermal load is the envelope, followed by the surface and the Eastern window to wall ratio. The number of floors, the window to wall ratios facing north and west achieve similar order of influence. The southern window to walls ratio seems to be less influential: beneficial in winter and harmful in summer.
The statistical analysis allows understanding the global building performance obtained from the simulation batteries. The distribution of the heating values highlights two quite defined intervals and shows more stability with a higher number of floors. The distribution of cooling values is asymmetric but more regular.

