


 Inglés (pdf)
 Articulo en XML
 Referencias del artículo
 Enviar articulo por email
 Citado por SciELO
  Citado por Google
  Similares en
SciELO
Similares en
SciELO  Similares en Google
 Permalink
1. Introduction
The rapid urban expansion, associated with intense population growth rates over the last centuries, tends to influence and modify various environmental aspects, generating impacts on the air, water, soil, and biodiversity[1-4]. Under such circumstances, it is clear that the increase in urban traffic, expansion of industrial zones, and suppression of vegetation are the main degradation factors of urban air quality and local climate changes [5-7]. In addition, a large part of the population is exposed to different levels of environmental noises, capable of producing diverse effects on human health and well-being [8]. Therefore, air pollution and environmental noise are considered the two major environmental pressures associated with decreased quality of life in cities [9].
Several studies emphasize the adverse effects of these components on human health [9-11], including respiratory and heart diseases [12-14], and causing annoyance and decreasing the cognitive ability [15]. Thus, one of the great challenges for contemporary cities managers is providing quality of life to their inhabitants by improving the urban environment. To achieve this purpose, noise levels and air quality monitoring are extremely important to assess environmental risks, as well as to maintain or improve the environmental quality in urban centers and on the outskirts[15-17].
The main aim of this study was to study ozone, carbon monoxide, nitrogen oxides, and noise levels in the industrial park of Mirandela (Portugal). Since ozone is a very unstable secondary pollutant, its presence in the troposphere is mainly due to its photochemical production, which takes place through the oxidation of hydrocarbons and carbon monoxide in the presence of nitric oxides and solar radiation [18]. For this reason, nitric oxides, carbon monoxide, along with meteorological parameters were also monitored in this research.
To achieve the objectives of this study, a monitoring system composed of one weather station, three gas analyzers and, one noise sensor was installed in the Mirandela industrial park. The data collected during the winter and spring months of 2019 was used to correlate the different variables monitored with ozone production. This monitoring system allowed further monitoring of the daily noise levels and the identification of the weekly noise profile. Additionally, for 2019, the analysis for AOTx (Accumulated Ozone Exposure above a Threshold of x ppb) and NET 60 was carried out. Over the next sections of this paper, a brief characterization of the industrial park, the methodological details of the study and the main air quality, and noise results are presented and discussed.
2. Understanding noise and ozone pollution
Air pollution is defined as a condition where one or more substances are present in the atmosphere at concentrations above normal ambient levels and particularly during a sufficiently long period to produce adverse effects on the health of humans, animals, and plants, or to cause material damage[19,20]. According to the European Directive, noise corresponds to any unwanted sound or set of sounds that cause annoyance or may have an impact on human health, emitted by human activities, such as road traffic, rail traffic, air traffic, and industrial sites[21].
Both air and noise pollution are composed of three elements: source, transport (path), and receptor[22]. In an industrial park, the sources of noise and air pollution are stationary or mobile, relative to the buildings and transportation systems, respectively. The receptor is any biotic or abiotic organism that suffers the adverse effects of air pollution, including humans, animals, plants, water, and soil[22]. In living organisms, the effects range from minor allergies to severe chronic illness [9], [23]. The third and last element, transport, corresponds to the path or mechanisms that move the pollutant or sound from the source to the receptor[22,24]. Along the way, an air pollutant can change several times, reacting in the atmosphere producing another pollutant or being deposited by turbulent flow, rain, or snow[25]. For sound, the path mainly affects the propagation distance due to the existing obstacles[26].
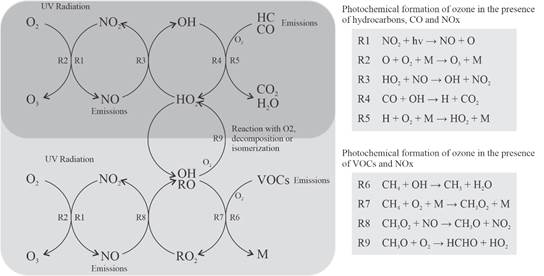
To better understand the dynamics of ozone, it is necessary to know the mechanisms of its formation. Figure 1 shows the simplified ozone formation cycle with its main reactions. The reactions between O3, NO, and NO2 (R1-R3) are part of a well-established null cycle[18]. Thus, during daylight hours, theoretically, NO, NO2 and O3 are typically balanced on a condition referred to a photostationary state[27]. An atmosphere only with nitrogen oxides does not favor the ozone production, as ozone can be recycled during the reactions. However, in the presence of other precursor gases such as carbon monoxide (R4-R5), and volatile organic compounds (R6-R9), new reactions are triggered, resulting in excess of ozone production [28,29]. These reactions lead to the formation of the hydroxyl (OH), hydroperoxyl (HO2) and organo-peroxyl (RO2) radicals, which results in the formation of nitrogen dioxide without ozone consumption and, consequently, leading to higher ozone production rates.
3. Methodology
3.1 Industrial Park of Mirandela - Brief Description
This study was carried out in the urban industrial park of Mirandela (41°29'N / 7° 9'W), located in the northeastern region of Portugal, in the region known as Trás-os-Montes. The Industrial Park has an area of 33 hectares, with 97 lots distributed to different industrial and commercial sectors. It comprises approximately 65 companies of different typologies such as sausage and granite factories, oil mills, carpentry, locksmiths, and car repair shops. The Industrial Park is mostly surrounded by rural areas with olive trees plantations and open grassy spaces and is bounded by roadways to the west and south. Due to the wide variety of services, the industrial park has a relatively high car traffic intensity. The Mirandela downtown is located southwest of the Industrial Park. Mirandela is classified according to Köppen-Geiger climate classification system as Csa, defined as Mediterranean climate with dry and hot summer.
3.2 Monitoring and Analysis Methods
The air quality monitoring started in December 2018, with hourly measurements of carbon monoxide (CO), nitrogen oxides (NO, NO2, NOX), and ozone (O3), covering for this study the period between December 1, 2018, and October 1, 2019. All these gaseous pollutants were monitored according to the reference methods described by the Directive 2008/50/EC, using three gas analyzers: one ozone analyzer HORIBA APOA-370 (non-dispersive ultra-violet-absorption), one nitrogen oxides analyzer HORIBA APNA-370 (chemiluminescence) and one carbon monoxide analyzer HORIBA APMA-370 (non-dispersive infrared absorption). Noise monitoring started on February 8, 2019, using the CESVA TA120 noise sensor, with measurements taken every minute, covering the spring season of 2019. The noise sensor has class 1 accuracy according to IEC 61672-1 and was deployed outdoors as it has a weather protection cover. In addition, a meteorological station was used to characterize the prevailing local weather conditions, measuring the direction and wind speed, solar radiation, temperature, relative humidity, and precipitation. The gas analyzers, weather station, and noise sensor [Figure 2] have the capacity to send data remotely via GPRS system, enabling the data to be accessed through a remote server.
Based on the solar radiation data, the days were divided into daytime (8:00-19:00) and nighttime (20:00-7:00) to determine the correlation coefficient between the variables and the local and regional contribution to the prevailing O3 levels. These separate timeframes were chosen considering the ozone formation and depletion mechanisms that have a strong dependence on solar radiation.
For ozone, critical levels analyses were also performed - AOT40, AOT60, and NET60. The AOT40 (Accumulated Ozone Exposure above a Threshold of 40 ppb or 80 µg/m³) was established by the United Nations Economic Commission for Europe under the Convention on Long Range Transboundary Air Pollution (UNECE-CLRTAP). By definition, AOT40 is the sum of the differences between the hourly ozone concentrations and 40 ppb when the concentration exceeds 40 ppb during daylight hours over the period of May-July for vegetation and April-September for forest, and represents the limit above which direct effects on vegetation occur[30]. For AOT40 vegetation, the European Union has a target value of 9000 ppb.h and a long-term target of 3000 ppb.h[30], while for the forest, the reference value is 10000 ppb h [31] with a critical value of 5000 ppb h[32]. These target values are averaged over 5 years. However, for the purposes of this study, the analysis for 2019 was carried out to verify the current situation within the established limits.
For human health protection, there is the AOT60 (Accumulated Ozone Exposure above a Threshold of 60 ppb or 120 µg/m³), calculated by summing the difference between the maximum 8-hour concentrations above 60 ppb and 60 ppb with a ceiling of 2900 ppb.h throughout the year [30,33,34]. In conjunction with the AOT60 is NET60 (Number of Exceptions above a Threshold of 60 ppb), which sets a limit of 25 days in the year (averaged over 3 years), where maximum 8-hour ozone concentrations can exceed 60 ppb. In the long term, the European Union aims to reach 0 days, which would consequently bring the AOT60 to zero [30,33].
Concerning noise, daily and weekly profiles were evaluated based on hourly average data observed during the spring months. Additionally, the noise assessment was based on the Portuguese General Noise Regulation (RGR) (Decree-Law No. 9/2007 of January 17) [35]. The RGR does not set noise limits to industrial parks themselves, but any activity located in an industrial park has to comply with criteria established in RGR for sensitive receivers (i.e., spaces where people live or stay) near industrial areas. The criteria set for those receivers depend on the classification established in the municipal master plan for the area where they are located. These areas can be classified into sensitive and mixed zones. The RGR [35] defines sensitive zones as areas for residential use, schools, hospitals or similar, and recreational or leisure spaces, and may also contain small shops and services since they do not operate at night, while mixed zones in addition to the uses for sensitive zones may contain shops, services, and industries working all day.
In the master plan of Mirandela, the residential areas near the industrial park are classified as mixed zones. For these areas, the RGR specifies the limit value of 55 dBA for the night noise indicator (Ln) and a 65 dBA for the day-evening-night noise indicator (Lden). Based on this, for research purposes, the monitoring point was evaluated as a mixed zone.
4. Results and Discussion
4.1 Daily Profile of Meteorological Parameters, Ozone and its Precursors
Figure 3 shows the diurnal profile of solar radiation, air temperature, relative humidity, and concentrations of ozone and its precursors.
The higher concentrations of the primary pollutants (CO and NOX) registered between 8:00 and 10:00 and between 17:00 and 18:00, coincides with the greatest intensity of traffic associated with the beginning and end of the daily activities inside and outside the industrial park. The higher levels of these primary pollutants in winter show clearly the influence of other combustion sources, such as domestic combustion for heating water and ambient air in dwellings.
In winter, ozone concentrations increase from 8:00 until they reach a peak of 33 ppb at 16:00. It is also noted that during rush hour (about 18:00), the increase in NO and NO2 concentrations did not imply a significant increase in ozone concentration, partially explained by the prevailing low solar radiation. The ozone pattern in spring and winter was similar; however as the days are longer and the incidence of solar radiation is higher, there are favorable conditions for ozone production. In spring, ozone concentrations rise from 7:00 to reach their peak at 14:00, remaining stable until 19:00. Considering also that O3 production depends on the concentration of NO, NO2, CO, and volatile organic compounds, these gases are consumed as the O3 concentration increases. Because of the photostationary state, it is possible to observe in winter an ozone concentration near 30 ppb between 14:00 and 17:00 and in spring a concentration near 50 ppb between 13:00 and 19:00.
4.2 Relation Between Air Quality and Meteorological Variables
Tables 1 and 2 show the daytime and nighttime correlation coefficients between hourly means of individual pollutants (CO, NO, NO2, NOX and O3) and the meteorological parameters for winter and spring. The values in bold were those that show a significant correlation at the 0.05 level (2-tailed). Similar to another study[36], a positive correlation was found between nitrogen oxides and carbon monoxide during daylight, indicating that both gases have the same source, mainly related to combustion processes (e.g., motor vehicles and industries).
Ozone showed a significant positive correlation with solar radiation and temperature during the daylight hours. This relation reverses during the night, due to the lack of solar radiation for ozone synthesis.
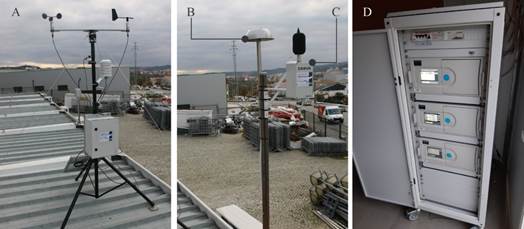
Figure 2 Set of the monitoring equipment used in the study: (A) Weather station; (B) air intake; (C) smart noise sensor; (D) gas analyzers container
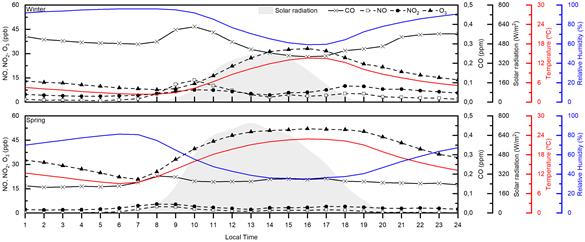
Figure 3 Average hourly variation of NO2, NO, CO, O3, solar radiation, temperature, and relative humidity during winter (top) and spring (bottom)
This trend is observed in other studies[36,37], showing that a favorable temperature and high solar radiation increase the photochemical reactions that generate ozone[39]. Moreover, based on reactions 1 to 3, an inverse relationship between ozone and nitrogen oxides is also observed, which can be confirmed by the negative correlation between these gases. The results also showed a negative correlation between CO and O3, since carbon monoxide reacts with hydroxyl radicals producing HO2 radicals and, consequently, NO2 which is photo-dissociated to produce O3.
It is also observed in Tables 1 and 2 that wind speed has a positive correlation with ozone concentration and a negative correlation with nitrogen oxides and carbon monoxide. This phenomenon may occur due to high wind speeds, which leads to the dispersion and mixing of the gases from local sources, favoring ozone transport and formation reactions taking place in the atmosphere[36]. Moreover, the positive correlation between wind speed and ozone levels can also be justified due to the transport of ozone produced on the main roads to the measurement point[40].
Table 1 Spearman correlation coefficients between hourly mean CO, NO, NO2, NOx, O3 and meteorological parameters for winter nighttime and daytime
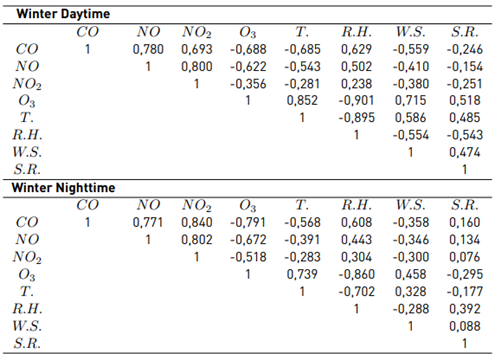
T.-Temperature R.H.-Relative Humidity W.V.-Wind Speed S.R.-Solar Radiation
There is also an expected negative correlation between ozone and relative humidity, since as relative humidity increases, the major photochemical paths of O3 removal will be lowered [41]. High humidity levels are associated with cloudy days and less sunshine, thus reducing photochemical processes[41].
4.3 Local and Regional Contributions to Ozone Formation
To determine the local and regional contribution to ozone formation, potential ozone levels (O3+NO2), also called total oxidant levels (OX), were related to NOX, following the same analysis used in other studies[42-44]. For this purpose, daily average values (day and night) of OX were evaluated against the values of NOX. For each data distribution, a linear regression was applied, thus providing an equation in which the slope represents the local contribution (NOx-dependent), while the intersection represents the regional contribution (NOX-independent). Figure 4 presents the linear regressions lines obtained for each of the studied months. The regional contribution represents the background OX concentration, while the local contribution is related to the local production/destruction[42].
When OX levels increase as a function of NOX, the NOX contributes mainly to ozone production; when the OX levels decrease, it means that NOX influences the processes of ozone depletion; and when OX levels remain relatively constant as a function of NOX, indicate that NOX contributes in equal parts to the production and depletion of ozone.
Based on the regression analysis from December 2018 to June 2019, it was possible to obtain the slope and intersection for each period. These results are presented in Figure 5, showing the monthly local and regional dependence of OX. It is noticeable that values of the local contribution are higher than the values of the regional contribution, thus indicating that for the industrial park of Mirandela OX production occurs mainly locally due to primary pollutants emissions.
For the regional component, there is a tendency to an increase in the concentration of OX, because the intensification of solar radiation helps photochemical processes. This same tendency was observed in other studies[43]. Regarding the local component, for daytime, an increase in OX concentration is observed from January to May, indicating that during this period, NOX favors ozone production. For the nighttime, the relationship is inverse, suggesting that that NOX is mainly related to ozone depletion mechanisms.
4.4 Concentration-based critical level of ozone
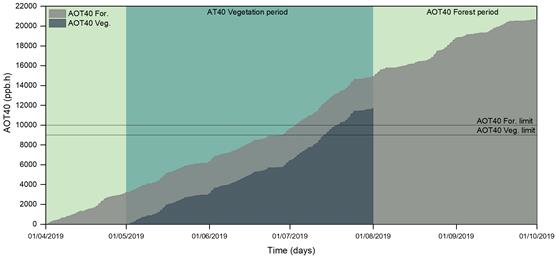
The accumulated AOT40 vegetation and forest levels were compiled in Figure 6. It is noticed that the limits for both AOT40 indexes were exceeded.
Table 2 Spearman correlation coefficients between hourly mean CO, NO, NO2, NOx, O3 and meteorological parameters for winter nighttime and daytime
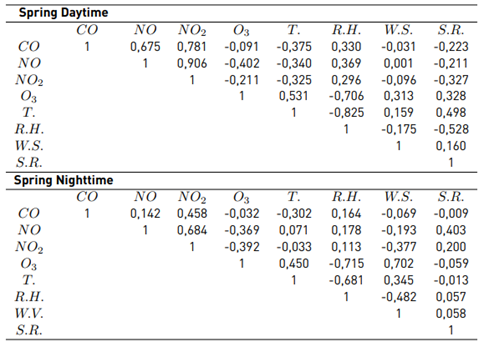
T.-Temperature R.H.-Relative Humidity W.V.-Wind Speed S.R.-Solar Radiation
For vegetation, the accumulated AOT exceeded 30% of the limit value, while for forests, the value exceeded 106% of the limit. It is noteworthy that these are the target values, but the long-term goal is to reduce the limit to 3000 ppb for vegetation and 5000 for the forest.
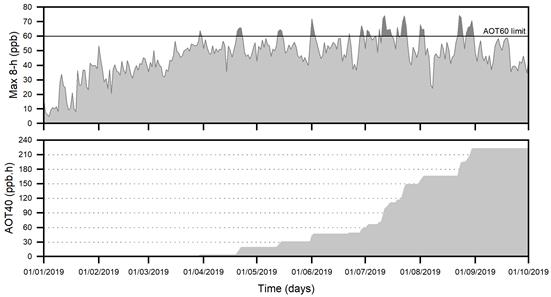
For AOT60, the results are shown in Figure 7. The values of AOT60 were well below the limit of 2400 ppb, reaching at the end of September the value of 220 ppb. Considering that, April until September are the months with higher ozone formation, the value of AOT60 should not have high variations until the end of the year. This can also be seen in Figure 7 with the daily maximum 8-hour means, which show a downward trend with colder seasons. NET60 reached 38 days, exceeding in 13 days the limit of 25 days stipulated by the European Union. It is important to note that AOT40 and NET60 target values are averaged over 5 and 3 years respectively, thus, these values are a characterization of the current situation and may serve as a basis for the creation of reduction measures.
4.5 Noise Monitoring
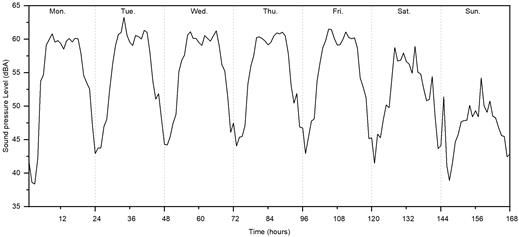
Figure 8 shows the hourly averages values during the spring months. Between Monday and Friday, the noise profile throughout the day is very similar, with the lowest averages observed between 1:00 and 3:00 at night. Subsequently, noise rises until 8:00, when activities start in the industrial zone, remaining relatively stable until 12:00. At that hour, there was a decrease in noise levels due to lunchtime, where most activities stop in the industrial zone. After 18h00, the noise level decreases due to the finish of the work hours. During the weekend, noise levels are lower than during working days, although Saturday levels are higher than those registered on Sundays because some activities operate on Saturdays.
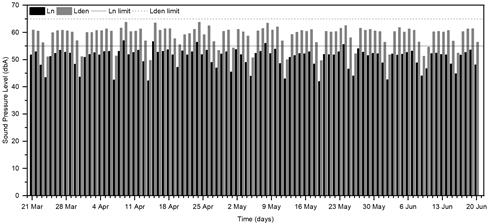
Figure 9 presents the daily average night noise levels (Ln) and the day-evening-night-noise (Lden) levels during the spring days. The Portuguese Decree-Law No. 9/2007 of January 17 establishes for Lden a limit of 65 dBA and for Ln a limit of 55 dBA for mixed zones. During the evaluation time, the night indicator was exceeded on April 4th, 15th, and 24th, and May 8th and 24th, reaching the values of 57.0, 56.7, 56.4, 56.0, and 55.6 dBA, respectively. As the exceeded values of Ln are very close to the established limit and occurred just a few times, it can be inferred that a singular event resulted in this phenomenon; therefore such values should be regarded as nonrelevant for the acoustic characterization of the industrial zone.
It should also be noted that although there are no legal limits for industrial parks, the observed values are within the legal limits for mixed zones, meaning that noise generated by activities in the industrial park of Mirandela, including traffic in roads, have little impact on the acoustic environment of the sensitive receivers located in its vicinity. During working days, noise remains relatively stable, close to 60 dBA, thus indicating that the noise sources in the industrial park have a typical behavior over the week.
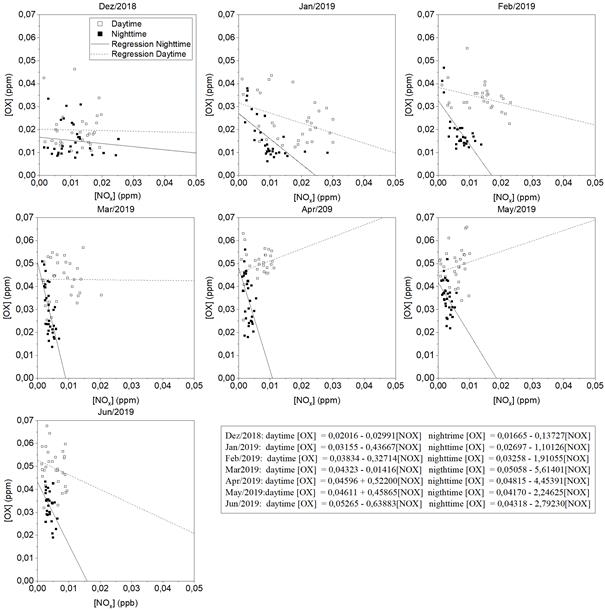
Figure 4 Daily variation means of regional [OX] with NOx during the months of winter and spring for daytime and nighttime
It is noteworthy that only one fixed noise sensor was used in this study. Therefore, for a better acoustic characterization of the industrial zone, it would be necessary to install more noise sensors, considering that the sound is attenuated due to the obstacles and the distance traveled. Additional monitoring points would also add useful information on the diversity of noise sources.
5. Noise and ozone control strategies
For local ozone depletion, one of the simplest strategies is greening the industrial area. Trees absorb ozone efficiently and affect ozone production by increasing the dry deposition of NOX, reducing the availability of this pollutant in the atmosphere for ozone formation [45].
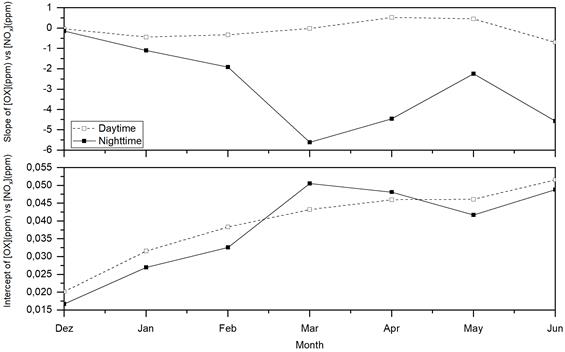
Figure 5 Monthly variation of regional (intercept) and local (slope) OX in the Industrial Park of Mirandela
A study analyzing heat island reduction measures found that the increase in the vegetation cover and the use of reflective roofs and pavements can reduce local ozone production, mainly due to daytime temperature reduction[46].
Although high noise levels have not been found, setting up a tree belt at the industrial park boundaries would be a valuable combined measure to reduce ozone and noise levels in neighboring regions. Depending on the tree species and disposition, noise attenuation above 6 dBA can be achieved, being more favorable the use of dense foliage and branches, which are more efficient in sound dispersion [47]. The use of vegetation also favors the absorption of noise by the soil, as it increases the porosity of the soil and consequently increases the surface absorption coefficient[48]. In addition, replacing dense-graded asphalt with a porous surface can achieve noise reduction values above 7 dBA[49].
6. Conclusions
The monitoring of atmospheric pollution in the industrial park of Mirandela was useful for the identification of the main components related to the local ozone production, as it was possible to verify that besides the ozone precursors, the meteorological variables had a major influence on its production, and especially solar radiation. By analyzing the levels of AOT40 and NET60, it was found that the values are far above the long-term objectives, so it is indispensable to apply strategies that may reduce the concentration of ozone precursors.
CO and NO emissions were also related to urban traffic because their concentration increased at the same time during the rush hours in the industrial zone. Regarding the analysis of OX vs NOX, it was found that the ozone present in the region derives mainly from local influence, and the negative relationship found for the local component indicates that NOX favors ozone depletion mechanisms. Thus, in future studies, it is suggested to monitor VOCs and hydrocarbons to better understand the different ozone production routes and verify which pollutant has the highest impact on ozone synthesis.
By monitoring noise, it was possible to verify that during the observation period on five occasions, the night limit was exceeded; however, these values refer to the interior of the industrial park, and considering that these limits are for the receiving zones, the sound pressure levels most likely reach the sensitive zones around the industrial park at lower levels. Also, the daily and weekly noise profile showed a strong influence of local road traffic, with the highest values during the rush hours, between 8:00 and 9:00h, 17:00 and 18:00h.

