


 Inglés (pdf)
 Articulo en XML
 Referencias del artículo
 Enviar articulo por email
 Citado por SciELO
  Citado por Google
  Similares en
SciELO
Similares en
SciELO  Similares en Google
 Permalink
1. Introduction
Generally, contamination of water bodies is linked to discharges from domestic sources [1].
The excessive nutrient intake in waterways is mainly linked to diffuse pollution resulting in particular from agricultural practices [2-8]. Fertilizers, pesticides and herbicides can be transported from lawns and fields to surrounding waters during and after rainstorms, due to stormwater runoff. In addition, industrial pollution also causes the degradation of the quality of water resources[9-14].
Furthermore, the chronological series of certain physico-chemical variables of water were analyzed in order to identify the temporal evolution of pollution, whatever its origin [15-18]. It is well known that this analysis is required to check whether the pollution level, in some specific places, changes from year to year, and also to identify the effects of certain specific actions [19]. An adequate knowledge of the structure of correlations linking these variables, as well as the interaction effect, trends and seasonal variability of these same variables are essential to control water quality [20].
The collection and analysis of time series of water quality are very significant in many parts of the world, especially in highly populated and industrialized areas [21]. Time series data are characterized by asymmetric and non-stationary distributions and seasonal patterns, and contain missing values [22].
Note that such characteristics cause great uncertainty in detecting and interpreting trends and limit the use of parametric methods [23]. Therefore, it would be preferable to use nonparametric tests in an environmental impact assessment study [21].
The Mann-Kendall (MK) nonparametric test is often used to detect the probable existence of a monotonic trend between the start and end of a time series [24]. It is worth mentioning that this test, which is not affected by the distribution of the data, is not sensitive to outliers because it performs calculations on the ranks of observations rather than on values [25,26]. A large number of researchers have used this test to detect trends in time series of environmental data [23,26][27-33].
This test has seen wide use in detecting trends in climatic and hydrological time series [22][34-38]. In the case of the presence of seasonality in the time series, it is recommended to use the Seasonal Mann-Kendall test [22,34][39,40]. For a particularly large set of data, this test is used to detect the presence of a trend during each season of the year [21].
The Theil-Sen estimator, which is a robust, efficient, nonparametric method and is not sensitive to outliers, is often used to determine the slope of the linear trend (the magnitude of the trend). Indeed, this method has been widely discussed by several authors, such as [41,42]. This estimator has been widely used in studies of environmental time series trends [43-47].
Regarding [41], the study provided an excellent case for using modern methods in nonparametric regression, including the advantages of the nonparametric bootstrap approach.
The present study focuses on the temporal evolution of the physico-chemical characteristics of waters from Cheurfas II dam, located in the large watershed of Macta, which belongs to the Oranie Chott-Chergui hydrographic region which is one of the water-scarce regions[48].
The Mann-Kendall test was used in the present study to detect the monotonic trends of ten time series of physico-chemical variables of the water of Cheurfas II dam using the R package Trend [49]. The trend analysis was based on measurements taken once a month for the variables dry residue (DR), organic matter (OM), pH, PO43- , NO- 3, NH+ 4, NO- 2 and the volume of dam water (Vol) covering the period 1998 - 2010, the BOD5 and COD for the period 2000 - 2010, and dissolved oxygen (DO) spanning the period 2005 - 2010. In addition, the seasonal Mann-Kendall (SMK) test was also applied after checking the presence of seasonality in the time series studied by the Webel-Ollech test [50]. Moreover, it was decided to determine the slope of the trend line for each variable using the Theil-Sen estimator to find the magnitude of the trend in the physico-chemical quality. Consequently, the Theil-Sen function of the R software “openair” package was used in deseasonalization mode. This function helps to provide more precise confidence intervals, even with non-normal data of heteroskedasticity [51] using the bootstrap method. This function also makes it possible to find the value of the slope expressed per year at the various possible significance thresholds (0.1, 0.05, 0.01 and 0.001).
2. Presentation of Cheurfas II dam watershed
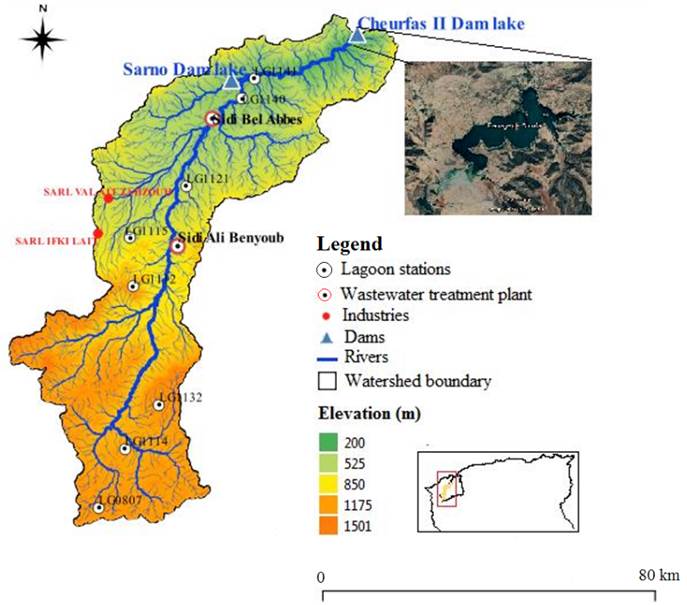
This watershed is located in the west of Algeria, between longitudes -1.141° and -0.142° west and latitudes 34.31° and 35.40° north. It covers an estimated area of 4025 km², with a perimeter of approximately 249 km. This dam is mainly fed by the Mekerra Wadi (river), which flows in the northern direction crossing the plain of Sidi-Bel-Abbes characterized by fertile agricultural land [Figure 1].
The Mekerra Wadi originates in the highlands at Ras El Ma, at an altitude of around 1272 meters and descends to almost 430 meters. The length of the longest thalweg is 148 km based on the information extracted from a digital terrain model (100m mesh). Crossing the city of Sidi-Bel-Abbes downstream[52], Wadi Mekerra merges with Wadi Sarno to form Wadi Mebtouh on which Cheurfas II dam is built, about 42 km northeast of the city of Sidi -Bel-Abbes, in the town of Cheurfas. This dam is located immediately upstream of the old Cheurfas dam, whose original reservoir was already silted up. This dam theoretically has a total capacity of 83 Mm3, with an annual regulated volume of 45 Mm3; 20 Mm3 of this volume are intended for irrigation. Since the impoundment of the dam, the volume of the reservoir has decreased from 83 Mm3 to 70 Mm3 [53]. This dam was commissioned in 1992, with an initial regulated volume of 45 hm3 / year and an annual water volume mobilized for irrigation of 6029 hm3. According to [53], the volume of mobilized water reached 12 hm3 in March 2005.
The watershed of Cheurfas II dam is subject to a semi-arid Mediterranean climate characterized by irregular and often violent rainfall, causing floods that have serious consequences in the urban areas of Sidi-Bel-Abbes. The interannual monthly average temperature (2003 - 2019) is around 27.21 °C. The average temperature of the hottest month (July) is 36.12 °C and the average temperature of the coldest month (January) is 2.45 °C. In addition, according to the National Agency for Hydraulic Resources [53], the average annual rainfall is between 350 and 450 mm / year. Moreover, the annual maximum decennial precipitation at the pluviometric station of Sidi-Bel-Abbes is 141 mm. Note also that the mean annual flow of the Mekerra Wadi is estimated at 0.82 m3 ∙ s-1 [54]. The annual intakes at the stations of Sidi-Ali-Benyoub and Hacaiba were estimated at 14.38 and 5.27 hm3, respectively, during the period 2003 - 2004 [53]. It is worth noting that the interannual evapotranspiration may reach an average of 1670 mm / year at the station of Sidi-Bel-Abbes. According to the DHW of Sidi-Bel-Abbes [53], the catchment area of Cheurfas II Dam has nearly 11 hill reservoirs, all intended for irrigation, and built during the years from 1985 to 1992. Their capacities vary between 420.103 m3 (Lamtar) and 25103 m3 (Oued-Sbaa and Tessala). This basin is, for the most part, composed of hills with little vegetation, which generates considerable solid transport [55]. Since the impoundment of the dam in May 1992, the volume of the reservoir has decreased from 83Mm3 to 70 Mm3. It should be known that the dam has never been filled to its full supply level, due to the low water intake.
Urban, industrial and agricultural land uses in the watershed have led to a proliferation of point sources of pollution, most of which come from industrial discharges that are generally diffused into surface water.
It is worth mentioning that the plain of Sidi-Bel-Abbes is known for its intense agricultural activity and is characterized by limestone soils with the accumulation of calcium carbonate. These soils have high organic matter (OM) contents, varying between 3.8% and 8%, for the first horizons, and can decrease down to 1%. This region is also characterized by fersiallitic soils with a clay texture [56]. The mountain ranges of the region between El-Haçaïba and Mouley-Slissen, which extends until Sidi-Ali-Benyoub, are covered with forests consisting mainly of Aleppo pines and holm oaks. This forest cover provides very little protection to the soil against erosion [57]. It should also be noted that nearly 80% of the Upper Mekerra watershed is covered with cereal and alfa crops. The Mekerra Wadi, which crosses several municipalities such as Sidi Lahcen, Sidi Brahim, El Haçaiba, Mouley-Slissen, Sidi-Ali-Benyoub, Boudjebaa, is exposed to several wastewater discharge points. There are dozens of final sanitation discharges and household and industrial waste landfills. According to the Hydraulics Department of the Wilaya DHW (2005), several municipalities in the Mekerra Wadi watershed discharge their wastewater directly into the Wadis after their collection by unit sewage networks, with the exception of the wastewater from the city of Sidi Bel Abbes and that from the commune of Sidi Lahcene which undergo purification before they are rejected in the Wadi. The industries whose main activities are dairy production and animal feed are located in the northwestern part of the town of Sidi Bel Abbes. The daily volume of wastewater discharged by these industries is estimated at 86 m3 / day. Raw wastewater from these industries is collected through the sewage network. The water conveyed by Wadi Mekerra is therefore loaded with considerable concentrations of several pollutants, which subsequently lead to the degradation of the water quality of Cheurfas II dam.
The watershed of Mekerra Wadi has about 3 treatment plants, two of which are shut down (Tilmouni and Ben-Badis) according to the DHW (2005). The only station that works is that of Sidi-Bel-Abbes, which was commissioned in 1997. The water purified by this treatment station is discharged into the Wadi. The number of lagoons developed upstream of Cheurfas II dam watershed is insufficient to ensure the elimination of organic pollution. These lagoons were commissioned in 2012.
3. Data and methodology
3.1 Data
Samples were collected once a month and analyzed in the laboratory of the National Agency for Hydraulic Resources (Agence Nationale des Ressources Hydrauliques - ANRH).
Water samples were taken from the surface of the dam lake using 100ml, 500ml, and 1000ml amber glass sampling vials. These bottles were washed several times beforehand with water from the sampling station located in the lake of the dam. The samples were stored in coolers at 4 ° C during transport to the ANRH laboratory and analyzed within 24 hours. The analysis methods are those recommended by international standards ISO 5667-3: 2003 [58] and by Rodier [59,60].
These analyses focused on the variables indicative of the presence of pollutants in the water. Among these variables, we can cite pH with 156 measurements over a period of 13 years (pH, Organic Matter (OM), Ammonium
 , Phosphates
 , Nitrites
 , Nitrates
 and Dry Residues (DR) with 156 measurements for each variable over a period of 13 years (from January 1998 to December 2010), Dissolved Oxygen (DO) with 72 measurements over a period of 6 years (from January 2005 to December 2010) and Biological Oxygen Demand (BOD5) and Chemical Oxygen Demand (COD) with 144 measurements for each variable over a period of 12 years (from January 1999 to December 2010).
Outliers were not eliminated from the time series studied due to the robustness and insensitivity of the methods used in trend analysis.
3.2 Methods
In the present study, methods based on nonparametric tests and graphical analyses were used to identify trends in the time series considered.
Webel-Ollech test
Before proceeding with the identification of trends, it was necessary to verify the presence of seasonality in the chronological series. For this, the Webel-Ollech (WO) overall seasonality test was carried out. This test is based on the results of various seasonality tests. The WO test indicates the presence of seasonality if the QS test on the ARIMA residues is significant at the 1% level, or if the Kruskall Wallis (KW) test on the ARIMA residues is significant at the 0.1% level. The WO test also indicates the presence of seasonality if the QS test (standard) and the KW test on ARIMA residues are both significant at the 1% level as shown in Equations (1) and (2).
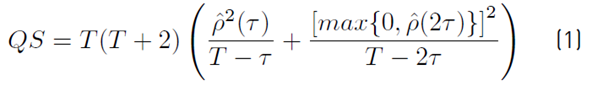
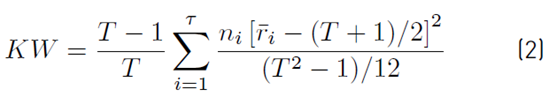
Where T is the size of the series,
 the autocovariance, τ the number of observations per year, i = 1,…, τ with n observations, and
 the mean rank of observations during the period i.
Mann-Kendall trend test
The nonparametric Mann-Kendall test was performed to identify trends in the time series. Nonparametric methods are robust and more suitable in the analysis of water quality data with non-normal distributions and presenting missing values.
If seasonality is not identified by the WO test, then it is best to apply the ordinary Mann-Kendall trend test. This test can be used for non-seasonal data. Note that the result obtained is only a rough indicator for the confirmation of the presence of a monotonic trend in the time series [21].
[21] suggested using Kendall's tau significance test as a trend test where the variable X represents time as shown in Equation (3).

Where sgn is the sign or signum function. The mean of S is µ = 0. The variance including the correction term for ties is given as:
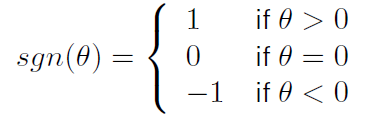
A positive value of S indicates that there is an uptrend in which observations increase over time, while a negative value of S means that there is a downward trend, as it is well known that S is asymptotically normally distributed and has a mean of zero and a variance given by Equation (4).
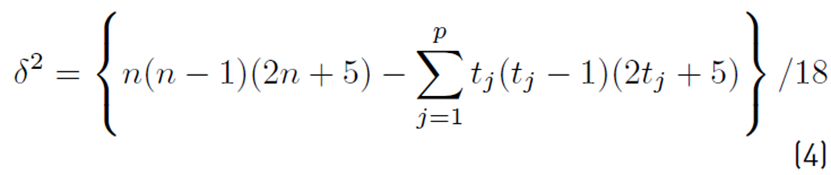
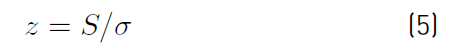
Where p is the number of tied groups in the data set and t j is the number of data points in the j th tied group. The statistic S is approximately normally distributed, as shown in Equation (5).
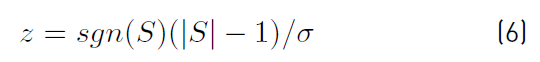
If continuity = TRUE, then a continuity correction will be employed as shown in Equation (6).
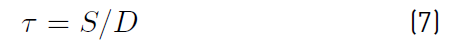
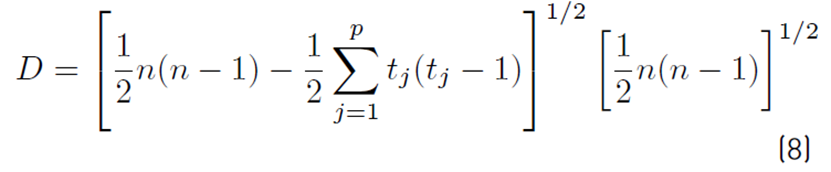
The statistic S is closely related to Kendall’s τ is shown in Equation (7).
With D shown by Equation (8)..
Seasonal Mann-Kendall Trend Test
Seasonality indicates that the distributions of data differ according to the times of the year. The Mann-Kendall test is sensitive to seasonality. There is a modification of Mann-Kendall test in order to detect whether or not a seasonal time series contains an overall trend component. They used the Mann-Kendall test for each of the m seasons separately, and the results obtained were then combined [22].
The Mann-Kendall statistic for the season g [22] is given by Equation (9).
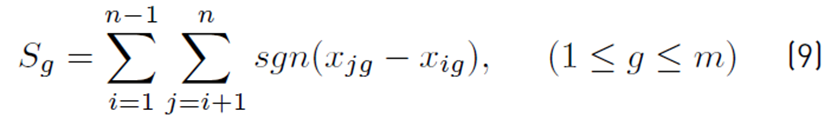
Where sgn is the signum function. The mean of
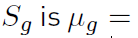 0. The variance including the correction term for ties is shown in Equation (10) .
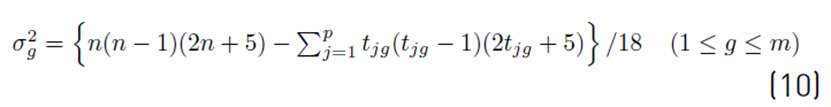
The seasonal Mann-Kendall statistic for the entire series is then calculated according to Equation (11) .
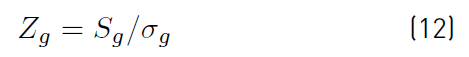
The statistic
 is approximately normally distributed, as shown in Equation (12).
If continuity is equal to TRUE, then a continuity correction will be utilized as shown in Equation (13).

The R language trend package, possessing the functions of the Mann-Kendal test, was applied.
It is worth specifying that the null hypothesis (H0) can only be accepted if there is not a monotonic trend in the time series. In addition, the alternative hypothesis indicates that there is a significant trend. The result of the Mann Kendall test is therefore either accepted or rejected depending on hypothesis H0.
Theil-Sen slope
The slope of the trend line was first estimated on the basis of surveys conducted [61,62], as indicated in the following equation:
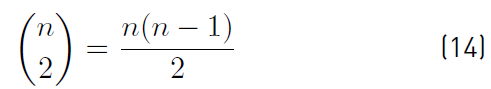
The Theil-Sen estimator consists in calculating all the slopes between the pairs of possible points as shown in Equation (14) whose median represents the slope of the regression line in Equation (15) .
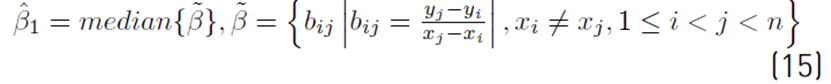
The positive value of ˆ β 1 indicates an increasing trend, and a negative value implies a decreasing trend.
The Theil-Sen estimator is robust because it is not influenced by the presence of outliers in time series. In our study, the Theil-Sen function of the “openair” R language package was used for seasonally adjusted time series.
4. Results and discussion
4.1 Descriptive statistical analysis of data
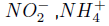
The box plots made it possible to summarize the statistical information in a simple and visual way on all the time series of the physico-chemical variables studied. These graphs allowed identifying the outliers that correspond to each physico-chemical variable during the periods under study. Indeed, all the time series considered include outliers. In addition, it is easily noted that the distribution of observations for almost all the variables is asymmetric and presents a clear dispersion [Figure 2].
The box plot of the volume of water stored in the dam during the period studied also presents outliers with a strong dispersion.
The histograms in Figure 3 also show that the outliers for all of the physico-chemical variables considered. The isolated bars in the histograms represent outliers. It could also be observed that the distribution of measurements is almost asymmetric for the majority of variables.
4.2 Mann-Kendall trend test
Table 1 summarizes the results on the analysis of the trends of the physico-chemical variables of the water of Cheurfas II dam, as well as the trend of its water volume obtained by the Mann-Kendall trend test.
Mann-Kendall's monotonic trend test revealed statistically significant increasing trends in the variables of dry residues (DR), organic matter (MO), PO4 and DO. Indeed, the tau values of the Mann-Kendall statistic estimated for these variables were found to be positive and the p-values were less than 0.05, which confirms the rejection of the null hypothesis (p-value is between 2.2 * 10-16 and 0.001643). This is contrary to the variables BOD5, COD and
 which provided negative tau values with a p-value between 0.0107 and 1.024 *10-5. This indicates the presence of the downward trend in the time series of variables BOD5, COD and
 Furthermore, no trend was identified for
 and pH, which means that the null hypothesis is accepted with a p-value between 0.1061 and 0.9231.
Furthermore, the volume of water stored in the dam shows a significant upward trend with a p-value equal to 5.278 *10-8. The increase in the amount of rain received by Cheurfas II dam watershed, especially during the last two years (2009 and 2010), has certainly generated a marked increase in the volume of water stored in the dam [Figure 4].
These results allow us to conclude that the majority of the time series analyzed by the Mann-Kendall trend test showed overall monotonic trends, with the exception of
 and pH which did not show any trend.
4.3 WO seasonality test and the seasonal Mann-Kendall trend test
It is important to check whether seasonality can be identified in the time series by the WO test, before performing the Mann-Kendall test for assessing the seasonal trend of the time series studied. The WO test did not show any seasonality for the majority of variables, except for phosphates and the volume of water in the dam, which both showed a seasonal variation [Table 2].
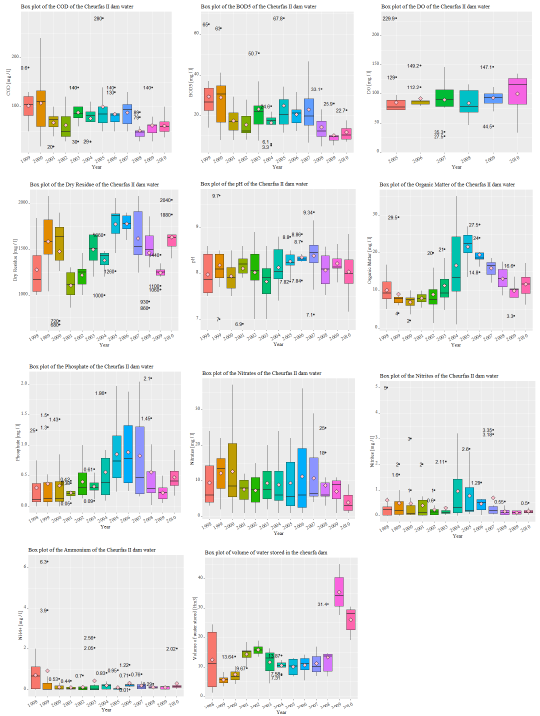
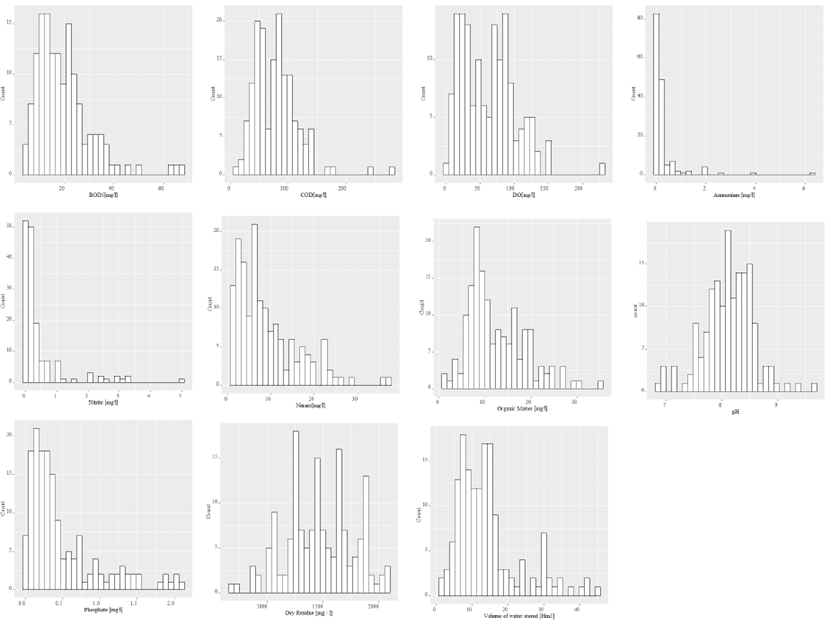
Table 1 Mann-Kendall trend test for Cheurfas II Dam through the period 1998 - Dec2010 (Kendall’s tau: statistic tau, two-sided p-value; S: Kendall Score; varS: variance of S)
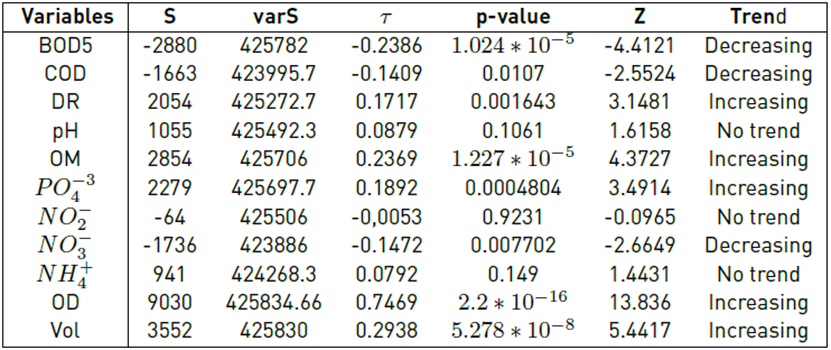
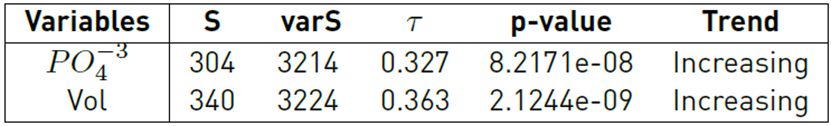
Table 3 clearly indicates that the Seasonal Mann-Kendall trend test applied to the two-time series of phosphates and water volume, which both suggest a seasonal variation, showing increasing trends with very low p-values (8.2171e- 08 and 2.1244e-09).
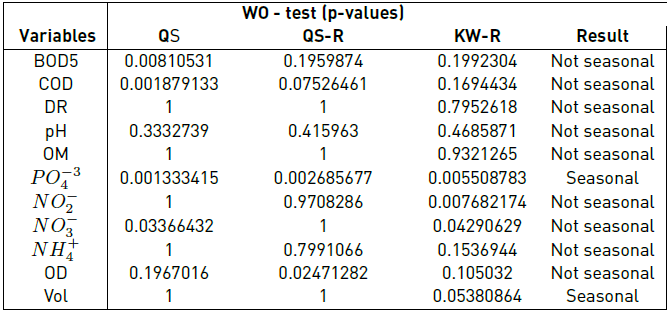
Table 3 Seasonal Mann-Kendall trend test of the time series of phosphates and water volume of Cheurfas II dam
Interpretation of the Theil-Sen slope estimator results
The estimation of the slope of the trend lines for all the variables studied was carried out using the Theil-Sen estimator of the "openair" package [51].
Using this function makes it possible to seasonally adjust the monthly concentration, estimate the overall trend per year, evaluate the confidence intervals of the 95% slope, and finally determine the significance level of the trend (0.001, 0.01, 0.05, 0.1).
4.4 Potential of hydrogen (pH)
The graph to the left of Figure 5 shows the pH values generally observed within an acceptable range between 7 and 8.7. The average pH values, estimated during the wet and dry seasons, are approximately equal to 8.07 and 8.15, respectively, indicating that the water carried by the Mekerra Wadi to Cheurfas II dam is slightly basic. This is due, on the one hand, to the nature of soils that are mainly composed of deep calcareous brown soils which are not acidic and have a pH greater than 6.8 [57], and on the other hand, to the leaching of water along the Wadis in agricultural areas which may generally contain basic fertilizers, contributing to the alkalinity of the dam water.
The pH shows an overall increasing trend that is equal to 0.02 per year at a significance level of 0.1. The slope is between 0 and 0.04 within a 95% confidence interval [Figure 5: The solid black line shows the slope of the trend line and the dotted lines indicate the 95% confidence intervals. This estimate is based on the re-sampling bootstrap method).
4.5 Dissolved oxygen
The mean DO value, expressed as percent saturation during the wet season, was 83.04%, which means that the oxygen level is excellent for most running water organisms. However, a maximum value of 147.1% was noted for the same season. This concentration may seriously affect aquatic life. On the other hand, the minimum value was found equal to 10.8%, a value much lower than the standard 60% value [63]. Similar conclusions for the dry season may be deduced from the wet season. The estimated average value was 98.47%. The maximum and minimum values were respectively 149.2% and 10.2%.
The graph to the right of Figure 5 shows an increasing trend in DO at a significance level of 0.1. Its overall trend is estimated at 2.15% per year, for which the slope is contained within the range between -0.22% and 4.52% in a 95% confidence interval.
4.6 BOD5 and COD
The BOD5 contents of Cheurfas II dam water are between 4.9 and 38.6 mg / l, with an average value of 19.16 mg / l during the wet season, which greatly exceeds the maximum limit of the acceptable water quality range (5 to 10 mg / l). However, in the dry season, the levels range from 6.3 to 42.49 mg / l, with an average value of 19.77 mg / l, which is almost equal to that in the wet season.
As for the COD contents, they are between 20 and 140 mg / l. The average content is 76.78 mg / l during the wet season and can reach 83.11 mg / l during the dry season. For the most part, the values are between 20 and 140 mg / l, while the standard content for drinking water is 4 mg / l.
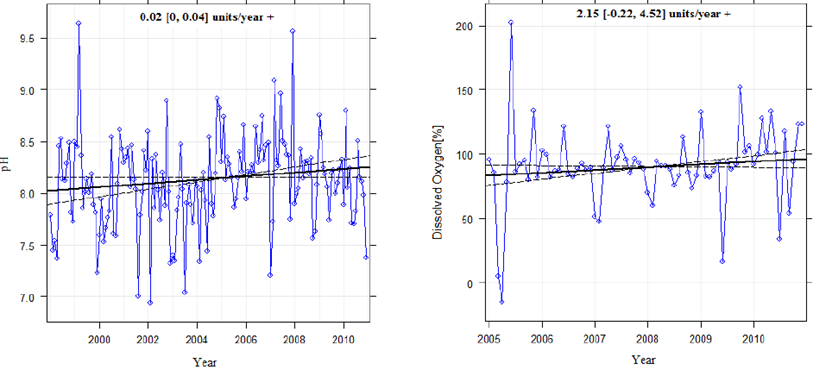
Figure 5 Confidence intervals and the threshold of significance of the Theil-Sen slope of trends in pH and DO
These levels indicate that the water of Cheurfas II dam is of poor quality.
Furthermore, the variables BOD5 and COD showed decreasing trends at significance levels of the order of 0.001 and 0.05, respectively [Figure 6]. The overall BOD5 trend is -0.82 (mg / l) per year. The slope is contained within the 95% confidence interval [i.e., -1.21 to -0.43 mg / l]. As for the overall COD trend, it is equal to -1.7 (mg / l) per year and the slope is estimated between 3.21 and -0.3 mg / l within the 95% confidence interval.
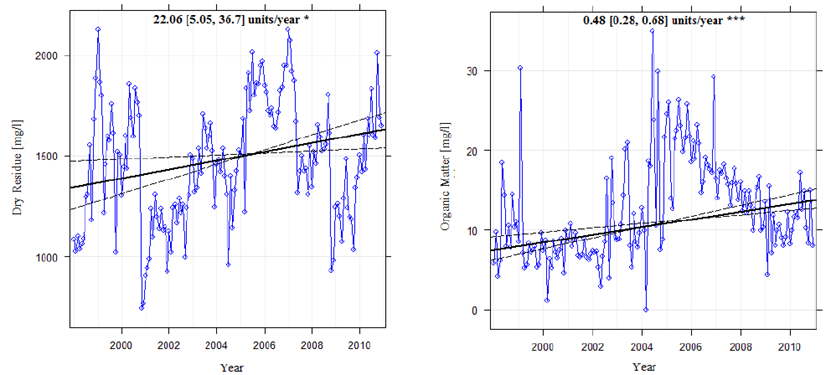
4.7 Dry residues
The average concentration of dry residues (RS) can reach 1428.35 mg / l during the wet period, with a maximum value of 2080 mg / l and a minimum value of 680 mg / l. However, it is around 1504 mg / l during the dry period, with an average value at 1503.81 mg / l; the contents fluctuate between 1000mg / l and 2060 mg / l. It is clearly understood that these values indicate high mineralization of the water of Cheurfas II dam due to the decomposition of organic matter and to fertilizers from agricultural soils upstream of the dam brought by surface water runoff. It should be noted that these high concentrations are within the range of poor quality water between 1200 mg / l and 2000 mg / l.
The graph to the left of Figure 7 indicates an overall upward trend for dry residues (DR). This trend is 22.6 (mg / l) per year at a significance threshold of 0.05. The slope is between 5.05 and 36.7 (mg / l) per year within the 95% confidence interval.
4.8 Organic matter
The average concentration of organic matter (OM) was 12.20 mg / l during the wet period with a maximum value of 29.5 mg / l and a minimum value of 1 mg / l. As for the dry period, the average was 12.75 mg / l, with OM contents fluctuating between 1.3 and 35 mg / l.
The graph to the right of Figure 7 shows an overall upward trend for OM. It is 0.48 (mg / l) per year at a significance threshold of 0.001 with a slope of 0.28 to 0.68 mg / l in a 95% confidence interval. This is not the case for variables BOD5 and COD, which showed a downward trend.
Furthermore, it is worth mentioning that organic matter comes naturally from the decomposition of vegetation carried towards the dam by the runoff water. This OM also comes from human waste, animal waste and food processing waste.
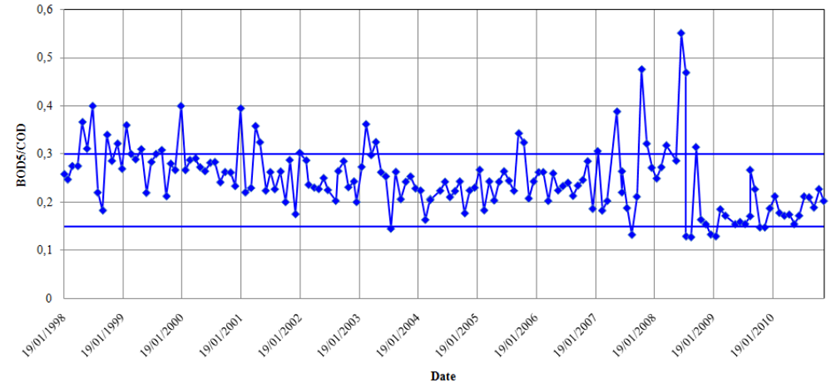
The graph in Figure 8 shows that the BOD5 / COD ratios are generally between 0.15 and 0.3, which indicates that the wastewater discharged into the catchment area of Cheurfas II dam is hardly biodegradable. In this case, the possibility of self-purification, which mainly concerns the water of Mekerra Wadi feeding Cheurfas II dam, is inadequate. Therefore, the biodegradation does not take place, and water cannot, consequently, be biologically treated, because this wastewater probably comes from industrial activities, which prevents the metabolic activity of bacteria due to their toxicity or refractory properties [64].
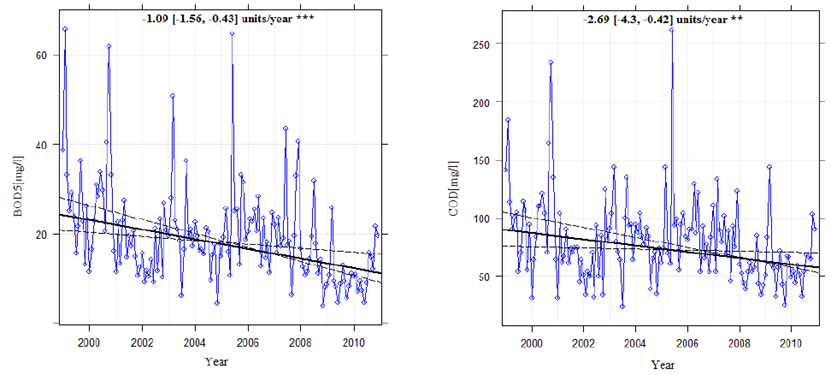
Figure 6 Confidence intervals and significance level of the Theil-Sen slope of trends for BOD5 and COD
4.9 Nitrates
The average nitrate content is 7.19 mg / l during the dry season, but can reach 11.048 mg / l during the wet period. Note that the World Health Organization [65] allows a limit of 10 mg / l in beverages. Overall, the nitrate contents fluctuate between 0.02 mg / l and 37mg / l, with maximum levels observed during the month of February.
The levels of nitrates recorded in the surface water of the dam are acceptable based on the water quality grid (10 mg / l - 20 mg / l) recommended by the National Agency for Hydraulic Resources (ANRH). This indicates that the waters under study are not subject to a risk of pollution by nitrates and are therefore of acceptable quality. The graph to the left of Figure 9 shows an overall decreasing trend for nitrates (NO3). It is estimated at -0.23 (mg / l) per year at the 0.1 significance threshold. The slopes are between -0.44 and -0.01 mg / l within the 95% confidence interval.
The decline in nitrate levels may be due to the decrease in the use of nitrate-based fertilizers in agricultural soils along the Mekerra Wadi. It is worth indicating that the use of fertilizers in Algeria fell very sharply during the period 1987-1998 due to the absence of subsidies[66].
The abrupt drop in the use of fertilizers, which was particularly marked between 1995 and 1998, is probably due to the lack of ammonium nitrate on the market (for national security reasons). This may explain the downward trend for nitrates and the upward trend for phosphates due to the use of phosphate-based fertilizers.
4.10 Nitrites
The average nitrite concentration is 0.514 mg / l with a maximum value of 3.35 mg / l and a minimum value of zero. This concentration drops to 0.383 mg / l during the dry period. The nitrite contents during that period fluctuate between 0 and 5 mg / l. The high concentrations of nitrites are probably due to the use of agricultural fertilizers, intensive livestock activities, runoff of water laden with nutrients to the dam, and wastewater discharges into the Wadis. Note that nitrites do not show any trend (0 mg / l per year); the slopes are between -0.01 and 0.01 mg / l within the 95% confidence interval (graph on the right of Figure 9].
4.11 Phosphates
The PO43- contents vary between 0 and 1.51 mg / l with an average concentration of 0.58 mg / l during the wet season; it can drop to 0.39 mg / l during the dry season though these values exceed those of the good quality water range (0 - 0.010 mg / l).
The high concentrations of phosphate are responsible for the hyper-eutrophic conditions of the waters of Cheurfas II dam [67]. These concentrations, which can vary between 0.005 and 0.02 mg / l, do not comply with the surface water standards set by the WHO (1984) and EPA (2003).
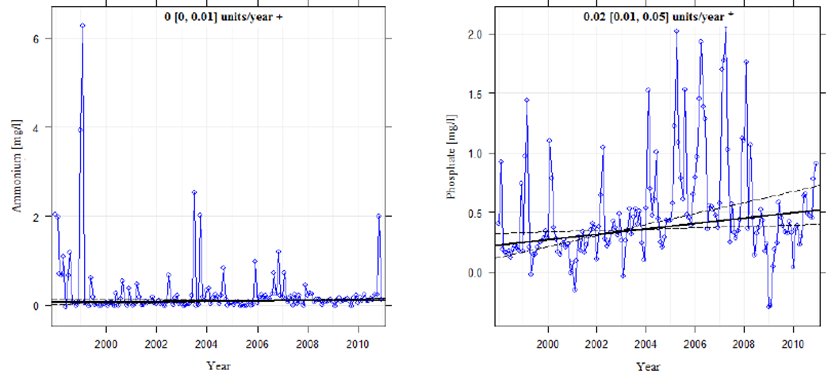
The graph to the right of Figure 10 shows a net overall increasing trend for PO4-. It is 0.02 (mg / l) per year at a significance level of 0.001. The slope is between -0.01 and 0.03 mg / l within the 95% confidence interval. This increase can be explained by the presence of agricultural areas all around the study site, with the plain of Sidi-Bel-Abbes upstream of the dam. phosphates found in the environment generally come from industrial, agricultural (fertilizers), dung, etc. [68].
4.12 Ammonium
The average ammonium concentrations, during the wet and dry seasons, are approximately equal to 0.36 mg / l and 0.21 mg / l, respectively. These concentrations are above the upper limit of the acceptable water quality range (0.01mg / l to 0.1mg / l). The graph to the left of Figure 10 shows a slight upward trend for NH4+ at the significance level of 0.1. The slope is contained within the 0 to 0.01 range in the 95% confidence interval.
According to the agricultural services of the Wilaya of Sidi-Bel-Abbes, sheep farming is one of the most important animal production sectors in the Upper Mekerra watershed. Cattle and poultry farming is also predominant in this sector, but with lesser importance. It was revealed that this activity is responsible for the production of nitrogen in considerable quantities. It can reach more than 980 tons of nitrogen per year [54].
The presence of nitrogenous matter in the waters of Cheurfas II dam is attributable to organic fertilizers such as manure and slurry. These are transported to the Wadis by the runoff of nitrogen-laden water that mainly comes from plant waste, which is left on the ground after each harvest, and from animals. They can also come from the use of fertilizers containing nitrogen, phosphate and potassium, carried by runoff.
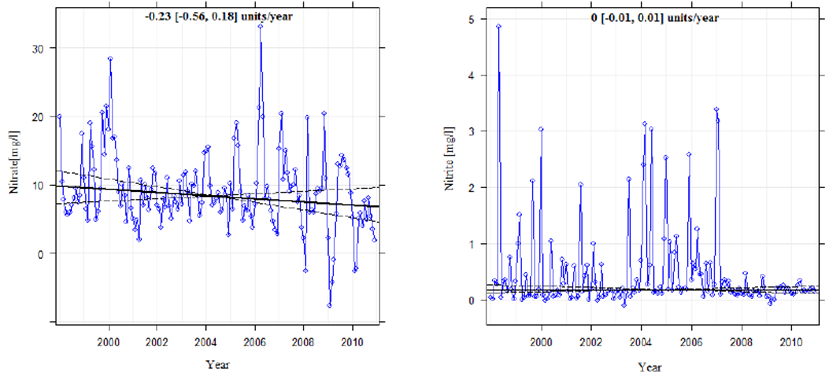
Figure 9 Confidence intervals and significance level of the Theil-Sen slope for the trends of nitrates and nitrites
5. Conclusions
This study made it possible to analyze the temporal evolution of the physico-chemical quality of water from Cheurfas II dam. The analysis of the recorded data revealed that the main sources of degradation of the water quality of this dam are attributed to the direct discharges of domestic wastewater from several municipalities located along the Mekerra Wadi, to water runoff loaded with nutrients from agricultural lands and industrial effluent discharges. Almost all levels of the variables indicative of the presence of pollution do not comply with surface water quality standards.
Mann-Kendall's monotonic trend test revealed statistically significant upward trends in DR, OM, PO4 and OD and downward trends in BOD5, COD, and
 However, no trend was identified for
 ,
,
 and pH. It should also be noted that the volume of water stored in the dam showed a significant upward trend linked to the increase in the quantity of rain received by the catchment area of Cheurfas II dam.
It is worth mentioning that the WO test did not reveal any seasonality for the majority of variables, except for phosphates and the volume of water stored in the dam for which the seasonal Mann-Kendall trend test showed significant upward trends.
Furthermore, the Theil-Sen slope estimator provided trends similar to those obtained by the Mann-Kendall trend test for nearly all the variables studied, i.e., BOD5, COD, PO43 -, DO, OM, NO2, DR and Vol, except for pH, NO3 - and NH4 +.
Indeed, the pH showed an upward trend at a significance level of 0.1; NO3 - showed no trend, while NH4+ showed a slight upward trend at a significance level of 0.1.
Likewise, the BOD5 / COD ratio showed values within the range from 0.15 to 0.3, indicating that the natural biodegradability of water is difficult to achieve.
The average contents of most variables, during the two dry and wet seasons, largely exceed the normative surface water quality standards because the catchment area of Cheurfas II dam receives water loaded with organic pollutants caused by multiple domestic, industrial and agricultural activities.
Cheurfas II dam can thus be viewed as a case study of significant importance for the method developed in this article. This method could be applied to other water bodies for the purpose of analyzing the main indicators of surface or groundwater quality.

