


 English (pdf)
 Article in xml format
 Article references
 Send this article by e-mail
 Cited by SciELO
  Cited by Google
  Similars in
SciELO
Similars in
SciELO  Similars in Google
 Permalink
1. Introduction
Anaerobic digestion (AD) is a process that degrades organic matter and produces biogas and a digested sludge rich in nutrients [1-3] using anaerobic microorganisms in an environment free of gaseous oxygen and at a controlled temperature [4]. AD is a technology used to eliminate waste with a high organic fraction. It also reduces odors and greenhouse gas emissions, making it an attractive method for treating organic waste and satisfying energy demand [7,8]. Biogas is mainly composed of methane (CH4, 60%-70% composition) and carbon dioxide (CO2, 30%-40% composition) [9]. Due to the microbiological nature of the anaerobic digestion process, it is essential to study the effects of different factors on the kinetics of methane yield [10-12]. In AD, the degradation process is biological and divided into four metabolic stages: hydrolysis, acidogenesis, acetogenesis, and methanogenesis [Figure 1] [13-15].
Due to its high biodegradability, food waste (FW) is an adequate substrate for AD [16]. The composition of FW is mainly: carbohydrates (0.0-59.0% of total solids [TS]), proteins (1.4-38.9% TS), and lipids (0.1-41.5% of TS) [9].
The organic components (carbohydrates, proteins, and lipids) have different theoretical methane ygields ranging from 0.200-0.670 Nm3CH4/kgVS (VS: volatile solids) and their biological stability depends on the degradation of organic matter[17,18]. The lipid-rich wastes present a high theoretical methane yield, with values of up to 1.014 Nm3CH4/kgVS, higher compared to carbohydrates (0.370 Nm3CH4/kgVS for glucose) and proteins (0.740 Nm3CH4/kgVS) [9]. However, the methane yields of real substrates are lower [5] due to their composition [19]; low organic load; acidification; nutrient imbalance; poor damping capacity; high concentrations of inhibitory or recalcitrant substances leading to unstable processes [12].
Anaerobic co-digestion (ACoD) is a strategy to reduce inhibitions and instabilities in the AD process. The mixture of two or more substrates compensates for nutrient deficiencies and reduces the concentrations of inhibitory and recalcitrant compounds [20,21]. Other uses of ACoD are pH stabilization, carbon/nitrogen (C/N) ratio optimization, as well as buffer capacity enhancement [22,24]. The implementation of ACoD reduces retention time, higher removal of volatile solids, and higher methane yield [25,26].
The mixture of residues rich in carbohydrates, proteins, and lipids present synergistic effects that improve the kinetics of the degradation process [17]. Synergistic effects refer to the increase in the amount of methane produced compared to the sum of the contributions of the substrates [1,21]. The C/N ratio is a fundamental parameter to define the synergistic effect on ACoD, since an optimal C/N ratio will allow the subsistence of microbial populations [22]. The literature calls antagonism the adverse effects caused by cosubstrates. For example, the increase in the organic load rate reduces biogas production [27]. Therefore, the implementation of mathematical models oriented towards estimating the mixing effect is a viable alternative to predict methane yield in ACoD [5]. Mathematical models have become a fundamental tool to predict system performance, improve production, as well as prevent failures and process instability [27]. The literature describes several models, among which kinetic models, statistical models, computational fluid dynamics models, and other models with algorithmic approaches stand out [28].
Currently, the focus on the kinetics of the anaerobic digestion process allows to evaluate the performance of AD systems and predict the methane production and, therefore, improve the understanding of the process [8,19]. The literature reports various kinetic models, oriented towards the estimation of process kinetic constants that can vary when different models and substrates are used [29]. Thus, for the development of a ACoD model for the prediction of the effect of the mixture of substrates, it is important to previously study the kinetics of the methane yield of each substrate independently [10].
For this reason, it is significant to evaluate the behavior of the ACoD of mixtures of organic waste to maximize the obtaining of methane. This research aims to analyze the mixing effects in the anaerobic digestion process by describing the kinetic coefficients obtained from an additive model and their comparison with experimental coefficients from the literature.
2. Materials and Methods
2.1 Data obtention
This investigation used data from four investigations [10,12,22,23]. These investigations presented information on the coefficients of the methane yield kinetic models adjusted for the digestion of monosubstrates and cosubstrates. The authors of the research carried out batch tests of the substrates: switchgrass (SG) and Spirulina platensis algae (SP) [10]; microalgae (M) and food waste (FW) [12]; cow manure (CM), meat and bone meal (MBM) and crude glycerol (CG) [22]; activated sludge residuals (ASR) and olive mill wastewater (OMWW) [23].
Table 1 presents the kinetic data for each substrate.
In general, the investigations evaluated the methane yield kinetics by the models: exponential, modified Gompertz, Fitzhugh, Cone, and the logistic equation.
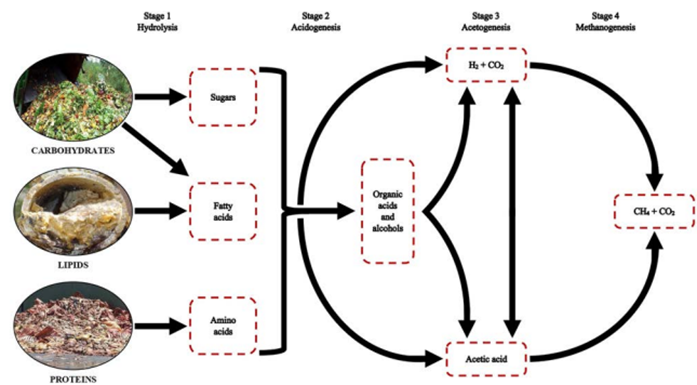
Table 1 Adjusted kinetic parameters for monosubstrates
| Substrate | Temperature (°C) | Adjusted Model | B 0 | k | n | R m | λ | Reference |
|---|---|---|---|---|---|---|---|---|
| SG | 35 | Cone | 129.95 | 0.090 | 2.04 | NA | NA | [10] |
| SP | 35 | Cone | 352.16 | 0.090 | 2.97 | NA | NA | [10] |
| SG | 50 | Cone | 174.75 | 0.160 | 2.57 | NA | NA | [10] |
| SP | 50 | Cone | 358.42 | 0.150 | 3.17 | NA | NA | [10] |
| M | 35 | Cone | 94.60 | 0.262 | 1.56 | NA | NA | [12] |
| FW | 35 | Cone | 679.80 | 0.126 | 1.30 | NA | NA | [12] |
| CM | 38 | Gompertz | 160.00 | NA | NA | 30.00 | 1.23 | [22] |
| MBM | 38 | Gompertz | 370.00 | NA | NA | 60.00 | 2.56 | [22] |
| CG | 38 | Gompertz | 610.00 | NA | NA | 20.00 | 4.94 | [22] |
| ASR | 55 | Gompertz | 111.50 | NA | NA | 10.30 | 2.18 | [23] |
| OMWW | 55 | Gompertz | 7.13 | NA | NA | 0.99 | 3.05 | [23] |
NA: Not applicable
The fits of the experimental data of the substrates CM, MBM and CG [22]; ASR and OMWW [23] pointed towards the modified Gompertz model (1), unlike SG and SP [10]; M and FW [12] who pointed to Cone's model (2).
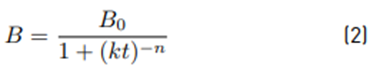
Where: B is the methane yield (Nml/gVS); B 0 is the maximum methane yield (Nml/gVS); k is the reaction kinetic constant (1/d); t is the digestion time (d); R m is the maximum methane rate production (ml/gVS/d); λ is the lag phase time (d); and n is the shape factor (adimensional). Table 2 presents the substrates mixtures and the adjusted parameters of the kinetic models.
2.2 Information processing
Pagés-Díaz, Pereda-Reyes [30] estimated the maximum methane yield of a mixture with the contributions of the volatile solid fractions of each substrate and their interactions. The evaluation of the methane yield kinetics of the mixtures considered a model (3) depending on the fraction provided by each substrate, and on the kinetic coefficients of each monosubstrate as mentioned by [31].
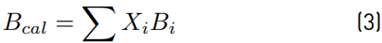
Where: X i is the volatile solid fraction contributed by the ith substrate in the mixture; B i corresponds to the methane yield of the ith substrate at a given time and according to the adjusted kinetic model (1) or (2).
Table 2 Adjusted kinetic parameters for the cosubstrates
| Mixture | Substrates | Proportion | B 0 | K | n | R m | λ | Reference |
|---|---|---|---|---|---|---|---|---|
| M1 | SG:SP | 0.87:0.13 (1) | 147.08 | 0.10 | 1.98 | NA | NA | [10] |
| M2 | SG:SP | 0.67:0.33 (1) | 200.53 | 0.10 | 2.43 | NA | NA | [10] |
| M3 | SG:SP | 0.87:0.13 (2) | 201.76 | 0.17 | 2.25 | NA | NA | [10] |
| M4 | SG:SP | 0.67:0.33 (2) | 239.20 | 0.18 | 2.34 | NA | NA | [10] |
| M5 | M:FW | 0.80:0.20 (1) | 372.80 | 0.070 | 0.70 | NA | NA | [12] |
| M6 | M:FW | 0.60:0.40 (1) | 420.30 | 0.147 | 1.32 | NA | NA | [12] |
| M7 | M:FW | 0.50:0.50 (1) | 556.50 | 0.131 | 1.40 | NA | NA | [12] |
| M8 | M:FW | 0.40:0.60 (1) | 601.40 | 0.137 | 1.40 | NA | NA | [12] |
| M9 | M:FW | 0.20:0.80 (1) | 716.50 | 0.124 | 1.62 | NA | NA | [12] |
| M10 | CM:MBM:CG | 0.90:0.10:0.0 (1) | 250.00 | NA | NA | 50.00 | 0.85 | [22] |
| M11 | CM:MBM:CG | 0.67:0.33:0.0 (1) | 260.00 | NA | NA | 50.00 | 0.87 | [22] |
| M12 | CM:MBM:CG | 0.50:0.50:0.0 (1) | 280.00 | NA | NA | 30.00 | 0.60 | [22] |
| M13 | CM:MBM:CG | 0.34:0.66:0.0 (1) | 330.00 | NA | NA | 40.00 | 4.32 | [22] |
| M14 | CM:MBM:CG | 0.5:0.37:0.13 (1) | 330.00 | NA | NA | 40.00 | 4.32 | [22] |
| M15 | CM:MBM:CG | 0.5:0.25:0.25 (1) | 370.00 | NA | NA | 30.00 | 5.00 | [22] |
| M16 | CM:MBM:CG | 0.5:0.13:0.37 (1) | 470.00 | NA | NA | 30.00 | 8.74 | [22] |
| M17 | ASR:OMWW | 0.875:0.125 (2) | 459.85 | NA | NA | 19.72 | 10.77 | [23] |
| M18 | ASR:OMWW | 0.75:0.25 (2) | 348.39 | NA | NA | 9.91 | 13.14 | [23] |
| M19 | ASR:OMWW | 0.50:0.50 (2) | 104.09 | NA | NA | 4.99 | 5.07 | [23] |
| M20 | ASR:OMWW | 0.25:0.75 (2) | 86.25 | NA | NA | 2.80 | 4.18 | [23] |
| M21 | ASR:OMWW | 0.125:0.875 (2) | 24.53 | NA | NA | 1.63 | 4.83 | [23] |
(1): Mesophilic
(2): Thermophilic
NA: Not applicable
Finally, the processing of the methane yield values of the additive model included the adjustment of the results with the models (1) or (2) to compare with the adjusted coefficients from the percentage of variation (4).
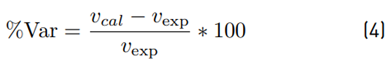
Where v cal refers to the estimated parameter with the additive model and v exp is the parameter fitted with experimental values.
2.3 Results and discussion
The information collected from the kinetics of the monosubstrates allowed the evaluation of the model (3). Figure 2 presents the curves corresponding to the cases analyzed.
Figure 2(A) presents a similar behavior of the additive model and the experimental data without synergistic or antagonistic effects. In Figure 2(B), all the experimental curves place their maximum methane yields above those estimated by the models, which indicates a synergistic effect on the total methane production. Figures 2(C) and 2(D) present the modeled curves and the experimental data with different adaptation times and maximum methane yields. Table 3 presents the adjustment coefficients of the Cone (M1-M9) and modified Gompertz (M10-M21) models with the data obtained with the additive model, and their variation in relation to the experimental data.
Brown [32] considers that a variation of 30% is indicative of differences; this research considered coefficient variations from 10%. Although, negative coefficients of variation denote an increase in the experimental value, the analysis depends on the physical meaning of each parameter. Whereby, negative values of the coefficients B 0 , k, and R m , refer to synergistic effects. In the case of the coefficients n and λ, negative values of the coefficient of variation indicate antagonistic effects.
According to El-Mashad [10], none of the mixes (M1-M4) presented synergistic or antagonistic effects and indicated the limitation of the hydrolysis process due to the content of structural carbohydrates of the SG (37% cellulose, 26.3% de hemicellulose, and 18.1% lignin), and their low protein content in comparison with the SP (8-16% carbohydrates and 46-71% proteins). The low methane production is due to the high content of lignin (24.9%). In the cases of mixtures M1-M4, the variations of B 0 , are lower than 10%; however, there are larger variations: 10% for k and n. Therefore, despite no synergistic or antagonistic effect on methane yield, there were effects on the reaction rate.
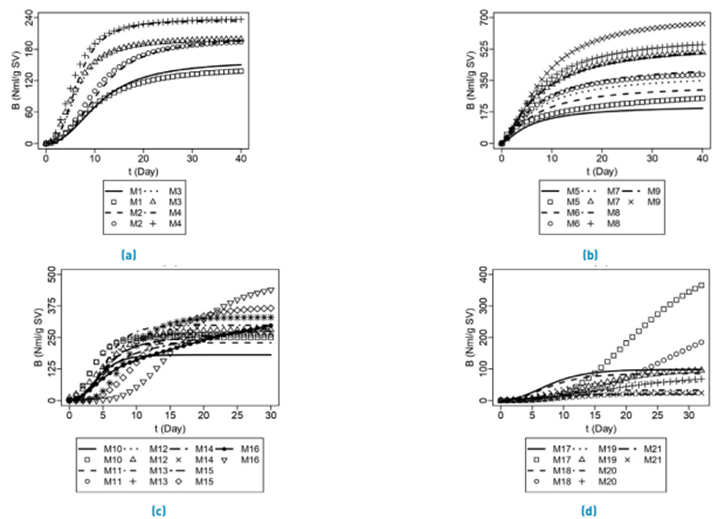
Figure 2 ACoD kinetics of experimental substrates (markers) and kinetics defined by the additive model (lines). (A) [10], (B) [12], (C) [22], (D) [23]
The shape factor (n) in M3 and M4 varied by 20%, referring to an early elevation of experimental data compared to the modeled curve. In addition, the thermophilic regime influenced the solubility and availability of nutrients. The variation of the values of n and k in the mixture M4 caused a displacement of the model, represented by the maximum methane yield after the experimental data.
In M5-M9 mixtures, [12] reported an increase in B 0 . In comparison with the model, the coefficient of maximum methane yield had a negative variation, with values between -21 to -43%, which denotes a synergistic effect. Zhen, Lu [12] attributes the synergistic effects in the mixtures to: (i) the high biodegradable fraction presented by the FW; and (ii) the increase in microbial load and diversity promoted the breakdown of the microalgae cell wall and biodegradability. The coefficients resulting from the additive model of the mixtures M5 and M9 present variations of the coefficients k and n. In the M5, M7, and M9 mixtures, a decrease is observed in their corresponding experimental values of k with a variation of 142.85%, 6.87%, and 4.83%, respectively. A high value of k did not imply higher methane productivity.
Regarding the coefficient n, only the M5 mixture decreased by 88.57%, reflected in the experimental curve that rises before the modeled curve. However, a higher fraction M in the mixture concerning FW reduced the form factor by half the estimated.
Andriamanohiarisoamanana, Saikawa [22] reported synergistic effects for mixtures M10-M16 on methane yield. Regarding the model, the binary mixtures M10-M13 (CM:MBM), increased the methane yield when the proportion of CM was higher than 67% in the mixture. Andriamanohiarisoamanana, Saikawa [22] considered that these effects were due to the low C/N ratio, mainly in the binary mixtures containing CM and MBM. This caused a decrease in the methane production rate and an increase in the lag phase time. In the M14-M16 mixtures, the increase in the C/N ratio by means of the addition of CG, increased the experimental values by 20% with respect to the estimated values of B 0 and R m . However, the increases in the lag phase time persisted with variations between 4 to 8 days.
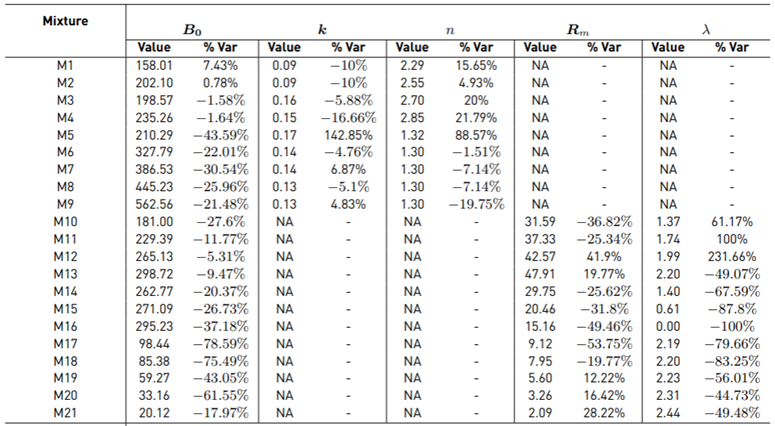
The M17-M21 mixtures presented increases in methane yields, with variations from 17% to 78%.
Maamri and Amrani [23] attribute the synergistic effect resulting from the increase in nutrients and trace elements by OMWW, which favored enzymatic processes. As in the previous cases, the starting point is the synergistic effect attributed to the C/N ratio. There are negative effects on the methane production rate, due to the oleic acid concentration present in OMWW; a prolonged lag phase time is also observed, due to the presence of polyphenolic compounds and long-chain fatty acids present in OMWW.
3. Conclusions
The literature analyzed related the synergistic and antagonistic effects directly to the methane yield. The methane yield kinetics obtained by means of the additive model makes it possible to establish that the mixture of substrates also influences lag phase times, methane production rates, and the first order constant.

