


 English (pdf)
 Article in xml format
 Article references
 Send this article by e-mail
 Cited by SciELO
  Cited by Google
  Similars in
SciELO
Similars in
SciELO  Similars in Google
 Permalink
1. Introduction
Spinal cord injuries cause complications of the urinary system such as flaccid neurogenic bladder and spastic bladder, which generate a lack of coordination between bladder contraction and sphincter relaxation. These dysfunctions cause urinary tract infections and kidney stones due to loss of micturition sensation and vesicourethral reflux[1,2]. The aim of urodynamics is to analyze bladder filling and emptying for the diagnosis of pathologies of the urinary system. Uroflowmetry is a medically approved technique for urodynamic studies that measure the volume of urine expelled per unit of time. This non-invasive method is complemented by ultrasound measurements to detect post-micturition urine residuals. The main disadvantage of uroflowmetry is that it cannot be applied to people with loss of micturition sensation[3]. Cystomanometry is another urodynamics approach that evaluates intravesical pressure variations and the bladder volume through a catheter used to control bladder filling and to record intravesical pressure [4]. The drawback of Cystomanometry is its invasive nature. The most used procedure to help patients evacuate urine is urethral catheterization; however, it generates risks such as infections and kidney stones [5,6]. For the previous reasons, it is necessary to use portable equipment to assist patients in determining bladder filling and avoid unnecessary catheterization due to the underestimation of bladder volume [5-7].
EBI is a promising method for monitoring tissue state and the functioning of organs in-vivo [8-10]; This technology is increasingly employed in the estimating and monitoring of bladder volume [11]. Schlebusch and collaborators [6,7,12] proposed the GI approach, which is linear and negatively correlated with bladder volume. The GI requires the reconstruction matrix that relates the pixels of an electrical impedance tomography (EIT) image with the estimated conductivity [13,14]. GI is obtained by summing all pixel values of the image vector. Another alternative for volume estimation consists of the sum of orthonormal tetrapolar potential measurements obtained from electrodes located around a target area. Other alternatives for volume estimation consider the tetrapolar measurements obtained from electrodes located around a target area. According to [12] and [14], both IRM and VCR exhibit a high correlation between volume and the tetrapolar measurements of impedance and voltage, respectively. Unlike GI, these approaches do not require an image reconstruction algorithm.
IRM, proposed in [12], estimates the volume of an object by employing three impedance measurements. This approach presents a higher sensibility when the object under study is close to the boundary electrodes. It implies that the application of IRM to little objects located far from the boundary electrodes is limited [12]. On the other hand, VCR [14] requires two nonhomogeneous and one homogeneous measurement to determine impedance changes. IRM, unlike VCR, does not require these two types of measurements. The accuracy of IRM and VCR indexes is highly dependent on the location of the electrodes [11,12]. The proposed MVCR approach employs redundant bioimpedance measurements based on the injection and measurement patterns proposed in [11], which are obtained by the system described in[15].
2. Mathematical background
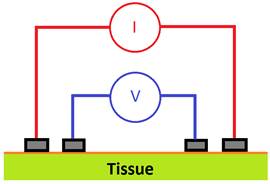
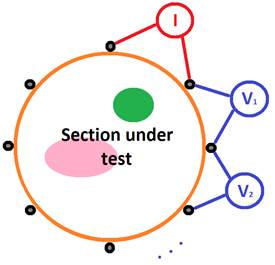
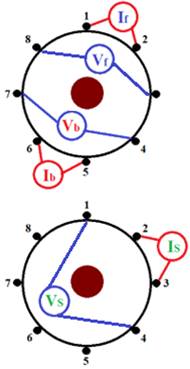
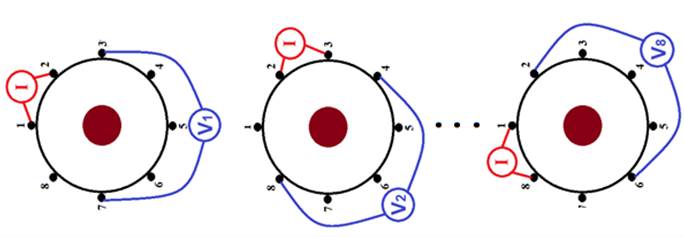
In humans, each fluid and tissue have different electrical properties. EBI estimation is done by measuring the voltage signal generated by a constant amplitude alternating current injected through boundary electrodes [12]. In this work, the tetrapolar approach for EBI measurement [Figure 1] is used to calculate the IRM, VCR, and MVCR indexes. On the other hand, the distribution of bioimpedance in a cross-section of the body is estimated using EIT [Figure 2]. Then, GI index is calculated by adding the pixels of the EIT image [13,14]. The GI, IRM, VCR, and MVCR are explained below.
2.1 Global impedance (GI)
The GI requires images of differential EIT (dEIT) [14-16], in which homogeneous (v
h
) and nonhomogeneous
 vector measurements are considered, and differences between v
h
and
vector measurements are considered, and differences between v
h
and
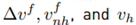
 are used in a dEIT reconstruction algorithm to calculate changes of the conductivity inside the object under study [6,12,14]. The variations in the potential for any frame f (with a range from 1 to N
f
) are calculated using Equation (1).
are used in a dEIT reconstruction algorithm to calculate changes of the conductivity inside the object under study [6,12,14]. The variations in the potential for any frame f (with a range from 1 to N
f
) are calculated using Equation (1).
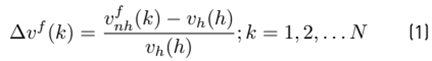
Being
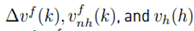 the k-th element of the vectors
 , respectively, and 𝑁 is the number of voltage measures per frame. The pixel conductivity vector I
f
, and the matrix R
f
are calculated using the Graz algorithm for EIT (GREIT), which it is the most accepted for researchers to image reconstruction of dEIT [17]. R
f
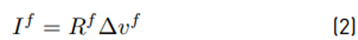
has M rows (number of pixels of the conductivity image) and N columns. Hence, the vector I
f
and v
f
are related by Equation (2).
, respectively, and 𝑁 is the number of voltage measures per frame. The pixel conductivity vector I
f
, and the matrix R
f
are calculated using the Graz algorithm for EIT (GREIT), which it is the most accepted for researchers to image reconstruction of dEIT [17]. R
f
has M rows (number of pixels of the conductivity image) and N columns. Hence, the vector I
f
and v
f
are related by Equation (2).
The dimensionless GI is calculated by adding the values of all I f pixels for each frame (Equation (3) ).
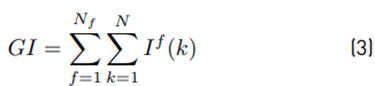
Considering that the measurement system had eight ports and because voltages at the three electrodes are not measured (injection electrode, drain electrode, and the nearest neighbor of the injection electrode), each frame contains N=40 voltages measurements. The GI is calculated from a 2D dEIT image of 32 by 32 pixels, using a finite element model of 37,412 elements implemented in Electrical Impedance and Diffuse Optical Tomography Reconstruction Software (EIDORS).
2.2 Impedance ratio method (IRM)
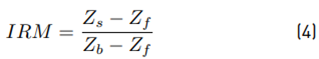
IRM relates volume to change in impedance. This technique estimates volumes independently of the conductivity of the object under study. The three tetrapolar measurements required to calculate the impedance ratio are presented in Figure 1 [12]. The frontal measurement is used to calculate
 the backward measurement defines
 and the side measurement determines
 . According to[12], the greatest sensibility to impedance variations is obtained when the object under study is close to the contour electrodes because, in such a configuration, current densities are maximized. Therefore, increasing the volume of the object implies a greater change in the sensitivity of impedance measurements. IRM is defined by Equation (4).
2.3 Voltage changes ratio (VCR) and Modified VCR
VCR associates the voltage change with the volume of the object under study [11]. This is calculated considering one reference measurement (V0) and one perturbed measurement (V) (Equation (5)]. The first is obtained when the studied object has the lowest volume, while the second is when this object has its highest volume
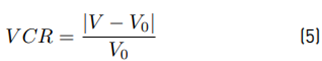
The electric potentials are measured considering the configuration shown in Figure 2.
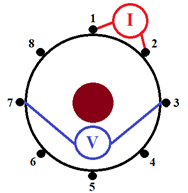
To reduce noise sensitivity, we propose to estimate volume using eight voltage measurements instead of one, and use the patterns indicated in Figure 3.
The MVCR index is calculated by Equation (6).
In the above equation, V0 is the voltage obtained when the current is injected through electrodes 1 and 2, and the studied object has the lowest volume. Like VCR, the voltages V i (i = 1 ... 8) are the potentials when the object is at its final volume [Figure 3]. Equations (3), (4), (5) and (6) show that IRM, VCR, and MVCR are dimensionless, just like GI.
3. Materials and methods
3.1 Measurement system
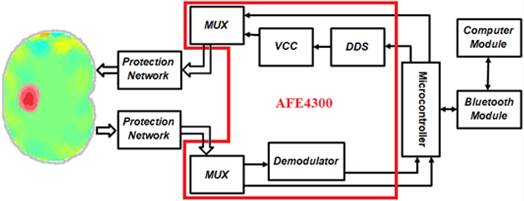
The experimental results presented in this study were obtained using an EIT system based on the AFE4300 analog front-end of Texas Instruments. This integrated circuit has eight ports for current injection and potential measurement [15]. The AFE4300 generates an alternating current of 50 kHz and 294.5 μArms through a voltage-controlled current source (VCC). The alternating signal is generated by an internal direct digital synthesizer (DSS) and a 6-bit and 1-MHz digital-to-analog converter (DAC). The potentials at the electrodes are measured by a demodulator, which can be configured to obtain only the amplitude of the sinusoidal signal (full-wave rectifier (FWR) mode) or the in-phase and quadrature (I/Q) components. Our experiments used the FWR mode because it is faster than the I/Q mode. The amplitudes are quantized to 16-bits using a delta-sigma analog-to-digital converter (ADC) with a clock frequency of 1 MHz [18]. The AFE4300 is connected to a PIC16F886 microcontroller, which in turn receives the injection and measurement patterns from a LabVIEW application through an HC06 Bluetooth module. The EBI system has a protection network composed of resistors and capacitors that eliminates the DC offset present in the current signals. The power to the EBI system is supplied by a 3.7V lithium polymer (LiPO) battery. The protection network, the current amplitude (294.5 μArms), and the LiPO power supply make this device compliant with the safety standard IEC60601 for medical equipment. Figure 4 shows the block diagram of the EIT system.
The injection and measurement patterns are configured through the ISW_MUX and VSENSE_MUX registers of the AFE4300 [19].
3.2 The environment of experimentation
Simulation experiments
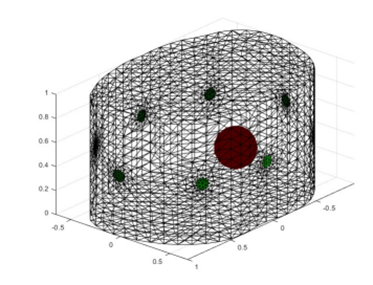
The first part of the present study was carried out through a finite element simulation, in which the bladder was represented by a sphere whose radius varied from 0.05 to 0.19 m with increments of 0.01 m. [Figure 5]. A ring of 8 electrodes was used to simulate current injection and the measurement of potentials. A previous work [20] shows details of this experiment.
In-vitro experiments
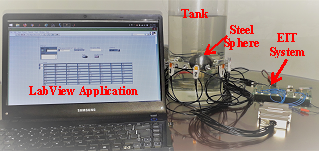
The in vitro experiments were performed in a cylindrical phantom with a radius of 15 cm and a height of 30 cm, which was filled with a 4 g/L saline solution. The 8 electrodes were symmetrically distributed around a ring surrounding the phantom. To simulate the bladder, three steel spheres with volumes of 0.028 𝑚 3 , 0.030 𝑚 3 , and 0.0314 𝑚 3 were placed one by one into the phantom. The center of each sphere was aligned with the center of the electrode ring. Also, the equator of the sphere and the ring of electrodes were in the same plane [Figure 6]. For each sphere, 30 voltage measurements were taken. The three data sets, one for each sphere, were used as the inputs for the volume estimation methods GI, IRM, VCR, and MVCR. For each method, the medians of the three data sets were compared with each other using the nonparametric Kruskal-Wallis test. This approach was used instead of an ANOVA test because of the non-normality of the data.
4. Results
4.1 Simulations of volume estimation
Figure 7 shows that IRM has the lowest accuracy when compared to |GI|-1, VCR, and MVCR. The studies [11,14,15] show that both GI and VCR have good accuracy in the volume estimation of in-vivo ex, periments, which is consistent with the simulation results presented in Figures 7a, 7c, and 7d. The GI obtained the lowest error (-4.6E-4), followed by MVCR (1.8E-3) and VCR (2.2E-3). These values indicate that the proposed MVCR is a viable alternative for volume monitoring since, in addition to having a low error, it does not require computationally expensive image reconstruction algorithms, as is the case with GI.
4.2 In-vitro results
The performance of GI, IRM, VCR, and MVCR was evaluated using a cylindrical phantom and three steel spheres: small, medium, and large, with radii of 27.5, 35.0, and 37.5 mm, respectively. For each trial, only one sphere was placed in the tank. The Kruskal-Wallis test was used to determine whether the differences between measurements were statistically significant.
Figures 8 to 11 show the box plot considering 30 measurements for each sphere. The dispersion of the data is caused by the electromagnetic interference resulting from coupling the system with the phantom since the metal-electrolyte interface generates spontaneous voltage fluctuations [21]. For each of the four indices compared in this study, medians, interquartile ranges, and coefficient of variation are presented in Tables 1 and 2. The p-values from Kruskal-Wallis test for differences between the medians of the estimated volumes are presented in Table 3. The differences were considered statistically significant when p < 0.05, which indicates the possibility of distinguishing between the three spheres.
Schlebusch and collaborators [7] show that GI is inversely proportional to the volume of the object. In this work, the linear relationship between |GI|-1 and volume was confirmed for the in-vitro experiments [Figure 8]. The interquartile ranges, which were lower than 3.5E-4, reveal the low sensitivity of |GI|-1 to measurement noise [Table 1]. In addition, the Kruskal-Wallis test [Table 3] confirmed that the difference between the |GI|-1 values for each sphere was significant (p = 1.34E-8). These results are not in agreement with [13], where the researchers found that the GI has a reduced sensitivity to volume changes when a ring arrangement of electrodes is used. Therefore, our results suggest that |GI|-1 is a viable alternative for volume monitoring using 8 electrodes in a simple ring configuration, and adjacent patterns for injection and measurement.
Table 1 Medians and interquartile ranges of measurements for each volume estimation method and sphere size
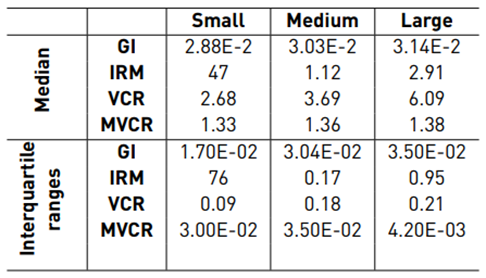
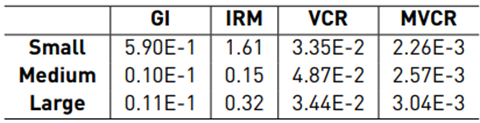
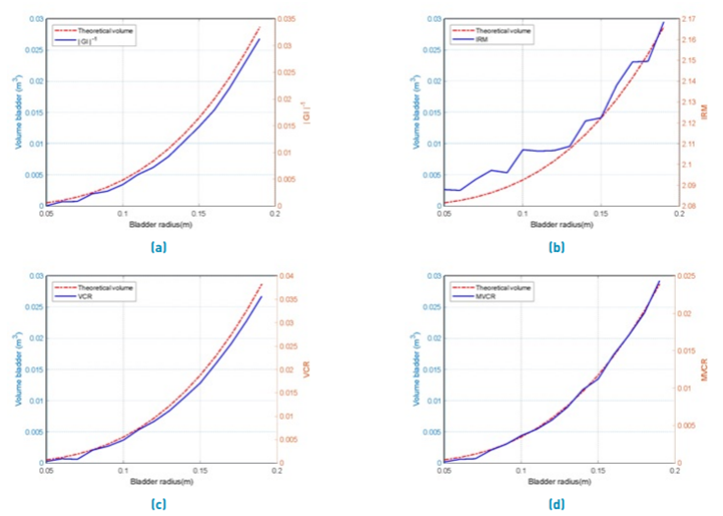
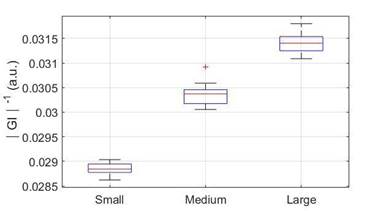
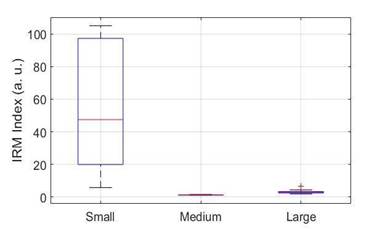
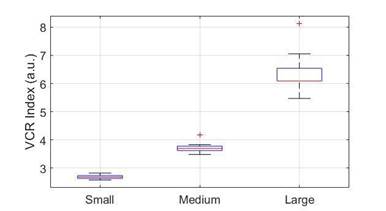
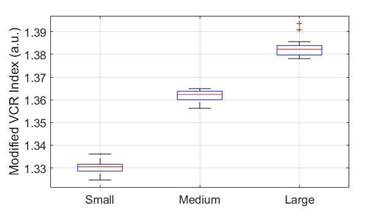
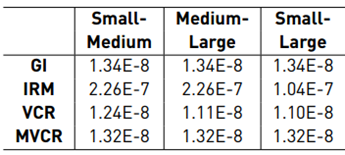
Figure 11 shows the results of the IRM approach. The median values of the IRM measurements are different for the three spheres [Table 1]. Table 1 shows that the medium-sized sphere has the lowest median (1.12), while the small sphere has the largest median [47]. These results corroborate the limitation of IRM for small volume estimation, as indicated in [12]. These results make IRM unsuitable for bladder volume estimation.
Figures 10 and 11 show that for VCR and MVCR, the measurements of the spheres do not overlap, and Table 3 indicates that the median values for these approaches are significantly different for the three spheres. The proposed MVCR is an extension of the VCR that uses eight voltage measurements to reduce noise sensitivity. As can be seen from Tables 1 and 2, the quotient between the interquartile range and the median (coefficient of variation) is lower for MVCR [Table 2], which indicates that the proposed approach improves precision.
The interquartile ranges for |GI|-1, VCR, and MVCR [Table 1] show that it is feasible to discriminate between the three spheres. For the four methods, the Kruskal-Wallis test [Table 3] indicates that the differences between the medians of the estimates are significant. However, as presented in Table 1, there is no direct or inverse relationship between IRM medians and the volume of the spheres.
Of the four approaches contemplated in this study, |GI|-1 has the lowest sensitivity to volume change, since, as indicated in Table 1, the variation between the medians of the three spheres is on the order of thousandths. On the other hand, VCR has the highest sensitivity to volume change, and MVCR has a volume sensitivity greater than GI and less than VCR [Table 1]. MVCR has the lowest coefficient of variation [Table 1]. These results show that MVCR is the best alternative for volume monitoring.
The bioimpedance approaches (VCR, IRM, and MVCR) are used to detect changes in volume when the object conductivity under study remains constant, using only the potential measurements. Furthermore, these methods require less computational effort than the |GI|-1 approach, which requires solving the EIT inverse problem. In this study, the in-vitro performance of volume estimation indices based on constant conductivity and variable volume objects was analyzed. The effects of conductivity variation will be considered in subsequent studies, as well as in-vivo analysis of the GI, VCR, and MVCR approaches.
5. Conclusions
The results obtained with the steel spheres and the saline solution show that |GI|-1, VCR, and MVCR are suitable approaches for volume monitoring when the conductivity of the object under study is unknown but constant. VCR had the highest sensitivity to volume variation, while MVCR had a small interquartile rank. Both VCR and MVCR are simpler to implement than |GI|-1 because they do not require image reconstruction algorithms. These results show the viability of doing long in-vivo volume estimation experiments using an EIT system with 8 electrodes and the MVCR approach.

