SciELO - Scientific Electronic Library Online

 
 número109EditorialEfecto de la adición de MWCNTs en el desempeño de lubricante mineral para motor Diesel índice de autoresíndice de materiabúsqueda de artículos
Home Pagelista alfabética de revistas  

Servicios Personalizados

Revista

Articulo

Indicadores

Links relacionados

  • En proceso de indezaciónCitado por Google
  • No hay articulos similaresSimilares en SciELO
  • En proceso de indezaciónSimilares en Google

Compartir


Revista Facultad de Ingeniería Universidad de Antioquia

versión impresa ISSN 0120-6230versión On-line ISSN 2422-2844

Rev.fac.ing.univ. Antioquia  no.109 Medellín oct./dic. 2023  Epub 30-Oct-2023

https://doi.org/10.17533/udea.redin.20221099 

Artículo original

Mapping of clay soils by remote sensing in the area of Mers El Kébir, Algeria* **

Mapeo de suelos arcillosos por teledetección en el área de Mers El Kébir, Argelia

Farid Rahal1  * 

Fatima-Zohra Baba Hamed2 

1 Architecture Department, University of Sciences and Technology of Oran, Mohamed Boudiaf, El Mnaouar, BP 1505 Bir El Djir, 31000, Oran, Algeria.

2 Civil Engineering, University of Sciences and Technology of Oran, Mohamed Boudiaf, El Mnaouar, BP 1505 Bir El Djir, 31000, Oran, Algeria.


ABSTRACT

The identification of clay soils is of great importance for the construction industry. Indeed, this type of soil presents an economic interest related to the exploitation of its clayey materials. Furthermore, the assessment of the potential for differential ground movement through the dryness of the soils and their rehydration is also an important issue to identify in order to reduce the swelling-shrinking hazard. The region of Mers El Kébir located in northwest Algeria, is at risk of this phenomenon because it is known for its marly clay compositions. Mapping this type of soil using satellite imagery offers an alternative to the engineering practice of establishing soil mineralogy, based on X-ray diffraction analysis, which is expensive and time-consuming. The objective of this research is to use ASTER satellite images to map different clay minerals. This analysis is based on remote sensing of spectral signatures corresponding to illite, kaolinite, and montmorillonite.The study of satellite images of the Mers El Kébir region validates the methodology developed, which could be used to help in the development and planning of new infrastructures adapted to the different types of soil.

Keywords: Clay Soils; Shrinkage-swelling hazard; Remote sensing; ASTER

RESUMEN

La identificación de suelos arcillosos es de gran importancia para la industria de la construcción. En efecto, este tipo de suelo tiene relación económica con la explotación de sus materiales arcillosos. Además, la evaluación del potencial de movimiento diferencial del suelo a través de la sequedad de los suelos y su rehidratación también se requiere identificar para reducir el riesgo de expansión y contracción. La región de Mers El Kébir, ubicada en el noroeste de Argelia, está expuesta a este fenómeno porque es conocida por sus composiciones de arcilla margosa. El mapeo de este tipo de suelo utilizando imágenes satelitales ofrece una alternativa a la práctica de ingeniería de establecer la mineralogía del suelo; basada en el análisis de difracción de rayos X, que es costoso y lleva mucho tiempo. El objetivo de esta investigación es utilizar imágenes del satélite ASTER para mapear diferentes minerales arcillosos. Este análisis se basa en la detección remota de firmas espectrales correspondientes a ilita, caolinita y montmorillonita. El estudio de imágenes de satélite de la región de Mers El Kébir valida la metodología desarrollada que podría utilizarse para ayudar en el desarrollo y planificación de nuevas infraestructuras adaptadas a los diferentes tipos de suelo.

KEYWORDS: suelos arcillosos; amenaza de contracción-expansión; Teledetección; ASTER

1. Introduction

The term clay was initially defined as a material made up of grains less than 2 μm in diameter. Clay minerals make up about 16% of the total volume of matter on the earth's surface [1]. As a rock, clay is generally made up of a mixture of clay minerals and other rocky debris of varying compositions.

With the conventional exploitation of clay materials by the industry, new geopolymerization processes have recently been developed to produce building materials in the form of geopolymers by using kaolinite. These products could be used as low-cost building materials for green housing. They are characterized by high strength, high heat resistance, low production cost, low energy consumption, and low CO2 emissions [2].

However, the phenomenon of shrinkage and swelling constitute the most important risks induced by clay soils. These soils have high plasticity indices that can damage the structures they are supporting, especially when a significant variation in their water content occurs. This phenomenon can cause damage in constructions if the foundations and structure are not rigid enough [3].

These damages can be cracking on the facade, distortions of doors and windows, dislocations of pavements and partitions, or ruptures of buried pipes.

The pathologies observed at the site of the Hacène Ben Mouloud university campus in Médéa, in Algeria, are indicative of this phenomenon [3]. Other sites in Algeria are a matter of significant concern because their type of soil can favor the occurrence of swelling and shrinkage phenomena. The nature of the soil is the predominant factor that predisposes a site to the shrinkage-swelling hazard.

Soil expansion is a major challenge for scientific research [4-8], being an intrinsic property caused by the presence of active clay minerals in soils [9,10]. Detecting the presence of such clay minerals is a key factor in differentiating potentially expansive soils. Additionally, identifying and quantifying their abundance is essential to assess soil expansion. In this sense, the conventional mineralogical analysis includes X-ray diffraction analysis, scanning electron microscopy, transmission electron microscopy, differential thermal analysis, thermogravimetric analysis, and various methods of chemical analysis. These methods are essential in research laboratories to explore the basic properties of clay minerals. However, they are expensive and require sophisticated laboratory procedures. The application of remote sensing techniques can constitute an alternative to supplying the information obtained from these methods.

The application of remote sensing sciences in the field of geology is very diverse and wide. One of its most important applications in earth sciences is geological mapping [11]. The use of satellite data in combination with data derived from field geology, geochemistry, geophysics, and laboratory analysis has provided valuable and detailed information useful for mineralogical and geological studies [12]. This technique has been used successfully in numerous studies, such as extracting information for environmental planning in cities, determining potential geothermal energy areas as well as mapping clay soils [13-17].

Images from the series of LANDSAT satellites have been a key element of geological remote sensing since 1973 and can be used to determine land use, geological and mineralogy exploration [18]. However, NASA’s on-orbit Advanced Spaceborne Thermal Emission and Reflection Radiometer (ASTER) multispectral sensor, collects data in more bands with comparatively narrower spectral channels than Landsat data. Furthermore, ASTER’s thermal bands are favorable for mapping silicates and carbonates [19]. These advantages make ASTER an appropriate satellite sensor for spectral mapping techniques among other multispectral sensors [18].

ASTER has three spectral bands in the visible near-infrared (VNIR), six bands in the shortwave infrared (SWIR), and five bands in the thermal infrared (TIR) regions, with 15-, 30-, and 90-m ground resolution, respectively. The VNIR subsystem has one backward-viewing band for stereoscopic observation in the along-track direction. Because the data will have wide spectral coverage and relatively high spatial resolution, it will be possible to discriminate a variety of surface materials [20].

ASTER image analysis needs to perform an atmospheric correction in order to obtain reflectance values [14].

The reflectance spectra of minerals are well known, and many studies have been developed to determine the reflection spectrum of rocks. The reflectance spectra of minerals are measured by spectroscopic instruments of varying resolution and stored in spectral libraries that are stressed in digital formats [11].

Clay is generally made up of smectite, kaolinite and, illite. Smectite is a group of clay minerals that is characterized by three layers, including two layers of silicon and oxygen tetrahedron and one layer of aluminum and hydroxyl octahedron, the most important member of those is montmorillonite. In these layers, water molecules are absorbed between the layers. Montmorillonite approaches a strong absorption spectrum of 1.4, 1.9, and 2.2 µm. The spectra of illite, montmorillonite, and muscovite have almost the same absorption bands. Similar to montmorillonite, illite shows an absorption band of 1.4 and 1.9, as well as 2.2, 2.3, and 2.4 µm [11,21].

Kaolinite is one of the clays that consists of two layers of silica in the form of tetrahedron and aluminum in the form of octahedron. Absorption properties of the whole kaolinite range are 2.2 µm and 1.4 µm. The reflection spectra of illite, kaolinite and montmorillonite are in the short infrared spectral range [11,22].

The mapping of clay soils can thus be carried out by spectral methods, allowing a rapid delineation of clay units and the identification of their mineralogy, in particular with regard to illite, montmorillonite and kaolinite [21]. The objective of this study is to present an efficient and inexpensive satellite method to characterize soil types, in particular clay soils, by using spectra ASTER images as the association of SWIR and VNIR in this work.

2. Mers El Kébir region

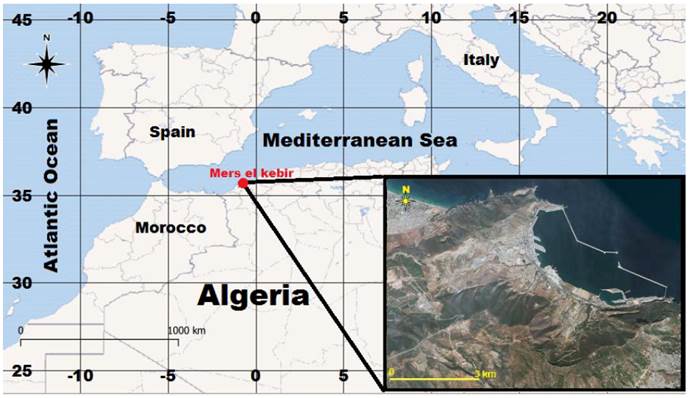
The Mers El Kébir city is located in northwest Algeria, bordered by the Mediterranean Sea to the north [Figure 1]. It is a municipality in the Wilaya of Oran, which is 7 km away and separated from Oran city by Mount Murdjado, which directly overlooks the sea [23]. In antiquity, Mers El Kébir was a port called Portus Divinis and an important maritime arsenal of the Almohad dynasty in the 12th century. Mers El Kébir currently hosts an important industrial shipbuilding complex.

Mers El Kébir is located in a depression between Mount Santon to the northwest and Mount Murdjadjo to the southeast. The geology of Mers El Kébir first concerns Mount Murdjadjo, which is composed of native schistosity [24]. Furthermore, Miocene clays in the Mers El Kébir region are sediments of marine origin that were deposited in a fairly thick layer (300 m) during the Tortonian period. The formation consists mainly of illite and montmorillonite, with an appreciable level of calcium carbonate [25].

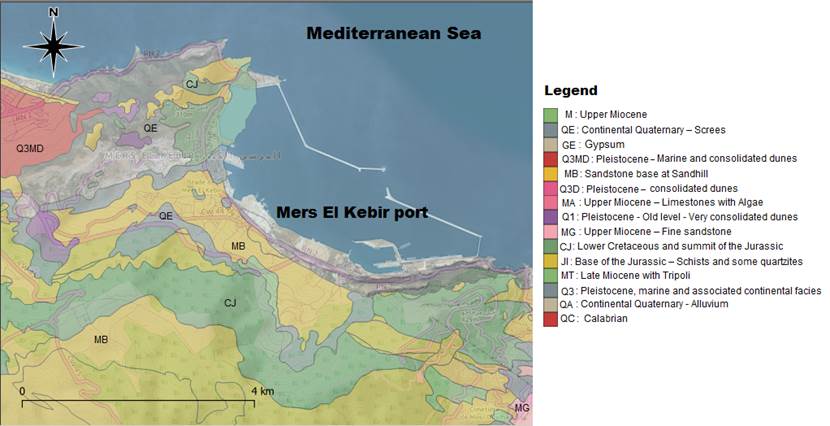
The presence of a very clayey soil prompted the emergence of the brickyard industry in 1868 with the exploitation of a large deposit of clayey marls on the sides of the Santon hill. Figure 2 shows the geological composition of the Mers El Kebir region.

3. Methodology

Each element of the earth's surface can be identified by an analysis of its recorded spectral signature from visible to thermal infrared [22]. The spectral signature of each element (plants, rocks, soils, minerals) is characterized by absorption bands, which can be compared to the spectral signatures of different elements that discriminate elements like minerals [27].

Spectroscopy analyzes the reflectance of materials which reflects the interactions of light with matter in the form of absorption, scattering, or reflection.

The absorbed energy forms depressions on the absorption curves. The general shape of these curves and the position of the depressions thus form a spectral signature allowing the characterization of materials

The minerals can be discriminated by reflectance measurements in three main atmospheric windows: 1. visible and near infraRed (VNIR) from 0.4 to 1.1µm, 2. Short Wave InfraRed (SWIR) from 1.1 to 2.5 µm and 3. Thermal InfraRed (TIR) from 8 to 14 µm [27].

ASTER library, provided by NASA (National Aeronautics and Space Administration - USA) contains more than 2000 spectra of minerals, rocks, soils, man-made materials, water, and snow (http://speclib.jpl.nasa.gov) and makes part of the spectral libraries, expressed in reflectance, for certain natural and artificial materials that are available to the public. The USGS (United States Geological Survey) library contains about 500 spectra for minerals, mainly in addition to a few plants. These libraries have been used in many works on remote sensing minerals identifications through satellite images [28-31].

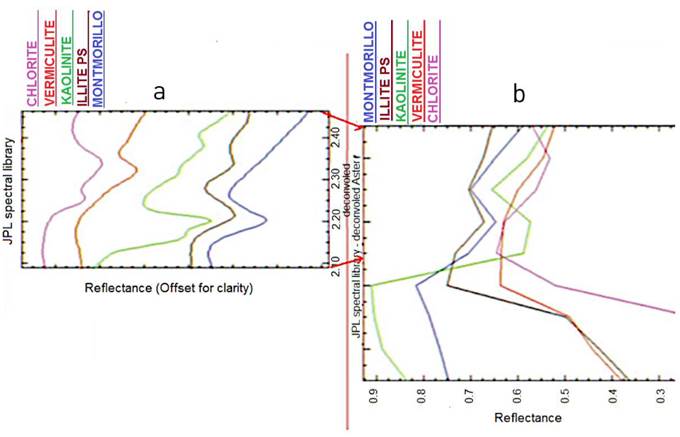
The NASA spectral library deconvolved into ASTER bands in the SWIR2 range highlights several spectral characteristics relevant to the classification of clay materials [Figure 3]. The characteristics highlighted are as follows. Illite exhibits an absorption characteristic in Band 6 and a slight flexion in Band 8; montmorillonite exhibits a unique absorption characteristic in band 8; kaolinite has a large absorption capacity in bands 5 and 6 and a slight inflection in band 8. These spectral characteristics are sufficiently discriminating to allow the identification of the mineral composition [28].

To achieve the classification of clay materials in the study area, the NASA spectral library was used. The SAM (Spectral Angle Mapper) mapping method, is widely validated in the scientific literature. The Spectral Angle Mapper (SAM) method [32,33], compares the reference spectra of the spectral library with each spectrum of pixels in the image. The SAM method algorithm determines the similarity between a reference spectrum and an image spectrum by calculating the “spectral angle” between them. An angular threshold value is then chosen, so that only pixels having smaller angles to the reference spectra will be mapped.

Smaller values for the angle indicate the highest similarity between the pixel spectrum and the reference spectra.

4. Results and discussion

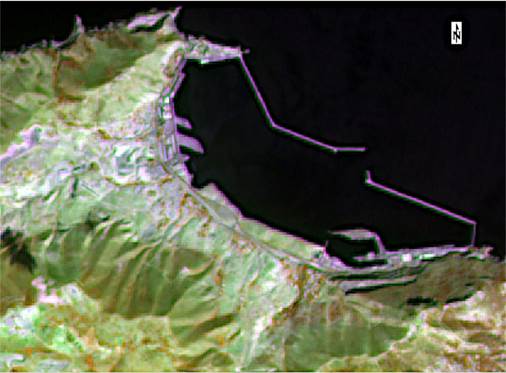
A false-color IR composite image (342 RGB) was generated in order to distinguish the different geomorphological units in the study area as shown in Figure 4.

The same ASTER image is used to identify clayey materials in the Mers El Kébir region. ASTER images allow the mapping of clay minerals, via the six spectral bands in its shortwave infrared range, in particular wavelengths between 2.145 and 2.43 μm [28]. This image is classified by the SAM method [Figure 5].

Source: authors

Figure 1 Geographical position of the city of Mers El Kébir in Algeria - WGS 84 Web Mercator. 

Source: [26]

Figure 2 Geological map of the Mers El Kébir region-WGS 84 Web Mercator. 

Mers El Kébir clay is an aluminosilicate with a silica / alumina ratio of around 3.5. The percentages of Fe2O3 and CaO confirm the presence of goethite and calcite. In addition, the K2O content shows the existence of illite in the soil. The proportion of silica reflects the presence of silica in the form of associated minerals [34].

X-ray diffraction (XRD) analysis is used to determine the proportions of the different minerals present in a clay matrix [35].

Source: [28]

Figure 3 a) various clay spectra in the SWIR2 range (wavelength on the abscissa); b) the corresponding ASTER-deconvolved spectra (band number shown on the abscissa). 

Source: Authors

Figure 4 False-color IR ASTER image dated 12/07/2001 of Mers El Kébir area, showing the main geomorphological features of the study region. 

Source: Authors

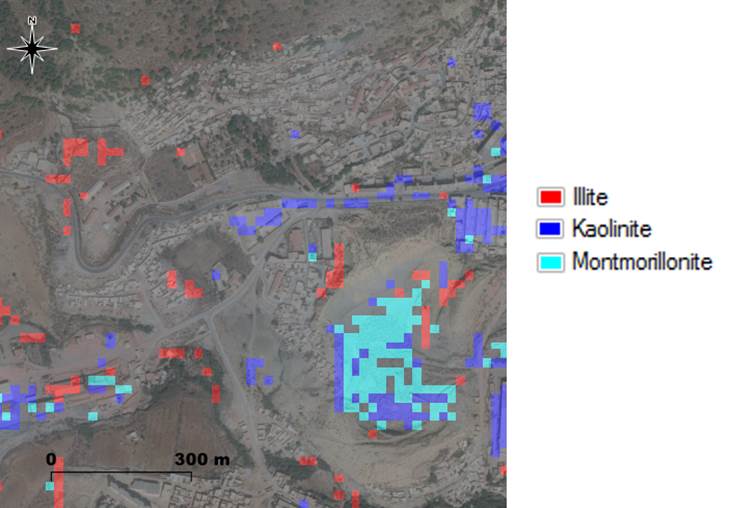
Figure 5 Classification by the SAM (Spectral Angle Mapper) method of clayey materials from the quarry zone adjacent to the Mers El Kébir brickyard from an ASTER image dated 12/07/2001 adjusted on a Bing image. 

This method is based on basal reflections giving d-spacing of the basal layer, which represents the thickness of the silicate layers. Clay mineral peaks can generally be distinguished by the width halfway up the peak.

Figure 6 shows the X-ray diffractogram which indicates that the clay of Mers El Kébir contains montmorillonite, illite, kaolinite, quartz and calcite.

The first peak corresponds to a basal spacing d = 13.8 × 10⁻⁴ μm, proving the existence of montmorillonite.

Source: [34]

Figure 6 X-ray diffractogram of the clay of Mers El Kébir. 

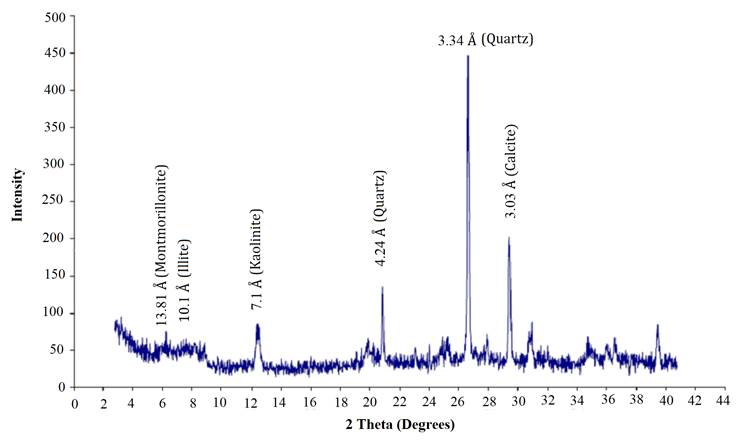
The presence of illite is demonstrated by the second peak corresponding to d = 10 × 10−4 μm. The third reflection at 7.1 × 10⁻⁴ μm is attributed to the presence of kaolinite. Reflections at 4.21 × 10⁻⁴ and 3.03 × 10⁻⁴ μm are attributed to quartz and calcite [34].

Figure 5 shows the presence of Kaolinite, Illite, and Montmorillonite, particularly in the quarry adjoining the Mers El Kébir brickyard. The proportion calculated using the designed GIS represents 20% of all classified materials. This same proportion is 23.8%, according to the analyzes carried out by XRD during the work of Bourokba Mrabent et al., 2017 [34]. This encouraging result shows that the mapping of clay soils can be carried out, at a lower cost, by spectral methods from ASTER images which are still used for the remote sensing of clay materials [36-38]. Thus, the phenomenon of shrinkage-swelling of the soil experienced by many regions [39], can be better controlled by the rapid delimitation of clay units and the identification of their mineralogy, in particular with regard to illite, kaolinite, and montmorillonite.

5. Conclusions

The use of ASTER data for the detection and mapping of heat-shrinkable clays has been demonstrated in the region of Mers El Kébir with an association of both spectral and texture characteristics from the VNIR and SWIR bands. This combination achieves higher accuracy than using spectral images alone [28]. The ASTER images allow an efficient approach to regional clay mineral mapping, via the six spectral bands in its shortwave infrared domain.

The application of this simple operational treatment method should improve the rapid mapping of clay zones. However, this approach can be improved by constructing a spectral library corresponding to samples of clay materials validated by X-ray diffractometric analyzes. Furthermore, the acquisition and processing of hyperspectral satellite images can provide better precision to the cartographies dedicated to the shrinkage-swelling hazard.

Acknowledgements

The authors would like to thank the General Directorate of Scientific Research and Technological Development (DGRSDT) for the support provided to the development of scientific research in Algeria.

The authors also thank the U.S. Geological Survey (USGS) for providing free satellite images used in this work.

References

[1] F. J. Pettijohn, Sedimentary rocks, 3rd ed. New York: Harper & Row, Publishers, 1983. [ Links ]

[2] H. N. Khoury, “Review of clays and clay minerals in jordan,” Arabian Journal of Geosciences, vol. 12, no. 706, Nov. 19, 2019. [Online]. Available: https://doi.org/10.1007/s12517-019-4882-2Links ]

[3] A. Medjnoun, M. Khiatine, and R. Bahar, “Mineralogical and geotechnical characterization of swelling marly clays of the medea region of algeria,” Bulletin of Engineering Geology and the Environment, vol. 73, Mar. 14, 2014. [Online]. Available: https://doi.org/10.1007/s10064-014-0582-zLinks ]

[4] M. Al-Mukhtar, A. Lasledj, and J. F. Alcover, “Behaviour and mineralogy changes in lime-treated expansive soil at 20 °c,” Applied Clay Science, vol. 50, no. 2, Oct. 2010. [Online]. Available: https://doi.org/10.1016/j.clay.2010.07.023Links ]

[5] A. A. Al-Rawas, “The factors controlling the expansive nature of the soils and rocks of northern oman,” Engineering Geology, vol. 53, no. 3-4, Jul. 1999. [Online]. Available: https://doi.org/10.1016/S0013-7952(98)00085-4Links ]

[6] W. J. Morin and W. T. Parry, “Geotechnical properties of ethiopian volcanic soils,” Geotechnique, vol. 21, no. 3, May. 25, 2015. [Online]. Available: https://doi.org/10.1680/geot.1971.21.3.223Links ]

[7] A. Seco, F. Ramírez, L. Miqueleiz, and B. García, “Stabilization of expansive soils for use in construction,” Applied Clay Science , vol. 51, no. 3, Dec. 24, 2010. [Online]. Available: https://doi.org/10.1016/j.clay.2010.12.027Links ]

[8] A. Sridharan and Y. Gurtug, “Swelling behaviour of compacted fine-grained soils,” Engineering geology, vol. 72, no. 1-2, Aug. 14, 2003. [Online]. Available: https://doi.org/10.1016/S0013-7952(03)00161-3Links ]

[9] S. Fityus and O. Buzzi, “The place of expansive clays in the framework of unsaturated soil mechanics,” Applied Clay Science , vol. 43, no. 2, Sep. 03, 2008. [Online]. Available: https://doi.org/10.1016/j.clay.2008.08.005Links ]

[10] H. B. Seed, R. Woodward, and R. Lundgren, “Prediction of swelling potential for compacted clays,” Journal of the soil mechanics and foundations division, vol. 88, no. 3, Jun. 1962. [Online]. Available: https://doi.org/10.1061/JSFEAQ.0000431Links ]

[11] A. Shirazy, A. Shirazi, and H. Nazerian, “Application of remote sensing in earth sciences - a review,” International Journal of Science and Engineering Applications, vol. 10, no. 5, 2021. [Online]. Available: https://doi.org/10.7753/IJSEA1005.1001Links ]

[12] A. Abdelnasser, M. Kumral, B. Zoheir, M. Karaman, and P. Weihed, “Ree geochemical characteristics and satellite-based mapping of hydrothermal alteration in atud gold deposit, egypt,” Journal of African Earth Sciences, vol. 145, Feb. 09, 2018. [Online]. Available: https://doi.org/10.1016/j.jafrearsci.2018.01.013Links ]

[13] L. M. Santana, “Landsat etm+ image applications to extract information for environmental planning in a colombian city,” International Journal of Remote Sensing, vol. 28, no. 19, Sep. 21, 2007. [Online]. Available: https://doi.org/10.1080/01431160701244856Links ]

[14] M. A. R. Aparicio, “Using aster image processing for geothermal energy potential areas,” Undergraduate Thesis, Universidad de los Andes, Bogotá, Colombia, 2017. [ Links ]

[15] F. Rahal, F. Z. Baba-Hamed, and M. Hadjel, “Mapping of clay soils exposed to the shrinking-swelling phenomenon, with eo-1-hyperion data in the region of sidi-chahmi, algeria,” Journal of Mining and Earth Sciences, vol. 62, no. 6, Dec. 31, 2021. [Online]. Available: https://doi.org/10.46326/JMES.2021.62(6).01Links ]

[16] S. Asadzadeh, I. R. P. Arango, and C. R. de Souza Filho, “Mapping natural oil seeps in the middle magdalena basin (colombia) using worldview-3 satellite data,” AAPG Bulletin, vol. 106, no. 4, Apr. 2022. [Online]. Available: https://doi.org/10.1306/09282120069Links ]

[17] B. Hincapié, A. Cortés-Soto, M. A. Bermúdez, S. Yepez, J. S. Trujillo-Hernández, B. M. Salguero-Londoño, and S. Grande, “Coffee plantation soil characterization using a multi-method approach near the volcano nevado del ruiz, colombian central cordillera,” Earth Sciences Research Journal, vol. 25, no. 3, Sep. 2021. [Online]. Available: https://doi.org/10.15446/esrj.v25n3.79170Links ]

[18] M. Safari, A. Maghsoudi, and A. B. Pour, “Application of landsat-8 and aster satellite remote sensing data for porphyry copper exploration: a case study from shahr-e-babak, kerman, south of iran,” Geocarto international, vol. 3, no. 11, Jul. 12, 2017. [Online]. Available: https://doi.org/10.1080/10106049.2017.1334834Links ]

[19] H. Aboelkhair, Y. Ninomiya, Y. Watanabe, and I. Sato, “Processing and interpretation of aster tir data for mapping of rare-metal-enriched albite granitoids in the central eastern desert of egypt,” Journal of African Earth Sciences , vol. 58, no. 1, Feb. 08, 2010. [Online]. Available: https://doi.org/10.1016/j.jafrearsci.2010.01.007Links ]

[20] Y. Yamaguchi, A. B. Kahle, H. Tsu, T. Kawakami, and M. Pniel, “Overview of advanced spaceborne thermal emission and reflection radiometer (aster),” IEEE Transactions on geoscience and remote sensing, vol. 36, no. 4, Jul. 1998. [Online]. Available: https://doi.org/10.1109/36.700991Links ]

[21] A. F. Goetz, B. N. Rock, and L. C. Rowan, “Remote sensing for exploration; an overview,” Economic Geology, vol. 78, no. 4, Jul. 01, 1983. [Online]. Available: https://doi.org/10.2113/gsecongeo.78.4.573Links ]

[22] W. M. Calvin, E. F. Littlefield, and C. Kratt, “Remote sensing of geothermal-related minerals for resource exploration in nevada,” Geothermics, vol. 53, Oct. 04, 2014. [Online]. Available: https://doi.org/10.1016/j.geothermics.2014.09.002Links ]

[23] B. Augustin, “Oran, étude de géographie et d’histoire urbaines,” Annales de Géographie, vol. 48, no. 274, 1939. [Online]. Available: https://doi.org/10.3406/geo.1939.11425Links ]

[24] A. Benziane, N. Boualla, and Z. Derriche, “Aptitude des eaux du bassin de la grande sebkha d’oran à l’irrigation,” Journal of Applied Biosciences, vol. 56, pp. 4066-4074, Aug. 30, 2012. [ Links ]

[25] S. A. B. Mrabent, A. Hachichi, S. Taibi, and J. M. Fleureau, “Conductivité hydraulique non saturée de l’argile de mers el kébir (algérie),” European journal of environmental and civil engineering, vol. 14, no. 10, Oct. 04, 2011. [Online]. Available: https://doi.org/10.1080/19648189.2010.9693295Links ]

[26] F. Z. Baba-Hamed , D. D. Rahal, and F. Rahal , “Seismic risk assessment of algerian buildings in urban area,” Journal of Civil Engineering and Management, vol. 19, no. 3, 2013. [Online]. Available: https://doi.org/10.3846/13923730.2012.744772Links ]

[27] C. Gómez, “Potentiels des données de télédétection multisources pour la cartographie géologique: Application à la région de rehoboth (namibie),” PhD. Thesis, Université Claude Bernard Lyon I, France, 2002. [ Links ]

[28] A. Bourguignon, G. Delpont, S. Chevrel, and S. Chabrillat, “Detection and mapping of shrink-swell clays in sw france, using aster imagery,” Geological Society Publications, vol. 283, 2007. [Online]. Available: https://doi.org/10.1144/SP283.10Links ]

[29] I. A. El-Magd, H. Mohy, and F. Basta, “Application of remote sensing for gold exploration in the fawakhir area, central eastern desert of egypt,” Arabian Journal of Geosciences , vol. 8, Apr. 27, 2014. [Online]. Available: https://doi.org/10.1007/s12517-014-1429-4Links ]

[30] S. M. Salem and N. M. Soliman, “Exploration of gold at the east end of wadi allaqi, south eastern desert, egypt, using remote sensing techniques,” Arabian Journal of Geosciences , vol. 8, Apr. 01, 2015. [Online]. Available: https://doi.org/10.1007/s12517-015-1880-xLinks ]

[31] L. Zazi, A. Boutaleb, and M. S. Guettouche, “Identification and mapping of clay minerals in the region of djebel meni (northwestern algeria) using hyperspectral imaging, eo-1 hyperion sensor,” Arabian Journal of Geosciences , vol. 10, Jun. 07, 2017. [Online]. Available: https://doi.org/10.1007/s12517-017-3015-zLinks ]

[32] F. A. Kruse, A. B. Lefkoff, J. W. Boardman, K. B. Heidebrecht, A. T. Shapiro, P. J. Barloon, and A. F. H. Goetz, “The spectral image processing system (sips)-interactive visualization and analysis of imaging spectrometer data,” Remote Sensing of Environment, vol. 44, no. 2-3, Apr. 07, 2003. [Online]. Available: https://doi.org/10.1016/0034-4257(93)90013-NLinks ]

[33] J. W. Boardman , “Analysis, understanding, and visualization of hyperspectral data as convex sets in n space,” in Proceedings Volume 2480, Imaging Spectrometry, Orlando, FL, 1995. [Online]. Available: https://doi.org/10.1117/12.210878Links ]

[34] S. A. B. Mrabent , A. Hachichi , H. Souli, S. Taibi , andJ. M. Fleureau , “Effect of lime on some physical parameters of a natural expansive clay from algeria,” European journal of environmental and civil engineering , vol. 21, no. 1, Oct. 19, 2015. [Online]. Available: https://doi.org/10.1080/19648189.2015.1093963Links ]

[35] L. Bengraa, A. Hachichi , and A. Benaissa, “Stabılısatıon des argıles gonflantes de la regıon d’oran par ajout de sable,” in International Conference on Geotechnical Engineering, Hammamet, TUN, 2008, pp. 319-330. [ Links ]

[36] T. Nouri, R. Poormirzaee, and F. Mollaei-Koshki, “Mineral mapping in zonouz region using multi-spectral remote sensing data to identify the kaolin extension,” Journal of Mining Engineering, vol. 15, no. 46, May. 2020. [Online]. Available: https://doi.org/10.22034/IJME.2020.105315.1713Links ]

[37] M. Nasr, S. F. Elbeih, A. M. Negm, and A. Kostianoy, Eds., Overview for Recent Applications of Remote Sensing in Egypt, ser. Springer Geophysics. Switzerland: Springer, Cham, 2020. [Online]. Available: https://doi.org/10.1007/978-3-030-39593-3_2Links ]

[38] T. Cudahy, P. Shi, Y. Novikova, and B. Fu, “Satellite aster mineral mapping the provenance of the loess used by the ming to build their earthen great wall,” Remote Sensing, vol. 12, no. 2, Jan. 14, 2020. [Online]. Available: https://doi.org/10.3390/rs12020270Links ]

[39] A. Khennouf and M. Baheddi, “Heave analysis of shallow foundations founded in swelling clayey soil at n’gaous city in algeria,” Studia Geotechnica et Mechanica, vol. 42, no. 3, Sep. 2020. [Online]. Available: https://doi.org/10.2478/sgem-2019-0051Links ]

*Data availability statement: the satellite images used are freely downloadable from USGS Earth Explorer (https://earthexplorer.usgs.gov/).

**Cite this article as: F. Rahal and F. Z. Baba Hamed. “Mapping of clay soils by remote sensing in the area of Mers El Kébir, Algeria”, Revista Facultad de Ingeniería Universidad de Antioquia, no.109, pp. 9-16, Oct-Dec 2023. [Online]. Available: https://www.doi.org/10.17533/udea.redin.20221099

Funding: the author(s) received no financial support for the research, authorship, and/or publication of this article.

Received: January 20, 2021; Accepted: October 20, 2022

*Corresponding Author: Farid Rahal, E-mail:farid.rahal.dz@gmail.com

Declaration of competing interes:

we declare that we have no significant competing interests including financial or non-financial, professional, or personal interests interfering with the full and objective presentation of the work described in this manuscript.

Author contributions:

Farid RAHAL and Fatima Zohra BABA HAMED built the design, data analysis and writing of the article.

Creative Commons License This is an open-access article distributed under the terms of the Creative Commons Attribution License