




 English (pdf)
 Article in xml format
 Article references

 Automatic translation
 Send this article by e-mail
 Cited by SciELO
 Cited by Google
 Similars in
SciELO
 Similars in Google

 Permalink


Introduction
Transport is one of the sectors with the most significant impact on the energy consumption matrix, representing 61.7 % of global energy consumption 1, and is also responsible for 24.4 % of greenhouse gas emissions from fossil fuel combustion 2. For these reasons, searching for new sources of clean and renewable energy has been necessary to help reduce dependence on oil and its derivatives 3. One of the best alternatives is the development of biofuels such as biodiesel, which can be used in internal combustion engines without the need to modify them, thus reducing environmental pollution; in addition, they are sustainable and economical in nature, unlike conventional fuels 4.
Biodiesel is the most widely used biofuel and is produced from vegetable oils such as soybeans, cotton seeds, sunflower, and palm oil 5. It shows better characteristics in ignition quality, lack of sulfur and aromatic content, renewal capacity, and biodegradability, and 30 % to 71 % reduction in emissions of polluting gases 6, in addition, to providing less engine wear, lower oil consumption and better thermal efficiency compared to that of traditional diesel fuel 7.
The consequence of the use of fossil fuels during the combustion process is the generation of emissions of polluting gases, such as: carbon dioxide (CO2), carbon monoxide (CO), unburned hydrocarbons and nitrogen oxides (NOx), and sulfurous oxides (SOx) 8. By using biodiesel in compression ignition engines, the reduction in exhaust gas emissions is achieved because the biofuel contains approximately between 12-18 carbons, whereas the conventional diesel molecule can have up to 20 carbons 9.
In most of the research carried out, it is observed that the emission of smoke is reduced when using mixtures of biodiesel compared to diesel, because the atomic bond of oxygen and biodiesel satisfies the positive chemical control over the formation of soot 10. Results of experiments with the use of biodiesel mixtures in a compression ignition engine show a 73% reduction in HC emissions and a 46% reduction in carbon monoxide 11.
However, research reports that the use of biodiesel in compression engines increases NOx 12, which can be caused by the injection advance, flame temperature increase, higher fuel density 13, and an increase in the speed of the combustion process by the presence of oxygen attached to the fuel 14.
In relation to the mechanical performance of the engine, 15 indicate that for a B10 mixture, the torque and power parameters are maintained compared to diesel. In addition, by analyzing the characteristics of engine performance and emissions, it is observed that the use of additives improves combustion, reducing the delay in the ignition and fuel consumption 16.
According to 17, it states that additives added to diesel fuel to improve engine life must meet a series of properties, such as: absorbing water, preventing wear and corrosion in the feeding system, protecting nozzles, and preventing the growth of microorganisms, among others. Every day the internal combustion engine is required to reduce the polluting gases produced by combustion; one of the pollutants associated with the diesel engine is particulate matter, for which methods are continuously developed which is according to 18, the use of additives and mixed fuels. The use of additives and the application of filters was the most convenient system for reducing the high levels of particulate generated in passenger vehicles and light trucks in the early 90s in the USA. The use of different types of additives in biodiesel blends helps to improve performance in the internal combustion engine 19. The addition of these elements improves fuel properties, consumption, and reduction of polluting gas emissions 20.
There are various types of metal-based additives, cetane improvers, antioxidants, oxygenated additives, etc., which are used to improve the properties of biodiesel 21, and their application has significant effects on the performance of the engine, exhaust gas emission, and fuel consumption 22.
Metal-based additives minimize viscosity, and pour point and increase flash point properties, in addition to reducing brake power due to their catalytic effect 23.
On the other hand, antioxidant additives present better characteristics to increase the cetane number and flash point, but the calorific value is decreased 24.
Additives perform excellent work when used in biodiesel blends because they increase the performance of the diesel engine, improving combustion and reducing emissions 25.
From the above, and considering that transport is part of the industrial processes from the assurance of the raw material to the commercialization, and which represents one of the areas of greatest environmental and energy impact, not only in Ecuador but globally, it is essential to carry out research on the different types of biofuels to evaluate its behavior and to the best alternative. This research aims to evaluate mechanical (torque and power), and environmental performance (opacity, exhaust gases) in compression ignition engines with proportions of 5 % (B5), 15 % (B15) and biodiesel mixtures with additive B5A and B15A, through the experimentation and use of automotive measuring equipment, for mass application in automotive vehicles.
Materials and methods
This work is based on the development of two stages in order to meet the objectives set. The first consists of the preparation of the mixtures to be used in the research with the corresponding percentage of diesel and biodiesel for each mixture; the biodiesel used was obtained from the transesterification of palm oil to which the vacuum distillation and kinematic viscosity tests at 40 ºC were carried out in a specialized laboratory in order to verify that the biodiesel has the appropriate characteristics to be used in diesel/ biodiesel mixtures; and the second, the analysis of the mechanical behavior, opacity and exhaust gases emitted by the engine operating with diesel fuel only and mixtures with biodiesel B5, B15, in addition to mixtures with additive B5A, B15A. The tests are carried out at 2,220 masl, using updated and properly calibrated diagnostic equipment; in addition to each fuel mixture, four measurements were developed for each parameter, in order to obtain 95 % confidence 26.
The additive in the different samples is mixed in the quantity of 0.07 grams per gallon of fuel, as indicated by the manufacturer. The additive properties are shown in Table 1.
Table 1 Technical data of the additive
| Parameter | Value |
|---|---|
| Boiling point | 255 °C |
| Melting point | 70 °C |
| Vapor density | 5.3 (air = 1) |
| Vapor pressure | < 1 psi |
| Specific gravity | 1.04 |
| Density | 0.992 g/mL |
| Stability | Stable |
Source: 27
The FEROX additive was selected for research, based on the interest in its commercialization in the Ecuadorian market, in addition to being a solid additive compared to others available that are liquids such as: Bardahl Additive, Qualco R-2, among others.
2.1 Diesel engine behavior
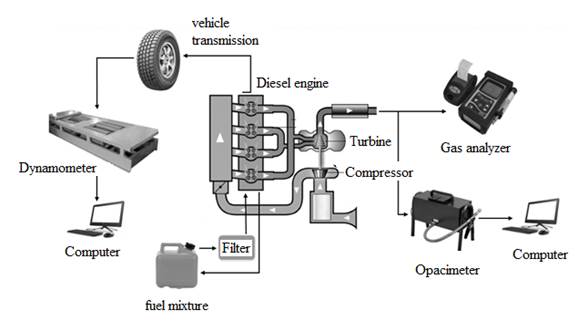
The research development seeks to establish the variation of values in opacity, exhaust emission, and mechanical performance of the diesel engine by applying biodiesel and diesel mixtures. Figure 1 depicts the diagram of the testing process developed in the two vehicles; for this purpose, the opacity tests were run on a Brain Bee Opa-100 opacimeter, the gas analysis on the Brain Bee AGS-688 analyzer and the mechanical tests were developed on a Vamag BPA-V2R dynamometer.
The characteristics of the vehicles used in the different tests are indicated in Table 2.
2.2 Torque and power testing procedure
The assessment of the mechanical performance of the test vehicles was carried out through the use of an automotive dynamometer, where it must first be verified that the diameter of the vehicle wheels and the weight capacity are within the values set by the equipment manufacturer, and then place the vehicle within the dynamometer area and ensure that it is belted in order to prevent it from leaving the rollers.
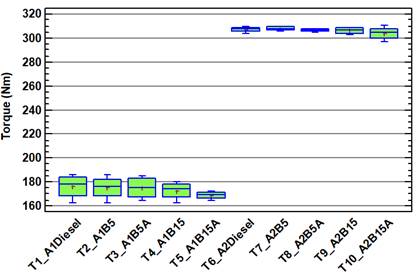
Table 2 Main features of vehicles
| Model | Mazda BT-50 CS 4X2 STD 2.5 FL | Ford Ranger 2.5 TDCi 4X4 |
| Fuel feed | Common Rail Direct Injection | Common Rail Direct Injection |
| Cubic capacity | 2,500 cc | 2,500 cc |
| Power | 118 HP / 3,500 rpm | 143 HP at 3,500 rpm |
| Torque | 266 Nm / 2,000 rpm | 330 Nm at 1,800 rpm |
| Compression ratio | 18:01 | 18:01 |
To start testing, it is necessary to ensure that the diesel engine is at the normal operating temperature and to check the alignment of the powertrain in relation to the dynamometer rollers by turning the wheels at a speed of 20 km/h; then entering the technical data relating to the test vehicle into the software.
In the development of the tests, the gear of the vehicle should be placed in 4th, which establishes a transmission ratio of 1:1; accelerate the vehicle to the maximum speed of "rpm cut" (between 4,500 and 6,000 rpm) and finally, step on the clutch until the power bank stops 28.
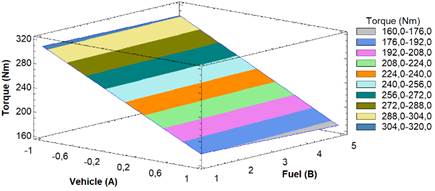
Torque= 243.838 - 64.9125* A - 1.2375 * B - 0.4875 * A * B
Figure 4 Estimated response surface of the torque variable.
2.3 Opacity testing procedure
The opacity value is obtained through the execution of free acceleration cycles, for which the vehicle must be in good condition and with the engine operating at normal operating temperature in an idling state. In the procedure, the throttle pedal should be progressively pressed to revolutions above 2,500, and held in that state until the opacimeter calculates and specifies the obtained values; finally, stop accelerating to keep the engine in an idling state. It is necessary to allow approximately 10 s to start the next cycle of free acceleration, and the opacity evaluation should be performed at least five cycles with the procedure described above (29, 30).
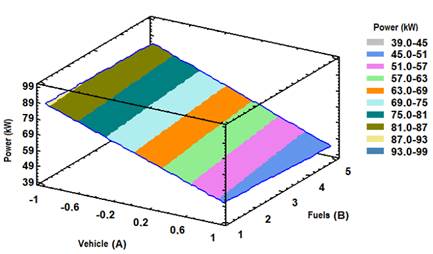
Potencie =69.7392 - 18.7228 * A - 0.86125 * B - 0.32875 * A * B
Figure 8 Estimated response surface of the power variable
The first acceleration cycle allows the accumulated soot to be removed from the vehicle's exhaust system and also to the operator to adapt to the proper movement of the throttle. The remaining four acceleration cycles determine the average of the maximum smoke value emitted and corrected in each of the cycles performed. According to 29 and 30, the test validation results on the opacimeter should not exceed 2 % in the opacity value; in addition, the average smoke in the five cycles performed should not exceed the 5 % difference between the minimum and maximum values.
2.4 Exhaust gas testing procedure
The exhaust gas analysis is performed with the vehicle at normal operating temperature, in idle states, and at 2500 revolutions. For each fuel mixture, four measurements are executed. The measurement time in each test is approximately 30 seconds in order to ensure that the obtained values are stable.
For evaluation with the different mixtures, the equipment should be expected to approve a period of warming, into, stabilization, and sealing throughout the measuring probe line to avoid erroneous data during the procedure. For the data intake in relenti, revolutions nor must be greater than 1,200 rpm, and for high-speed testing, the vehicle must be held up to 2,500 rpm, and the accelerator held steady for approximately 10 s.
2.5 Experiment design
For the research, the variation of the variables of: torque (Nm), power (kW), opacity (%), carbon monoxide CO (%), carbon dioxide CO2 (%), hydrocarbons HC (ppm), and nitrogen oxides NOx (ppm) is analyzed, with the application of the different diesel/biodiesel mixtures in the vehicles tested. For the statistical analysis, the nomenclature indicated in Table 3 is established for the independent variables and their levels.
Table 3 Nomenclature of independent variables and their levels.
| Factors | Levels | Nomenclature | Designation |
| Vehicle | Truck 1 (MBT-50) | A1 | 1 |
| Truck 2 (F-RANGER) | A2 | -1 | |
| Fuels | Diesel | 1 | 1 |
| B5 | 2 | 2 | |
| B5A | 3 | 3 | |
| B15 | 4 | 4 | |
| B15A | 5 | 5 | |
| rpm | idling speed | - | -1 |
| 2,500 rpm | - | 1 |
The analysis and comparison of results are performed by the application of the Statgraphics Centurion XVI software, to determine whether there is a significant difference between the experimental groups or not; the ANOVA analysis was used, applying multiple comparison tests of LSD (Least Significant Difference) means, for 95 % confidence. The analysis and comparison of the results are performed by means of response surface; treatments (combinations) are formed, as shown in Table 4(31, 32).
Results and discussion
After the development of the tests indicated in the methodology, the analysis of the values obtained in the variation of power, torque, engine opacity, and exhaust gases, which allows the evaluation of the behavior of the mixtures experienced to be carried out.
3.1 Properties of experienced fuels
Vacuum distillation and kinematic viscosity tests at 40 oC to biodiesel (B100) were carried out in order to verify whether their characteristics are suitable for use in the diesel/biodiesel mixtures proposed in the research. In the case of the mixtures, a complete characterization was performed. Table 5 shows the values obtained in the tests carried out, which are within the parameters established by the standard 33.
3.2 Torque results
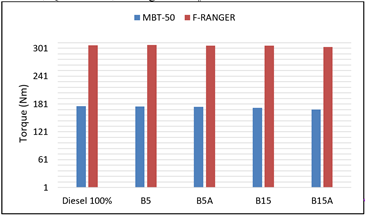
Figure 2 shows the average torque values obtained in vehicles using diesel and biodiesel mixtures at their highest speed are indicated. As a general average, there is a tendency to decrease the value of the engine torque as the proportion of biodiesel increases, obtaining the best (maximum) results with B5 compared to the rest of the mixtures.
In Table 6 and Figure 3, the multi-range test and box graphic and torque whiskers are indicated by applying Fisher's Significant Difference Analysis (LSD) with a 5.0 % risk. It is observed that there is a significant difference between the vehicles, with the F-Ranger being the one with the best results. The results coincide with those obtained in the research carried out by 15, which indicate that the most optimal mixtures are with low percentages of biodiesel while retaining the value of torque insignificant decreases, concluding that to the increase the proportion of biodiesel in the mixtures the thermal efficiency of the combustion reduces, due to the increase in density and viscosity of the fuel.
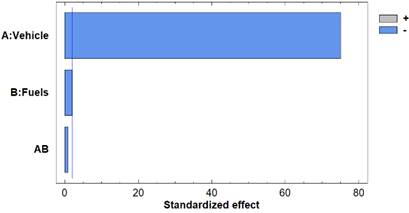
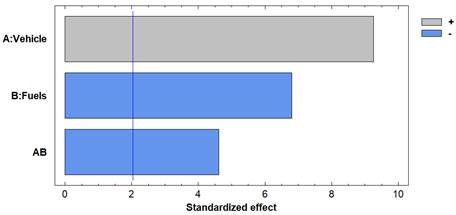
Figure 4 indicates the ratio of the torque variable to vehicles and fuel type, defining the mathematical model that relates them, highlighting the influence of the vehicles, as indicated in Pareto Figure 5.
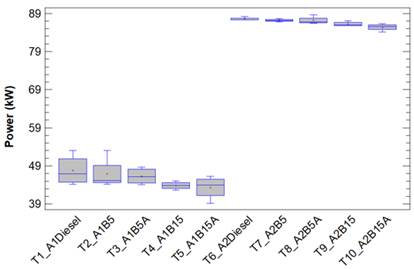
3.3 Power results
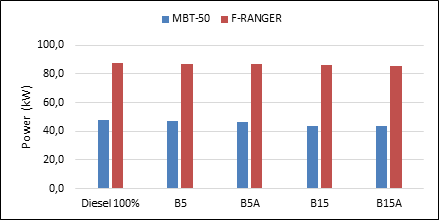
Figure 6 indicates the power value for the two vehicles with the use of mixtures B5, B5A, B15, B15A, and conventional diesel at maximum regimes. The power value is higher with the use of conventional diesel, while the B5 mixture shows a minimum reduction of 1.83 % and 0.40 % for MBT-50 and F-Ranger, respectively. Table 7 and Figure 7 show the results of the multi-range test and box chart and power whiskers applying Fisher’s Significant Difference Analysis (LSD) analysis with a 5.0 % risk. It is observed that there are significant differences in vehicles, where F-Ranger gets the best results. As with torque values, these powers of vehicles tend to decrease in value as the percentage of biodiesel increases.
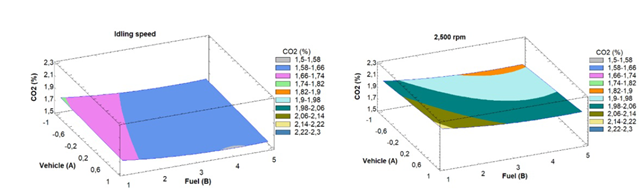
CO2 = 1.993 + 0.0225 * A - 0.100857 * B + 0.186 * C + 0.0005 * A * B + 0.52 *A * C + 0.0121429 * B^2 - 0.002 * B * C
Figure 15 Estimated response surface of the CO2 variable (Idling speed and 2,500 rpm).
The results are consistent with those obtained by 15 and 34, where they indicate that the most optimal mixtures are with low percentages of biodiesel, managing to maintain power without significant decreases, due to the lower heating values (approx. LHV 9500 kcal/kg) compared to conventional diesel (approx. LHV 10800 kcal/kg).
The lower power reduction for the two vehicles was achieved with the B5 fuel and the largest reduction in its value with the use of the B15A mixture compared to diesel. Figure 8 indicates the ratio of the power variable according to vehicles and fuel type, defining its mathematical model, and highlighting the influence of vehicles, as seen in Pareto Figure 9. These results coincide with the study carried out by 15, where they obtained opacity reductions by adding B10 mixtures in both experienced vehicles.
3.4 Opacity results
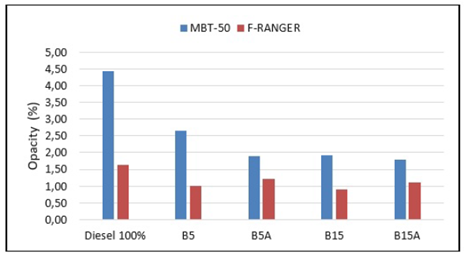
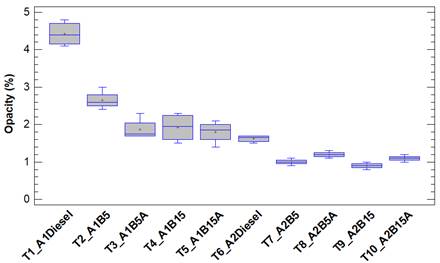
Figure 10 shows the level of opacity obtained in the vehicles tested with the use of diesel and biodiesel mixtures, where a reduction in the opacity value of 59.3 % is evidenced for MBT-50 with the B15A mixture and a decrease of 44.8 % with mix B15 for F-Ranger. In Table 8 and Figure 11, the results of the multi-range test and case chart and parsing of the opacity are shown by applying Fisher's Significant Difference Analysis (LSD) with a 5.0 % risk, showing the existence of significant vehicle difference, with MBT-50 being the best values. The results achieved are consistent with those obtained by 8, which the results that when using biodiesel mixtures, the opacity level decreases by up to 96 % compared to the use of fossil diesel, due to the better oxidation of the mixture and the increase in the temperature of the combustion chamber.
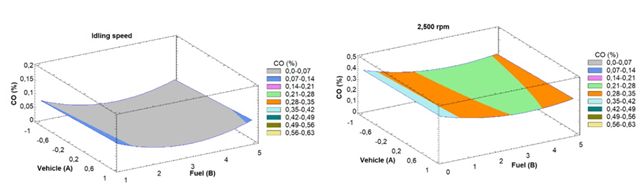
CO = 0.2685 + 0.00625 * A - 0.0753929 * B + 0.1375 * C + 0.00125 * A* B + 0.0116071 * B^2 - 0.00125 * B*C
Figure 17 Estimated response surface for CO analysis (Idling speed and 2,500 rpm).
Table 5 Properties of experienced fuel mixtures
| Fuel properties | Diesel Premium | Biodiesel | Diesel/ 5% biodiesel (B5) | Diesel/ 15% biodiesel (B15) | Diesel/ 5% biodiesel-additive (B5A) | Diesel/ 15% biodiesel-additive (B15A) | INEN Standard: 1489:2012 |
| Number of cetane | 51.7 | - | 53.2 | 53.2 | 51.9 | 52.5 | 45 min |
| Distillation curve T₉₀ - 90% evap. (°C) | 336 | 355 | 336 | 343 | 342 | 343 | 360 max |
| Flash Point (°C) | 61 | - | 63 | 66 | 61 | 64 | 51 min |
| Sulfur content (ppm) | 145.93 | - | 122.7 | 106.76 | 119.75 | 105.99 | 500 max |
| Corrosion to the copper sheet | 1A | - | 1A | 1A | 1A | 1A | 3 |
| Kinematic viscosity at 40°C (mm²/s) | 3.528 | 4.81 | 3.445 | 3.459 | 3.459 | 3.283 | 2-may |
| Water and sediments (%) | <0.05 | - | <0.05 | <0.05 | <0.05 | <0.05 | 0.05 max |
Table 6 Analysis of significant differences LSD - Torque
| Cases | Average | Homogeneous groups | ||
| T5 (A1B15A) | 4 | 169.0 | X | |
| T4 (A1B15) | 4 | 172.75 | X | |
| T3 (A1B5A) | 4 | 175.25 | X | |
| T2 (A1B5) | 4 | 175.5 | X | |
| T1 (A1Diesel) | 4 | 176.25 | X | |
| T10 (A2B15A) | 4 | 304.25 | X | |
| T9 (A2B15) | 4 | 306.5 | X | |
| T8 (A2B5A) | 4 | 306.5 | X | |
| T6 (A2Diesel) | 4 | 307.25 | X | |
| T7 (A2B5) | 4 | 308.0 | X | |
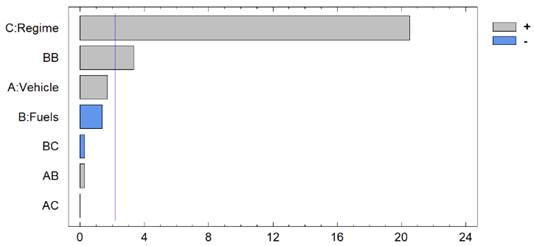
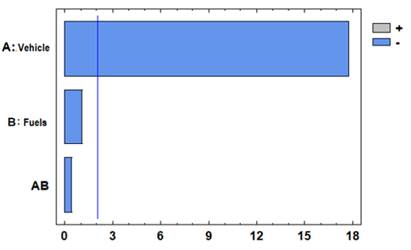
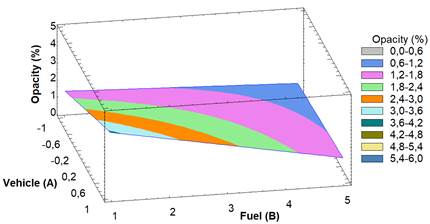
Figure 12 shows the relationship between the opacity variable depending on the vehicles and the type of fuel, defining its mathematical model; in addition, it is evidenced that the two vehicles decrease the opacity as the percentage of biodiesel increases, demonstrating the influence of fuels and vehicles as indicated in Figure 13 of Pareto.
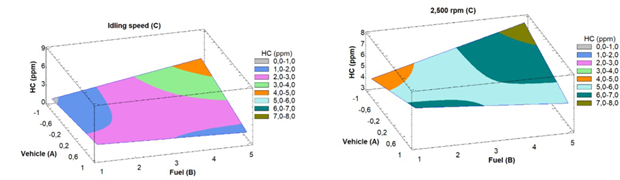
HC= 3.045 + 1.595 * A + 0.365 * B + 1.855 * C - 0.585 + A * B + 2.235 * A* C - 0.04 * B*C
Figure 19 Estimated response surface for HC analysis (Idling speed and 2,500 rpm)
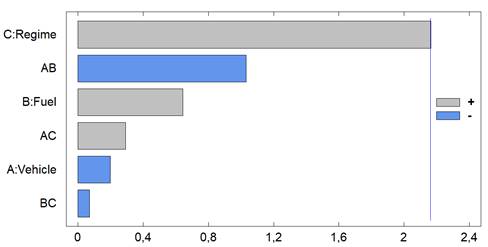
Table 7 Analysis of significant differences LSD - Power
| Cases | Cases | Average | Homogeneous groups | |||
|---|---|---|---|---|---|---|
| T5 (A1B15A) | 4 | 43.35 | X | |||
| T4 (A1B15) | 4 | 43.85 | X | X | ||
| T3 (A1B5A) | 4 | 46.3 | X | X | X | |
| T2 (A1B5) | 4 | 46.9 | X | X | ||
| T1 (A1Diesel) | 4 | 47.77 | X | |||
| T10 (A2B15A) | 4 | 85.37 | X | |||
| T9 (A2B15) | 4 | 86.22 | X | |||
| T8 (A2B5A) | 4 | 87.17 | X | |||
| T7 (A2B5) | 4 | 87.2 | X | |||
| T6 (A2Diesel) | 4 | 87.55 | X | |||
3.5 Exhaust gas results
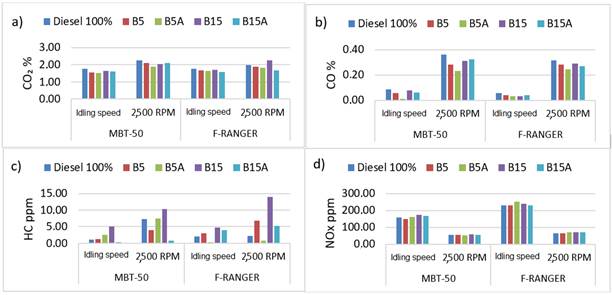
Figure 14 shows the relationship between CO2, CO, HC and NOx emission, with each of the fuels used in the idling speed and 2,500 rpm states. In the idling speed state, the MBT-50 vehicle reduced 12.8 % of CO2 and 88.2 % of CO when using the B5A mixture, 70 % reduction of HC with B15A, and the best values (minimum) with the use of B5 for NOx. Instead, the F-Ranger achieved a 10 % reduction in CO2 with the B15A mixture; 47.8 % CO and 87.5 % HC with B5A, and lower NOx emission with B15A.
At high rpm, the MBT-50 was reduced by 15.5 % CO2 and 35.4 % CO with mixture B5A, a decrease of 89.6 % in HC with B15A, and lower emission with B5A for NOx. On the other hand, the F-Ranger vehicle decreased by 26.4 % in CO2 emissions with the use of B15A; 15.1 % in CO, and 66.6 % in HC with B5A; and best results for NOx with B5 mixture. The results acquired are consistent with those obtained by 35, where, when testing biodiesel at low proportions, it concludes that the CO2, CO and HC emission parameters vary with engine speed by reducing their values compared to conventional diesel, in addition, a non-significant increase in NOx emissions is obtained, results that are consistent with the research of 36.
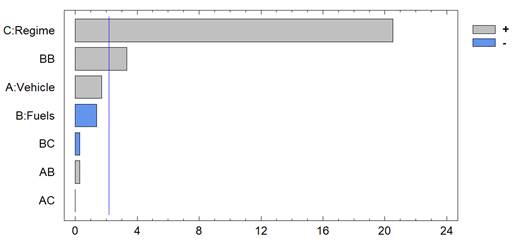
Figure 15 shows the relationship between the emission of CO2, depending on the vehicles, type of fuel, and speed, where the minimum values are obtained with the fuel B15A for low and high rpm, highlighting the influence of the how regime indicated in Figure 16 of Pareto.
In Figure 17, the ratio of CO emissions according to independent variables is indicated, defining the mathematical model that relates them to the type of fuel, vehicles, and regime. This results in the lowest emission with the fuel B5A for idling and B15 for 2,500 rpm, with an average value of 0.14 % CO, which highlights the influence of the regime followed by fuel, as indicated in Figure 18.
Figure 19 shows these emissions of HC in relation to the type of fuel, vehicles, and regime, in which the best values are obtained with fuel B15 and B15A in the idling state and B15A at 2,500 rpm, defining the mathematical model that relates them and reaching the average value of 5.04 ppm; highlighting the influence of the regime as indicated in Figure 20 it Pareto.
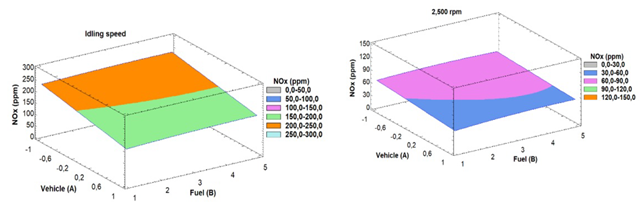
NOx = 119.65 - 24.5687 * A + 6.27232 * B - 66.9313 * C + 0.79375 * A * B + 15.1125 * A * C - 0.727679 * B^2 - 0.71875 * B * C
Figure 21 Estimated response surface for NOx analysis (Idling speed 2,500 rpm)
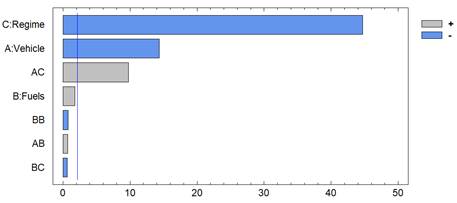
Figure 21 represents the ratios of NOx emissions and depending on the vehicles, fuel system, and speed, defines its mathematical model, obtaining the best values with the use of low percentages of biodiesel, with the B5 fuel being the best results for the two regime states, reaching the average value of 131.9 ppm, highlighting the influence of the regime followed by the vehicle, as indicated in Figure 22 it Pareto.
The results indicate that the mixtures with additives present the best results in the polluting emissions tests, with significant reductions in CO2, CO, and HC. This occurs because the additive increases the amount of oxygen in biodiesel fuel, reducing the exhaust emissions of carbon dioxide, carbon monoxide, hydrocarbons 37. The results agree with those obtained in the research carried out by 38, in which by adding an additive to palm biodiesel mixtures, reductions in the emission of carbon monoxide (CO) and carbon dioxide (CO2) are obtained in percentages of 14.33 % and 53.25 %, respectively.
Conclusions
After carrying out the mechanical and environmental tests with the biodiesel blends, the following conclusions are obtained:
Mechanical tests show that the best mixture is B5 because there is a non-significant decrease, in maintaining power and torque for the two vehicles compared to diesel. The results show that an increment in the percentage of biodiesel in the mixtures decreases the thermal efficiency of combustion.
The opacity results show a reduction of 59.3 % with the use of the B15A mixture in the MBT-50 vehicle, and 44.8 % with the B15 mixture in the F-Ranger, concluding that the opacity value decreases as the biodiesel percentage is increased.
The exhaust gas analysis was carried out in two engine speed states, obtaining reductions in CO2, CO, and HC emissions and a slight increase in NOx. The results indicate the most significant decrease in polluting gases (CO2, CO, and HC) with the use of additives in biodiesel mixtures for both states (idle and 2500 rpm), while NOx emissions rise slightly as the concentration of biodiesel increases.

