




 English (pdf)
 Article in xml format
 Article references

 Automatic translation
 Send this article by e-mail
 Cited by SciELO
 Cited by Google
 Similars in
SciELO
 Similars in Google

 Permalink


Introduction
Heavy metal pollution currently represents a critical concern around the world; these pollutants, coming from different industrial activities, have been reaching natural water sources1. Latin American countries have usually employed conventional technologies for the treatment of wastewater. These processes can eliminate many pollutants, but heavy metals can be persistent contaminants1-3.
For decades, several strategies have been employed for the removal of metals, such as (i) ion exchange and separation by membranes1,4, which can be costly treatments, while (ii) precipitation and adsorption 2,5 led to residual sludges production. Therefore, conventional techniques should not be considered definitive treatments and result in a necessary search for new and more effective alternatives for recovering heavy metals from wastewater.
Hexavalent chromium was selected as the model metal in the current work. This element of anthropogenic origin is produced by the petroleum industry and is used in the manufacture of paint, as a wood preservative, in steel production, in electronic devices, for metals finishing, in tanneries, the textile industry, and in the manufacture of corrosion inhibitors6. This metal represents a risk to human health and is in the group of carcinogenic compounds classified by the International Agency for Research on Cancer (IARC) (6,7. In the human body, chromium is absorbed in cells. It can be reduced intracellularly in mitochondria, which takes place by intercellular reducers, thus generating free chromium (V and VI) and hydroxyl radical species.
Heterogeneous photocatalysis currently represents a good alternative for heavy metal removal from wastewater. During the photocatalytic process, the photochemical reduction of metals takes place on the semiconductor surface as the result of photogenerated electrons8,9. Unlike other conventional treatments, photocatalytic removal may give a new life for some metals. As a result, the photoreduced elements on the semiconductor surface can contribute to obtaining new photocatalytic materials that could be employed in environmental remediation reactions induced by bimetallic photocatalysts10. Chemical photoreduction techniques have been extensively used in our research group and by other researchers for photocatalyst synthesis11,12, where interesting results have been obtained for the treatment of contaminants.
Different authors have reported the removal of chromium by using photocatalytic processes13-15. Photocatalytic reduction of chromium with the use of an electron donor or sacrificial agent has also been reported16. In the current study, TiO2-based photocatalysts were employed and modified by fluoridation, sulfation, and platinum addition in order to improve the efficiency of these semiconductors. Additionally, the effect of different reaction parameters was also evaluated. In general, it was found that fluoridation and platinization of TiO2 led to the generation of effective materials for Cr removal from the liquid phase. It has been determined that the photocatalytic reaction time is a determinant factor in limiting the effectiveness of global metal photoreduction.
Experimental procedure
2.1 Photocatalysts preparation
TiO2 sol-gel was obtained by controlled hydrolysis of titanium tetraisopropoxide (Aldrich, 97%) in an isopropanol solution (volume ratio isopropanol/water 1:1). The powder material was filtered and dried at 120°C for 12 hours. Afterwards, a portion of this material was calcinated at 650°C for 2 hours using a heating ramp of 4°C/min17. Commercial TiO2 Sigma Aldrich was used as the reference material.
Fluoridation was performed by immersing the uncalcined TiO2 powder in a 10 mM solution of NaF. The pH value selected for the fluoridation process was 3.0, facilitating the anchoring of fluorine ions on the titania surface. The solution used to control pH was 1M HCl. This suspension was left under continuous stirring for 1 hour, then filtered, dried, and calcinated at 650°C for 2 hours using a heating ramp of 4°C/min to obtain F-TiO217,18.
Sulfonation was obtained by suspending uncalcined TiO2 sol-gel powder in a 1M H2SO4 solution. This suspension was left under continuous stirring for 1 h. After this, the solid was filtrated, dried, and calcinated at 650°C for 2 hours using a heating ramp of 4°C/min to obtain S-TiO217,18.
The platinum addition on bare, sulfated, and fluorinated TiO2 was carried out using photochemical reduction. A suspension of these materials in a solution of the metal precursor was prepared (5g of each photocatalyst per liter of H2PtCl6.6H2O). 0.5% of the total weight of TiO2 was the nominal amount of Pt selected for this work. In this process, a solution of 0.3 M isopropanol was employed as an electron donor.
The Pt photodeposition was performed in a batch Pyrex reactor wrapped in aluminum foil under illumination for 2 hours with an intensity of 60 W/m2, which was measured using a Delta OHM HD 2102.2 photoradiometer. A continuous flow of N2 was employed to maintain an inert atmosphere inside the reactor. Finally, the photocatalysts were filtered and dried at 120°C for 12 hours. The materials synthesized were labeled as Pt-F-TiO2 and Pt-S-TiO217,18.
2.2 Photocatalysts characterization
A complete characterization of the photocatalysts prepared was performed, and the analysis for each instrumental technique was previously reported in different studies17-21. A general description of the equipment employed for this analysis is presented as follows:
The crystalline phase composition of the prepared materials was analyzed using a Philips PW1700 diffractometer.
Measurements of the Specific surface area (SBET) were performed in a Micromeritics ASAP 2010 instrument.
The UV-Vis DRS was recorded on a Varian spectrophotometer (model Cary 100).
X-Ray Fluorescence (XRF) spectrometry was used to find the chemical composition of the solids in a Panalytic Axios sequential spectrometer.
Morphology analysis and distribution of particles within the materials were carried out in a Philips CM200 microscope.
The Infrared spectroscopy analysis was performed using a Thermo Scientific Nicolet iS50 spectrometer.
X-ray photoelectron spectroscopy (XPS) analysis was performed with a Leybold-Heraeus LHS-10 spectrometer.
Chromium (VI) chemical photoreduction tests
Each of the synthesized photocatalysts was tested in the reaction of photochemical reduction of chromium. The reaction conditions employed in this study are described as follows:
Starting solution: 100 mL of a 0.4 mM solution of K2Cr2O7.
Photocatalyst loading: 1g/L.
Reactor: A 100 mL batch Pyrex reactor with a water flow cooling system to keep the temperature at 24°C.
Light source: An Osram Ultra-Vitalux lamp (300W) with a sun-like radiation spectrum in UVA and UVB.
Light intensity: 30 and 120 W/m2
Reaction atmosphere: Constant nitrogen flow of 0.84L/h or constant oxygen flow of 0.84L/h.
Total reaction time: 2 to 5 hours.
Sampling: The Cr concentration was monitored by taking aliquots from the reactor at different periods: 0, 2, 5, 10, 15, 30, 45, 60, 90, and 120 min.
Adsorption-desorption balance: The reaction suspension was homogenized by ultrasound for 10 min before the lamp was switched on.
To determine the actual effectiveness of the photocatalytic process, two blank reactions were carried out:
Direct UV-Vis light effect: Firstly, the K2Cr2O7 solution was maintained under continuous illumination and stirring without a photocatalyst.
Cr adsorption test: the suspension of each photocatalyst in the K2Cr2O7 solution was maintained in the dark under continuous stirring.
To ensure the repeatability of the photocatalytic treatment, duplicate trials were performed for each reaction, which found an error percentage of 0.1%.
Determination of chromium (VI) concentration: The variation in Cr (VI) concentration was determined by the 1,5-diphenylcarbazide (DPC) method at 542 nm22. For the spectrophotometric evaluations, a Thermo Scientific Evolution 300 UV-Vis spectrophotometer was used. Prior to the UV-Vis analysis, a pre-treatment was carried out on the samples. A colorimetric method that consisted of the addition of 1,5-diphenylcarbazide in an acid medium was used. This compound bound to Cr (VI) produces a violet color in the solution. The initial and final concentrations of each sample were taken into account to determine the percentage of chromium (VI) removal during the 2 hours of reaction.
Determination of total chromium content: The samples taken from the liquid phase during the reactions were examined before and after photocatalytic evaluation by using two methods described in the Standard Methods for Examination of Water and Wastewater: SM 3111B and 3113B. By following these methodologies, the Atomic Absorption Spectrometry techniques were determined in a Shimadzu AA-7000 spectrometer23. For this analysis, the flame atomization from air-acetylene combustion and a gas flow of 2.8 L/min were used. The light source used was a hollow cathode Cr/Ni model BGC-D2 lamp, and the wavelength selected for Cr determination was 357.9 nm.
Finally, to determine the real photochemical reduction or adsorption of chromium on the surface of the photocatalytic material, each of them was analyzed by XPS. From this technique, it was possible to identify the changes in the oxidation state of this chemical element. XPS analysis was performed using aluminum anodes as an X-ray source, using a constant step energy of 100 eV. The scale was corrected using the binding energy (BE) of the spectra by reference to the C- (C, H) component at 284.8 eV of the C 1s peak.
Results
Photocatalysts characterization
In general, the characterization results of the photocatalysts analyzed have been previously reported by our research group17-21. To compare the data in the current study, we included a summary of the main results as follows:
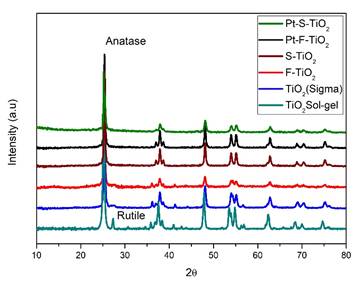
XRD:Figure 1 shows the XRD patterns of all photocatalysts; it was observed that crystalline phases Anatase and Rutile coexist only in TiO2 Sol-gel identified by their characteristic peaks located at the 2 theta positions of 25.23 and 27.33, respectively, the modified photocatalysts seem to be exclusive to the crystalline phase Anatase, possibly owing to the protective effect of F- and SO4 -2 on the surface of TiO2 during the calcination process17,21. The photodeposition of Pt nanoparticles during the process of preparing materials did not modify the composition of the crystalline phases of TiO224.
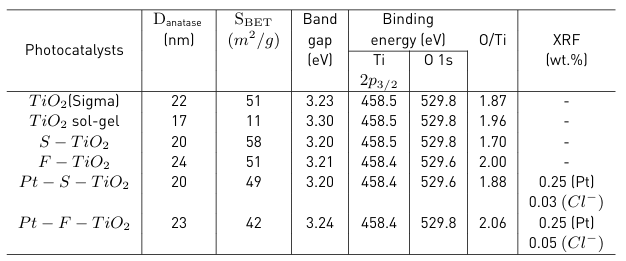
In Table 1, it was noted that the values of the anatase crystallite sizes increased after the sulfation and fluoridation treatments. It has been reported that the presence of F- ions improves the crystallinity of the titania and allows the anatase crystals to be larger19.
S BET : The lowest values in specific surface area corresponded to the TiO2 sol-gel due to the particles sintering in the calcination stage to 650°C (Table 1). In the S-TiO2 and F-TiO2 materials, the surface area value significantly increases, which agrees with the protective nature of the sulfate and fluorine species on the TiO2 surface during calcination, inhibiting the agglomeration of particles25. It was also observed that after platinization, the surface area decreases, which may be caused by the obstruction of the TiO2 pores by Pt nanoparticles17.
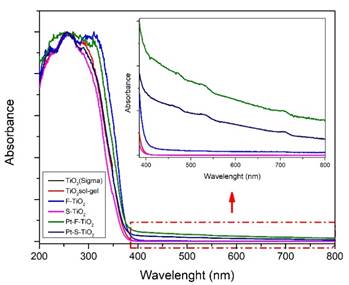
UV-Vis DRS: Band gap values of the photocatalysts calculated from UV-Vis DRS analysis show small decreases in these values after sulfation, fluoridation, and platinization, as observed in Table 1. UV-Vis DR spectra of all photocatalysts are presented in Figure 2; the characteristic absorption edge of TiO2 at around 360-380 nm can be seen for all samples. A slight absorption shift towards the visible region of the electromagnetic spectrum can also be observed for fluorinated and platinized photocatalysts; this is due to the presence of fluoride ions (F-) on the TiO2 surface26, and in the case of platinized materials due to the gray coloration of the powders attributed to the presence of Pt0 species on the surface.
XRF: From the XRF analysis, it was possible to determine that the real amount of platinum present in the samples was 0.25 wt.% for Pt-F-TiO2 and 0.25 wt.% for Pt-S-TiO2. These values are lower than the nominal 0.5 wt.%. Traces of chloride ions that came from the metal precursor were also found (Table 1)
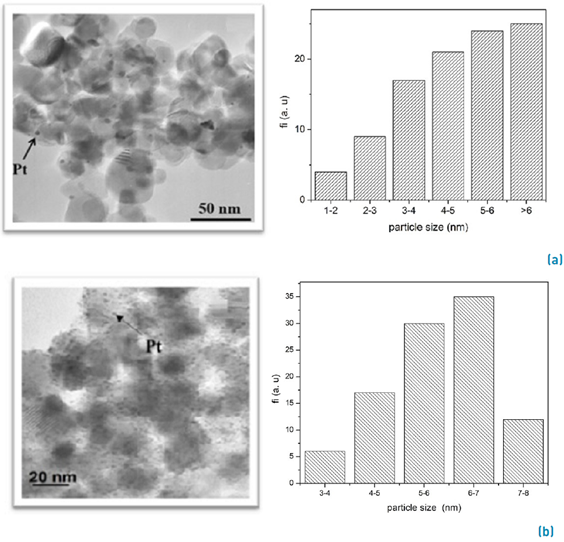
TEM: In Figure 3, TEM micrographs of the platinized samples are shown, where it is possible to observe small dark and spherical Pt particles, which are placed on the anatase surface. The histograms in Figure 3 represent the Pt particle size distribution. As seen in the Pt-F-TiO2 (Figure. 3a) sample, the Pt particles are distributed in a more heterogeneous way compared with Pt-S-TiO2 (Figure. 3b). The average metal particle size was > 6 nm for fluorinated photocatalysts and between 6-7 nm for sulfated photocatalysts. The highest dispersion of platinum on the sulfated photocatalyst could be due to its surface area, which is higher than that observed for Pt-F-TiO2 (Table 1). The presence of oxygen vacancies in the sulfated solid can also contribute to the homogeneous distribution of Pt9.
FTIR: Infrared spectroscopy analysis allowed the identification of OH-isolated groups, H-bonded hydroxyl groups, Ti-OH interactions, and Ti-OH2 interactions coming from water adsorbed on the TiO2 surface27.
XPS:Figure 4a shows the XPS analysis in the O 1s region with a signal located at 529.8 eV corresponding to the surface O2- species present in all photocatalysts as reported in Table 1. As it can be seen, the TiO2 sol-gel does not present a shoulder; however, when the sulfation and fluoridation process was performed, an evident shoulder located at 532 eV was observed, thus demonstrating the existence of OH- groups on the surface. The highest intensity of this shoulder observed in F-TiO2 and S-TiO2 photocatalysts may indicate a higher degree of hydroxylation in these materials, mainly due to the presence of oxygen vacancies. After platinum addition, the shoulder disappears: it is because the platinum on the surfaces attracts these electronegative groups to generate the photochemical reduction, thus changing the chemical environment and decreasing the hydroxylation on the surface for the Pt-F-TiO2 and Pt-S-TiO2.
The fluorinated photocatalysts were analyzed by XPS, and in the F 1s region, the main signal located at 684 eV in Figure 4b corresponds to fluoride ions present on the surface as ≡Ti-F species. In the fluorinated samples, an exchange of ligands between the F- and OH- on the TiO2 surface (≡Ti-OH) (28 exists. A decrease in the intensity of the fluorine signal was also observed after platinization: this is because the highly electronegative fluoride groups contribute to the photochemical reduction of Pt2+ to Pt0 so that the degree of surface fluoridation decreases in the Pt-F-TiO2. The atomic content of fluorine was 1.83% for F-TiO2 and 1.12% for Pt-F-TiO2.
As can be seen in Figure 4c, the Ti 2p3/2 region in TiO2 is very similar for all samples, with peaks centered at binding energies of 458.5±0.2 eV. This value is assigned to Ti4+ species present in the lattice of TiO2 as the main component: this indicates that the chemical environment of titanium was unchanged after modification by sulfation, fluoridation, or platinization.
Table 1 reports that the O/Ti atomic ratio estimated for the samples analyzed is lower than the stoichiometric value O/Ti=2, proving the presence of certain oxygen vacancies on the surface of this oxide. S-TiO2 showed the lowest O/Ti ratio of 1.70. This result agrees with what has been found in previous studies, where it is indicated that the pre-treatment of TiO2 with sulfuric acid and subsequent calcination at high temperature (> 600 ºC) results in a surface rich in oxygen vacancies29. In the case of Pt-S-TiO2 photocatalysts, the ratio O/Ti increases to 1.88, suggesting that oxygen vacancies were partially removed during the photodeposition process.
Figure 5 shows the spectra obtained for Pt 4f7/2 and Pt 4f5/2 in the Pt-S-TiO2 photocatalyst. From these spectra, it is possible to observe that in the platinized materials, species of oxidized and reduced Pt coexist. This can be seen by the characteristic doublets of these species located at 71 eV and 72.4 eV for Pt0 and Pt2+, respectively. These results indicate that platinum was not completely reduced on the TiO2 surface, as evidenced by the XRF analysis presented above.
The Pt-S-TiO2 sample was selected for XPS analysis before (Figure 5a) and after (Figure 5b) chromium reduction reactions. From this analysis, it was possible to determine that this material presents high stability after photocatalytic reaction, with no modifications in the Pt 4f region being observed.
Photochemical reduction of chromium (VI)
The main results obtained in the photochemical reduction of chromium (VI) reaction are represented in Figure 6. Firstly, a blank reaction under UV-Vis radiation and without a photocatalyst was carried out. During this test, a decrease in the chromium (VI) concentration (i.e., 4.83 %) was observed, which could be caused by a possible reduction of this metal on the glass reactor walls since they changed color after the reaction.
Then, a model reaction in the presence of the photocatalyst without irradiation was also performed. For this test, the material showing the best behavior in the Cr photocatalytic reduction reaction (Pt-S-TiO2) was selected. This demonstrated that the Cr adsorption on the solid can take place30, especially because after 5 hours under continuous stirring, the concentration of chromium in the liquid phase decreased by 21.5%.
Likewise, as reported in section 2.2, the adsorption-desorption balance was performed at the start of each reaction with the different materials. The Cr(VI) percentage removal from the fluid phase was very similar for all the photocatalysts, close to 11%, thus indicating similar surface adsorption properties for all materials.
During the photocatalytic reaction, it was possible to determine that when both UV-Vis radiation and photocatalyst are in the reaction medium, the reduction of chromium significantly increases. Thus, as seen in Figure. 6, the percentage of Cr (VI) removal is higher after reacting with all the photocatalysts tested.
As observed in Figure 6, during the first 20 minutes of the photocatalytic reaction, there is an important reduction in the concentration of chromium. However, after 30 min, the concentration of this metal had a slight tendency to increase. This behavior can be explained by the possible re-oxidation of chromium. Re-oxidation is mostly due to the competition of H2O for the holes and hydroxyl radicals such that the reduction of the metal is unfavorable, and the initial oxidation state of the metal species occurs, thus resulting in the desorption of the metal from the TiO2 surface30-33.
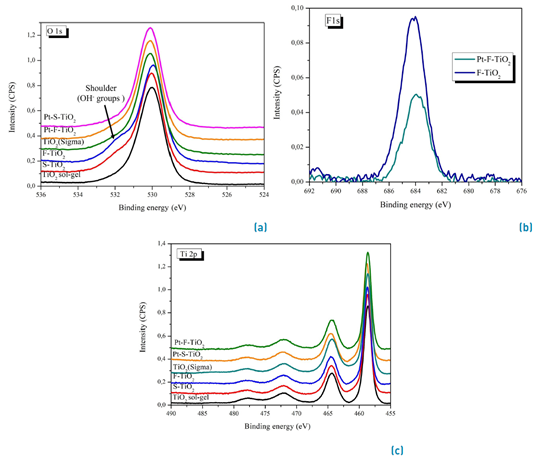
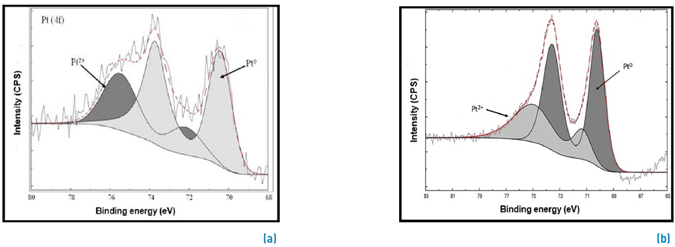
Figure 5 XPS spectrum of Platinum 4f region for Pt-S-TiO2. (a) before reaction and (b) after reaction
In general, it was observed that the processes of sulfation, fluoridation, and subsequent addition of platinum improved the photocatalytic activity of the TiO2 sol-gel, thus leading to an increase in the effectiveness of this oxide in the elimination of Cr (VI) in the reaction medium.
The best performance in the reduction of Cr was observed by using Pt-S-TiO2 as a photocatalyst after 2 hours of reaction. With this material, the concentration of chromium (VI) decreased up to 82,13%. At the end of the reaction, the Cr (VI) content in the fluid phase was 8.2x10⁻⁶ mM, equivalent to 0.42 mg/L of Cr (VI), which is lower than the maximum permissible limits given by the Colombian regulation for wastewater and surface water discharges (i.e., 0.50 mg/L) (34,35. As seen in Figure 7, only photocatalytic treatment with Pt-S-TiO2 compliance was achieved by Colombian regulation; however, the second-best performance was achieved with Pt-F-TiO2 (i.e., 0,52 mg/L Cr (VI))
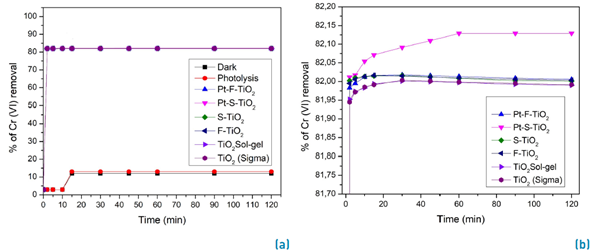
Figure 6 Percentage of Cr (VI) removal, determined by UV-Vis spectrophotometry. a) all reactions. b) Y-axis enlargement
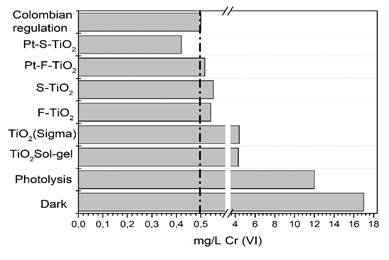
Figure 7 Concentration of Cr (VI) in mg/L after 2 hours of photocatalytic treatment compared Colombian regulation
The top activity observed with Pt-S-TiO2 in the photoreduction of Cr can be attributed to the physicochemical properties of this material: (i) this material presents a higher surface area than fluoridated material. (ii) Sulfation and Pt addition led to a small reduction in the band gap value compared to TiO2 sol-gel, thus leading to a decrease in the distance for the promotion of electrons from the valence band to the conduction band in the solid, resulting in a higher reaction efficiency. (iii) Platinized material exhibits absorption in the visible region of the electromagnetic spectrum, thus leading to a better use of the energy. (iv) As observed by TEM analysis, the distribution of Pt nanoparticles was the best and resulted in most of the particles on the surface being able to act effectively as a sink for the photogenerated electrons and increase the electron-hole half-time. (v) The TiO2 sulfation inhibits the rutile phase formation, thus allowing the anatase phase, which is considered more active in photocatalytic processes, to be favored17.
As previously indicated in Section 2, the Cr (VI) content was evaluated by UV-Vis spectrophotometry, while the total chromium content in the fluid phase after 2 hours of photocatalytic treatment was studied using atomic absorption spectrometry. Figure 8 represents the concentration of total chromium in the liquid phase at the end of the photocatalytic treatment. As shown in this figure, the final concentration of this metal was 4x10⁻³ mM (2,08mg/L) using Pt-S-TiO2 and 4.5x10⁻³ mM (2,34mg/L) with Pt-F-TiO2.
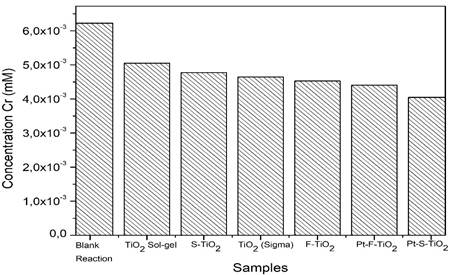
Figure 8 Total chromium concentration measured by atomic absorption spectroscopy in the samples after 2 hours of photocatalytic reaction
The overall trend of photocatalytic was TiO2 sol-gel < S-TiO2 < TiO2 (Sigma)
< F-TiO2 < Pt-F-TiO2 <Pt-S-TiO2: this is in good agreement with that also found by UV-Vis analysis. In order to determine the oxidation state of chromium deposited on the surface external of photocatalysts analyzed, TiO2 Sol-gel and Pt-S-TiO2 were selected to be studied by XPS. These solids were recovered after 2 hours of photocatalytic reaction.
Figure 9 presents the XPS spectra obtained for the Cr 2p3/2 region; signals are not very clear due to the low chromium content; however, by comparison with theoretical spectra26, the presence of characteristic signals of Cr6+, Cr3+, and Cr0 oxidation states was evidenced; these signals are located at 580, 576 and 574 eV, correspondingly. The results obtained show Cr0 after the reaction, species due to the photocatalytic treatment performed, allowing the Cr photoreduction on the photocatalyst surface. It has been widely reported in the literature that metals can present photochemical reduction, confirming the metallic spices of Cr0 on the surface of the solid29,36.
Best photocatalyst recycling: The stability of the photocatalyst Pt-S-TiO2 was evaluated by reusing it in four consecutive cycles. The reaction conditions included a light intensity of 120 W/m2, the presence of nitrogen as an inert gas, constant stirring, and a maximum time of 2 hours. The solid was recovered by filtration and drying at 100°C for 4 hours for use in the next cycle. As evidenced in Figure 10, after the 4th cycle, there was a 30% activity loss compared with the first cycle. This was probably due to the saturation on the surface of the photocatalyst by the reduced chromium species in each of the cycles.
Evaluation of the impact of reaction parameters on photochemical reduction of chromium
Since the Pt-S-TiO2 had the best performance in the photoreduction of Cr, this photocatalyst was selected to test the impact of different reaction parameters on the overall effectiveness of this material in the removal of Cr from the liquid phase. Table 2 describes the evaluated reaction conditions.
Light intensity effect: As shown in Figure 11, it was found that an increase in light intensity from 30 to 120W/m2 led to a higher effectiveness in the removal of Cr. This is mainly due to a higher photonic efficiency, which increases the energy available for the photocatalytic process.
Table 2 Reaction parameters evaluated in the Cr photoreduction reaction
| Reaction parameter | Reaction conditions |
|---|---|
| Light intensity | Time: 5 hours Light intensity: 30 W/m² or 120 W/m² Atmosphere: N₂ |
| Reaction time | Time: 2 and 5 hours Light intensity: 120 W/m² Atmosphere: N₂ |
| Reaction atmosphere | Time: 5 hours Light intensity: 30 W/m² Atmosphere: O₂ or N₂ |
Reaction time effect: It was also found that an increase in reaction time from 2 to 5 hours led to an increase in the concentration of chromium in the fluid phase. This is because, in the reaction medium, the Cr (III) species can compete with H2O for hydroxyl radicals and holes. As a result, the photoreduction of the metal is at a disadvantage, and the initial oxidation state of chromium is regenerated, as seen in Equation 137,38; then, a desorption of the Cr from the outside of TiO2 can occur.

Reaction atmosphere effect: It was found that with the reaction parameters used in this study, the reaction atmosphere (nitrogen or oxygen) did not significantly modify the reduction of Cr.
Conclusions
The materials synthesized were based on TiO2 and modified by sulfation, fluoridation, and subsequent platinization, which allowed the physicochemical properties of the final photocatalysts obtained to be controlled. The main differences observed in the materials synthesized were: (i) after modification, only the crystalline phase Anatase was obtained, thus avoiding the rutile formation, and (ii) after fluoridation and platinization, absorption in the visible region of the electromagnetic spectrum was favored.
The best photochemical reduction of chromium was obtained using Pt-S-TiO2 as a photocatalyst, under continuous stirring, N2 atmosphere, a light intensity of 120 W/m2, and 2 hours of final reaction time; these lab conditions are the starting point for a possible scaling up of the process.
The highest effectiveness from the photocatalyst Pt-S-TiO2 in the photoreduction of Cr can be explained as a synergic effect as a function of its physicochemical properties such as a high specific surface area, a slight reduction in bandwidth, homogeneous distribution of Pt nanoparticles, and a greater hydroxylation on the surface compared Pt-F-TiO2.
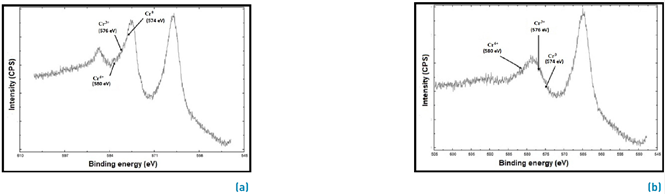
Figure 9 XPS spectra for Cr 2p3/2 region after photocatalytic reaction. a) Pt-S-TiO2 and b) TiO2 Sol-gel
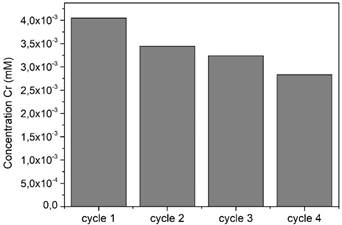
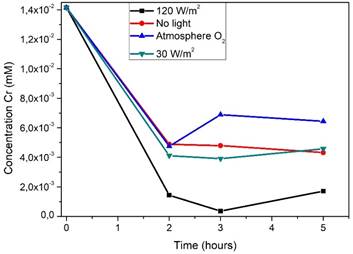
Figure 11 Effect of different experimental parameters evaluated in the Cr removal by photocatalytic reduction on Pt-S-TiO2
Heterogeneous photocatalysis based on TiO2 was found to be a suitable method for the removal of chromium (VI), which is present in effluents. These powders allow the photochemical reduction of chromium on the photocatalyst surface, which leads to efficient removal of this pollutant from the liquid phase, complying with the Colombian regulations of wastewater discharge for Cr (VI). However, the reaction time is a factor to be controlled: it is because it was observed that an increase above 2 h of total reaction time had a detrimental effect on the efficiency of Cr removal, which can be due to a re-oxidation and desorption of the metal from the photocatalyst surface.

