




 Spanish (pdf)
 Article in xml format
 Article references

 Automatic translation
 Send this article by e-mail
 Cited by SciELO
 Cited by Google
 Similars in
SciELO
 Similars in Google

 Permalink


Introduction
Egypt Government places a significant emphasis on the subject of water in terms of protecting its water resources and effective management, which has been translated into numerous, thorough, and detailed legal agreements with the nations of the Nile River, requiring them to fully comply with the agreements1-3. With population expansion and changing consumption patterns, the usage of natural resources grows dramatically. Due to rising demand, drought, groundwater depletion, and contamination, settlements face problems with their water supplies. By generating new sources of high-quality water supplies, water reclamation, recycling, and reuse might be a strategy to overcome some challenges with water resources. Water scarcity affects up to 1 million people annually and is a persistent water catastrophe 4. Water scarcity impacts large rural and urban populations, as well as the environment and agriculture. Due to the limited supply of water, especially in arid and semiarid regions, water consumption must be reasonable. Reusing water is among the best ways to conserve it. According to recent water reuse studies, replacing treated wastewater with irrigation water and industrial use water is the best water reuse strategy that is both commercially viable and generally accepted 5,6. Although there have only been a few studies on the subject, Farid H. Abed undertook one to study the replacement of fresh water using brackish groundwater and oily production waters in base course layers in sustainable pavement construction 7,8.
Complex systems that comprise sewers, chambers, pumping stations, maintenance holes, and wastewater treatment facilities make up modern wastewater management networks 9. Sewage water is primarily derived from residential sources, and it is primarily composed of water, with 0.1 percent of soluble, suspended, and settable organic and inorganic materials. Thus, sewage water is cleaned in a sewage treatment facility before being released into an inland river. Currently, rivers receive the treated effluent from sewage treatment plants. This treated effluent can also be considered as a potential source of water for particular applications with sufficient water quality control [M. Maeda et al.10]. In wealthy nations, sewage treatment plants treated effluent has been successfully applied to agriculture and industries (11, 12). One of the current options to use in building such projects and many other works is to use treated water and wastewater, which is regarded as a non-conventional water resource. According to estimates, this water resource contributes 70 million cubic meters (MCM) [per year], which, if used sustainably and responsibly, may be a reliable source of water (American Public Health Association 13).
Cement, lime, polymers, and other bonding agents, as well as fine and coarse aggregates, water, and other ingredients, come together intimately to form concrete. The dry mixture of aggregates and bonding agents forms a plastic mass when water is introduced, which is then simple to shape and sculpt into the required shape]. Around 7% of the world's total carbon dioxide (CO2) is produced by this cement 14. Cement Concrete (CC) has varying properties based on its constituents, which include relative and exact amounts of water. As a result, it is the most important building and architectural material in the world because of its formative ability to change its components, site preparation procedure, and curing process. In the same context, the components are made up of four major ingredients: water, Portland cement, aggregates, and air, comprising two parts (aggregates and paste). Aggregates are classified as fine or coarse and make up 60 to 80 percent of concrete. The paste is made up of cement water and entrained air and typically accounts for 20% to 40% of the total composite amount 15. Due to the necessity for high temperatures during the cement production process, there is also a significant energy requirement, which raises the overall cost of production 16,17. Concrete production rates have been continuously rising in recent years due to development, and they will do so in the years to come (18, 19), and 20. The phrase "green concrete" (GC) refers to concrete that has reached the plastic stage; Many long-term properties of GC essentially replace those of CC.; For example, it is defined as concrete that contains recycled materials as one of its components, or concrete whose manufacturing method is environmentally friendly and provides great performance throughout the life cycle of a building 21,22. Moreover, due to their ability to use innovative technology and alternative ecologically friendly materials, GC materials play an important role in decreasing the environmental impact of construction activities 23,24. As a result, GC has the ability to achieve both the environmental and economic goals of long-term development. Tests must be conducted on concrete in its plastic and stiff states to determine its workability, segregation, bleeding, hardness, strength, durability, and permeability 25. In concrete plants, water is used extensively for various purposes, including manufacturing concrete and cleaning patios, washing concrete mixer trucks, and sprinkling aggregates with water to lessen dust 26.
Regarding water utilization, using wastewater instead of potable water can make concrete production more environmentally friendly. Water is used in significant amounts in the building and public works industries, particularly in the production of concrete 27. In fact, concrete ranks second in terms of global usage only to water (10 billion m3/year, or 1.5 m3/person) 28. 150 liter of mixing water is used to manufacture one cubic meter of concrete 29. For washing concrete pumps, equipment, aggregates, curing concrete, and ready-to-use concrete, enormous amounts of drinking water are required (30, 31). As a result, the study of the life cycle analysis of building materials is significantly impacted by the consumption of water resources. It is critical to decrease fresh water consumption in all industries, especially the building sector, as water becomes more limited 32. The construction of 1 m3 of concrete (with a cement: sand: gravel ratio of 1:1.08:1.96 and water: cement ratio of 0.44) may use more than 220 L of water because water consumption is dependent on the ratio of water to cement 33. In the case of the presence of hydroxides and carbonates as well as the enhanced particle concentration, concrete mixed with wastewater exhibits high pH values, between 11 and 12, and high alkalinity 34. Due to these features, the effluent must be treated before being disposed of, whether in water or soil. It is important to eliminate impurities impairing the concrete's setting time, construction, and durability. These impurities can interfere with cement hydration reactions and the synthesis of its components in the water used to mix the concrete.
The development's environmental impact can be reduced by using water wisely throughout the process. It is important to use as little water as possible when building a structure, and disposing of old and contaminated water properly will help minimize the environmental impact of construction. Design and construction methods used in sustainable architecture avoid or reduce the damaging effects that the construction sector has on the environment 35. Most well-known sustainability initiatives strongly emphasize on energy efficiency and the environment, water quality and resources, site selection and development, indoor environmental quality, and material quality and resources. Getting closer to better sustainability is difficult because of the aforementioned complicated interrelationships 36. In this context, this study aims to use treated wastewater (TW) instead of potable water to produce concrete for Egypt's new administrative capital city and to explore ways to save the nation with vast quantities of clean water, especially in light of the current water crisis 37. This work set out to find ways to partially or entirely substitute tertiary-treated wastewater for potable water in the production of concrete. Property evaluations of the freshly laid and cured concrete were implemented in order to determine the best water quality that may be used without sacrificing the quality or longevity of concrete.
Materials and methods
From the sewage treatment plant at The Valley Higher Institute for Engineering and Technology, Al- Obour, Egypt, samples of reclaimed wastewater (TWW) were taken and chemically examined according to The Egyptian Code for the Design and Implementation of Concrete Structures 2017.
Table 1 Mix design proportion (Average Strength= 40 MPa)
| Material | Dolomite | Sand | Cement | Water |
|---|---|---|---|---|
| Mix Proportion (Kg/m3) | 1120 | 585 | 500 | 200 |
Table 2 Uses of Potable water and waste-treated water for Tested Groups
| Group no. | Casting Water | Curing Water |
|---|---|---|
| 1 | Potable Water | Potable Water |
| 2 | Waste Treated Water | Potable Water |
| 3 | Potable Water | Waste Treated Water |
| 4 | Waste Treated Water | Waste Treated Water |
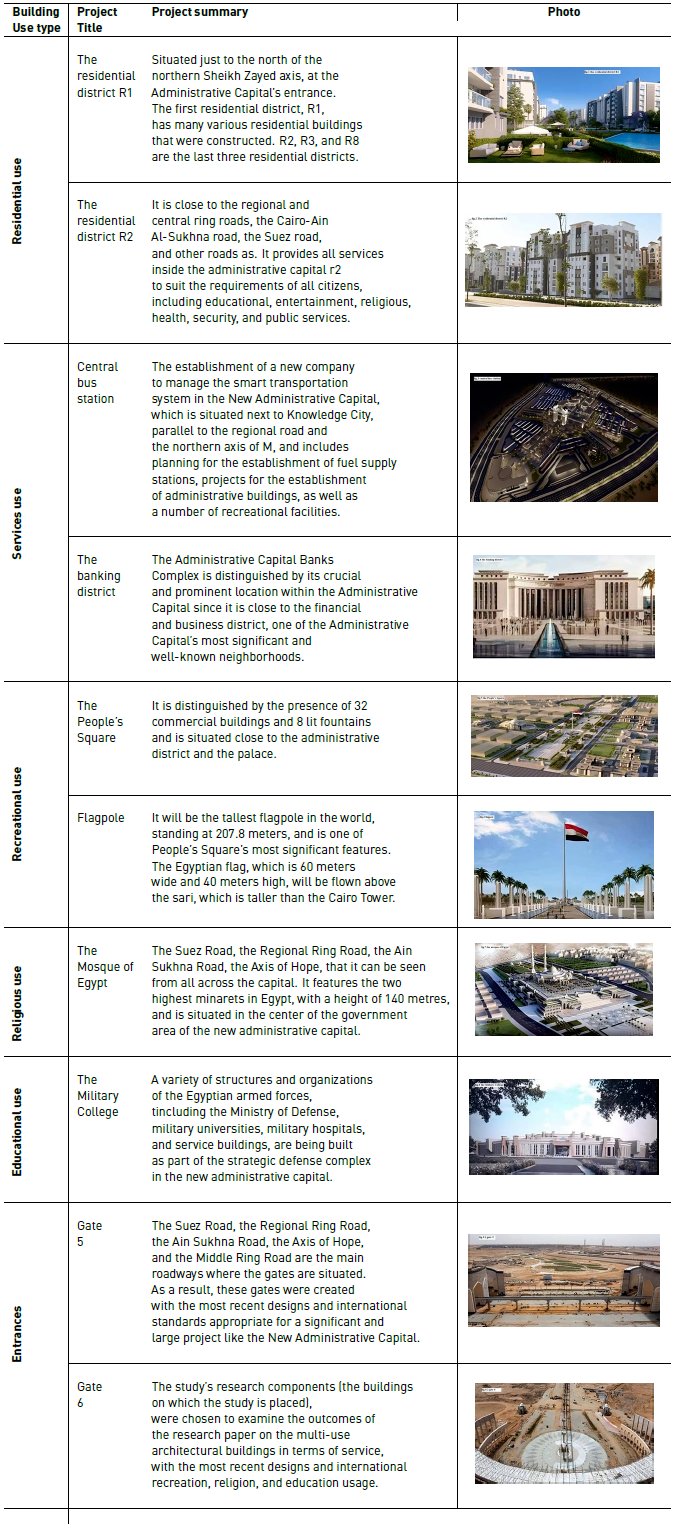
The analysis was completed in the Central Laboratory (the Water and Soil Analysis Unit), at the Desert Research Center (DRC). Furthermore, potable water (PW) was evaluated for comparison purposes. Also, this section describes the experimental work performed through this study, beginning with the used materials, specimen details, measurement devices, test setup, and specimen grouping. All materials used to manufacture concrete were also examined. Ordinary locally available concrete constituent materials have been used to manufacture the test specimens. All specimens are made from one concrete mix with the proportion shown in Table 1. The target standard 28-day compressive cube strength ƒ cu = 40 MPa, and according to the equivalent compressive cylinder strength ƒ' c = is 32 MPa. The results of testing cubes have satisfied the target strength. Data of Egypt’s new administrative capital city Projects 2022 were taken from the Engineering Authority of the Armed Forces, which are displayed in Tables 7 and 8.
Four groups of 60 concrete standard cubes and 24 standard cylinders were cast. Each group consists of 15 cubes divided into 3 cubes that were tested after 7, 28, 90, 180, and 365 days. A direct tensile split test was conducted directly on 24 standard cylinders after 7 and 28 days for the four groups, each reading representing the average value of 3 specimens. The first group was cast with fresh normal water, and cured with fresh normal water as a control specimen. The second group was cast with fresh water but cured with treated water. The third group was cast with treated water but cured with fresh water. Finally, the fourth group was cast and cured with treated water. Table 2 describes tested cube specimens for each group, while Table 3 represents the chemical characteristics of concrete mixing water according to ECP 203/2018 to show the quality of water use; additionally, Tables 4 and 5 refer to the physical and chemical characteristics of treated wastewater, and Table 6 reports the standard requirements for Potable Water according to World Health Organization.
Table 3 Representation of the chemical characteristics of concrete mixing water according to ECP 203/2018. 38
| Parameter | Results |
|---|---|
| pH | 7 |
| TDS gm/L | 2.00 |
| Chloride gm/L | 0.50 |
| Sulfate gm/L | 0.30 |
| Carbonate and Bicarbonate gm/L | 1.00 |
| Sodium Sulfide gm/L | 0.10 |
| Organic Substances gm/L | 0.20 |
| Inorganic Substances (Clay and suspended particles) gm/L | 2.00 |
Table 4 Physical and Chemical characteristics of treated wastewater (TWW)
| Parameter | Results |
|---|---|
| pH | 6.1 |
| Electrical conductivity (EC) µS/cm | 394 |
| Total dissolved solids (TDS) mg/L | 241 |
| Calcium mg/L | 29 |
| Magnesium mg/L | 17.7 |
| Sodium mg/L | 20 |
| Potassium mg/L | 11 |
| Carbonate mg/L | 0 |
| Bicarbonate mg/L | 230 |
| Sulfate mg/L | 10 |
| Chloride mg/L | 38.3 |
Table 5 Representation of the analysis of Heavy metals in treated wastewater
| Element | Ag | Al | Ni | B1 | B2 | Ba | Mn | Ca1 | Ca2 | Cd | Sb | Co | Mg |
|---|---|---|---|---|---|---|---|---|---|---|---|---|---|
| Units | ppm | ppm | ppm | ppm | ppm | ppm | ppm | ppm | ppm | ppm | Cts/S | ppm | ppm |
| Average | -0.368 | 0.4744 | 0.0388 | -0.2428 | 0.1702 | 0.0485 | 0.0448 | 20.75 | 34.90 | 0.0016 | zero | -0.027 | 13.83 |
| Stddev | 0.0820 | 0.4618 | 0.0574 | 0.8133 | 0.1148 | 0.0126 | 0.0554 | 18.76 | 2.34 | 0.0284 | zero | 0.0981 | 0.98 |
| % RSD | 223.0 | 97.36 | 147.8 | 334.9 | 67.41 | 25.92 | 123.6 | 90.42 | 6.702 | 1772 | zero | 361.7 | 7.053 |
| # 1 | 0.0309 | 0.3645 | -0.044 | -0.7124 | 0.1040 | 0.0462 | 0.0931 | 3.768 | 35.45 | 0.0327 | Z | -0.082 | 13.99 |
| 5.733 | |||||||||||||
| # 2 | -0.0132 | 0.0774 | 0.1040 | -0.7124 | 0.3027 | 0.0621 | 0.0572 | 40.89 | 36.92 | -0.05 | Z | 0.1079 | 14.72 |
| 5.467 | |||||||||||||
| # 3 | -0.1280 | 0.9812 | 0.0169 | -0.7124 | 0.1040 | 0.0373 | -0.0157 | 17.59 | 32.34 | -0.0229 | Z | 0.0554 | 12.78 |
| 4.463 | |||||||||||||
| Element | Cr | Cu | Si | Sn | Sr | Ti | Zn | Mo | Fe1 | Fe2 | V | Pb | |
| Units | ppm | ppm | ppm | ppm | ppm | Cts/S | ppm | ppm | ppm | ppm | ppm | ppm | |
| Average | -0.2832 | 0.1730 | 1.819 | 35.83 | 0.3922 | Zero | 0.0213 | 0.0386 | -0.406 | 0.426 | -0.139 | 0.0660 | |
| Stddev | 0.3192 | 0.4862 | 0.073 | 8.35 | 0.0355 | Zero | 0.0327 | 0.0921 | 0.729 | 0.297 | 0.0442 | 0.670 | |
| % RSD | 112.7 | 281.1 | 3.988 | 23.32 | 9.058 | Zero | 153.6 | 238.7 | 179.4 | 69.85 | 318.4 | 0.1016 | |
| # 1 | 0.0236 | -0.1709 | 1.807 | 27.30 | 0.4079 | Z 23.40 | -0.0107 | 0.1400 | -0.418 | 0.234 | -0.361 | -0.463 | |
| # 2 | -0.6135 | 0.7292 | 1.897 | 36.17 | 0.417 | Z 23.20 | 0.0547 | 0.0155 | 0.328 | 0.7690.819 | -0.426 | 0.8199 | |
| # 3 | -0.2596 | - 0.0394 | 1.753 | 44.00 | 0.3515 | Z 22.50 | 0.0198 | -0.039 | -1.13 | 0.270 | -0.370 | -0.158 |
Table 6 Standard Requirements for Potable Water
| ECP203 of potable water | World Health Organization39 | |
|---|---|---|
| T. D. S | 500 mg/L | 1000 mg/L |
| T. S. S | - | - |
| pH | 6.5-8.5 | 6.5-8.5 |
| COD | - | - |
| BOD | - | - |
Results and discussions
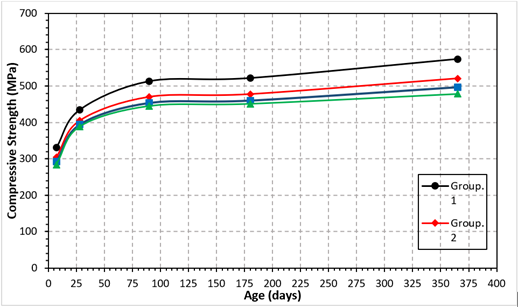
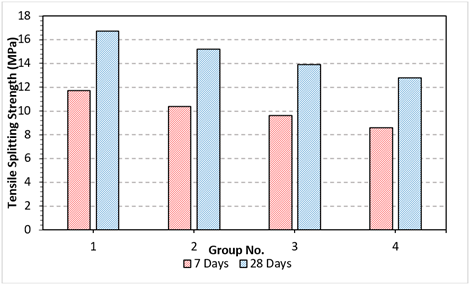
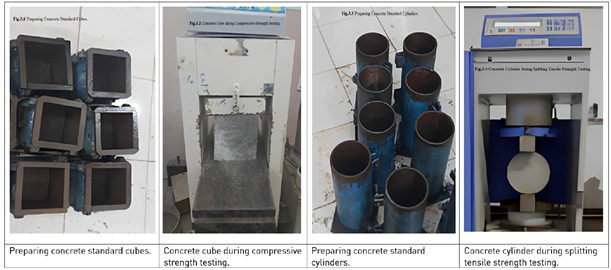
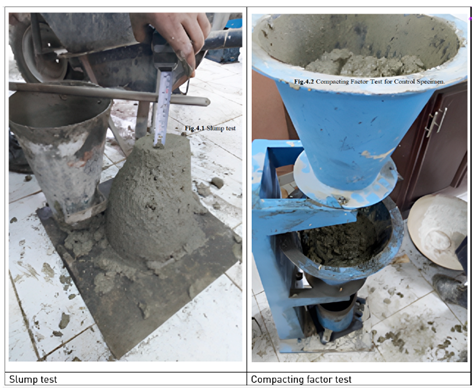
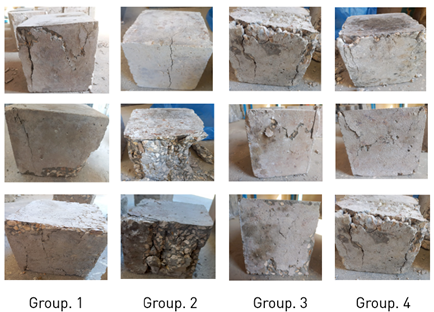
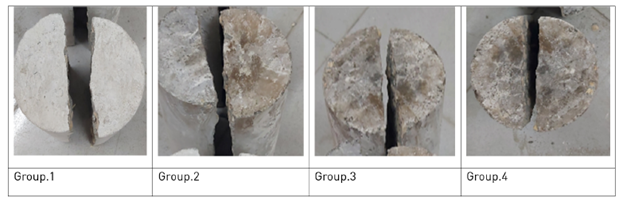
All results for all tested groups are presented in Table 9. A comparison of Compressive strength for four groups is presented in Figure 1. The comparison illustrates that the values of compressive strength decreased when treated water was used for casting or curing concrete. However, the compressive strength of concrete for groups 2, 3, and, 4 decreased by 9%, 11%, and 12%, respectively, compared to control group 1, in which the average of these percentages presented values of compressive strength at different ages for concrete 7, 28, 90, 180 and 365 days, these were discussed in details in Table 8. The tensile splitting strength of the concrete was also compared at 7 and 28 days for the examined four groups, as presented in Figure 2. Procedures for casting and testing of concrete standard cubes and cylinders are presented in Figure 3. Slump and compacting factor testing for fresh concrete were conducted for all groups; it provides good agreement with ECP 203-2018 guiding values for slump ranges from 75 to 125 mm for reinforced concrete sections with steel reinforcement varied from 80 to 150 kg/m3 and gives compacting factor value greater than 95% for the same reinforced concrete requirements. Figure 4 presents the slump and compacting factor for fresh concrete of group (1). Splitting tensile strength decreased by 10, 17, and 14 %, respectively, for groups 2, 3, and 4, which had good results in agreement compared to the control-tested group. From the failure modes of the standard cubes and cylinders, it is noticeable that some staining appears on a concrete surface, especially in the samples that were poured and treated with treated water, as presented in Figures 5 and 6, respectively. After completion of 7, 28, 90,180, and 365 days of the curing period, two cylinders for each concrete mix group were immersed in water for 24 hours, the concrete specimens were prepared, and initial weights of all cylinders were taken. After completion of every curing stage, weights of all cubes were taken again and registered as the final weight. The amount of water absorption in dried and cured cubes was calculated and compared in Table 10. This test is performed to determine the susceptibility of unsaturated concrete to the penetration of water. It measures the rate of absorption of water and other liquids into unsaturated concrete through capillary suction. Using treated wastewater for casting concrete had the highest percentage of voids (approximately 18%), which gave good agreement results compared to using potable fresh water for concrete casting (approximately 12%), Water mixing was the significant parameter that governed water absorption and void volume of concrete samples as presented in Table 10.
Conclusions
The results obtained from the experimental study of various concrete mixes showed that wastewater had no significant negative effect on the mechanical properties of concrete, so using wastewater will save about 257349.386 m3 and 763905.677 m3 for standard and reinforced concrete quantity for the current case study in new administrative capital. Slump value had no significant change when using treated water for concrete casting or curing and agreed with the Egyptian code of practice for the design of reinforced concrete structures ECP 203-2018. The findings show that the compressive strengths of concrete groups 1, 2, and 3 decreased by 9%, 10%, and 11%, respectively, in comparison to concrete cast and curing with 100% potable water. Based on the obtained laboratory results for ages 7, 28, 90, 180, and 365 days, wastewater had a minor effect on the compressive strength results of concrete; however, it was used for casting or curing concrete at different ages. Splitting tensile strength had no significant negative impact by using treated water except for specimens cured with treated water.
Table 8 Egypt’s New Administrative Capital City Projects:
| Reinforced concrete quantity (m3) | Quantity of water for reinforced concrete (L) | Quantity of water for normal concrete (L) | Quantity of normal concrete (m3) | project Name | No |
|---|---|---|---|---|---|
| 1995426 | 349199550 | 85206625 | 486895 | Residential district R1 | 1 |
| 1016111.313 | 177819479.8 | 40645224.38 | 232258.425 | Residential district R2 | 2 |
| 22751.5 | 3981512.5 | 1568175 | 8961 | Gate 5 | 3 |
| 3470 | 607250 | 11200 | 64 | Gate 6 | 4 |
| 534746 | 93580550 | 21034125 | 120195 | Central bus station | 5 |
| 6860 | 1200500 | 165025 | 943 | Development and expansion of the entrances to the capital | 6 |
| 502964 | 88018700 | 44433550 | 253906 | Banks Complex | 7 |
| 1920 | 336000 | 158375 | 905 | The new works of the people's arena | 8 |
| 8944 | 1565200 | 1158500 | 6620 | Flag column | 9 |
| 148995 | 26074125 | 3383625 | 19335 | Colleges and military institutes | 10 |
| 5000 | 875000 | 52500000 | 300000 | Egypt Mosque | 11 |
| 117987484 | 20647809.7 | 7084962.5 | 40485.5 | People's arena | 12 |
| 4410175.297 | 763905677 | 257349386.9 | 1470567.925 | Total | 13 |
Table 9 Compressive strength, splitting tensile strength, and slump,
| Group no. | Compressive Strength (MPa) | Splitting Tensile Strength (MPa) | Slump (mm) | Compacting Factor | |||||
| 7 days | 28 days | 90 days | 180 days | 365 days | 7 days | 28 days | |||
| 1 | 330.37 | 434.70 | 512.95 | 521.70 | 573.85 | 11.70 | 16.70 | 56 | 0.98 |
| 2 | 304.10 | 405.50 | 470.40 | 477.90 | 520.90 | 10.40 | 15.20 | 58 | 0.97 |
| 3 | 291.90 | 394.50 | 453.70 | 460.20 | 497.10 | 9.60 | 13.90 | 55 | 0.94 |
| 4 | 283.80 | 388.90 | 445.30 | 451.30 | 478.40 | 8.60 | 12.80 | 56 | 0.97 |
Table 10 The average percentage of Water Absorption and Void Volume of Concrete Samples
| Group no. Age (Days) | The Volume of Voids (%) | ||||
|---|---|---|---|---|---|
| 7 days | 28 days | 90 days | 180 days | 365 days | |
| 1,3 | 9.40 | 10.70 | 11.60 | 13.40 | 12.00 |
| 2,4 | 12.20 | 15.23 | 14.08 | 17.70 | 13.77 |
From the paper results, the usage of partially or fully treated water may already have been reported, according to some observations; however, for pouring or curing concrete to save a considerable amount of potable water. The limits of this study are valid for concrete ages up to 365 days. The deficiency in compressive strength values of concrete is related to the number of tested samples and may vary with more samples.
Recommendation
For further research, it is recommended to:
Examine more and more specimens from cubes and cylinders at different ages to validate the effect of using wastewater on compressive strength and splitting tensile strength of concrete.
Examine the flexural strength of concrete through prism specimens to investigate the effect of using treated water, to cast or cure the results.

