


 English (pdf)
 Article in xml format
 Article references
 Send this article by e-mail
 Cited by SciELO
  Cited by Google
  Similars in
SciELO
Similars in
SciELO  Similars in Google
 Permalink
INTRODUCTION
The importance of exports for the macroeconomic performance of developing countries has been an important concern of economists. In the case of the Mexican economy, there has been an important expansion of exports ever since the establishment of the North American Free Trade Agreement (nafta). It is worth mentioning that a theoretical basis for the opening of the Mexican economy and its inclusion in nafta was the Export-Led Growth Hypothesis. This approach considers that the main determinant of economic growth is the exporting sector. Several empirical studies have been undertaken, on the basis of a production function that includes exports, with the objective of verifying the effect of the externalities of exports and spillover on the rest of the economy (Feder, 1983; Balassa, 1985; Esfahani, 1991). Therefore, this theoretical perspective considers that the positive relationship is based on the effect of exports on the economy’s overall productivity. Hence, exports contribute to economic growth by increasing capacity utilization, economies of scale and competition that promotes incentives for technological improvements and better management. As a result, the marginal productivities are higher in export industries (Feder, 1983). Also, exports are concentrated in efficient economic sectors and, therefore, export expansion increases the economy’s overall total productivity (Balassa, 1985).
Subsequently, a number of theoretical and empirical papers have shown results in favor of exports as an economic growth engine. The results have provided important information on the link between exports and growth. However, it has been pointed out that the results of that line of research have not been able to develop an unequivocal statement regarding this subject. Among the reasons that explain the limited progress of the literature, Donoso and Martin (2010) emphasize in the heterogeneity of methodologies employed to estimate the link between exports and growth. Therefore, in order to answer that question, it is necessary to consider the comparative advantages that determine the activities that produce economic growth in the long run, such as externalities, technology, etc. (Feenstra, 1996). That is why the experiences in Southeast Asia and China have their own particular set of economic conditions that might not be replicable in other countries.
The expansion of Mexican manufacturing exports to the usa was encouraged by trade liberalization that initiated before nafta was implemented (Gruben, 2001). Also, the agreement stimulated the dismantling of the import substitution period and the reduction of tariffs and non-tariff barriers. Finally, as a result of the trade liberalization process and the proximity to the usa , an important surge of Mexican manufacturing activities to be exported to the us market, was experienced during the decade of the nineties (Hanson, 1998).
However, even though there has been an important expansion of exports, Mexican economic growth has been rather slow. Ruiz-Nápoles (2001), based on an input-output matrix, concluded that exports have a positive but minimal effect on Mexican economic growth, which is offset by the negative effect of increasing imports and the lack of economic integration.
The expansion of Mexican exports is closely related to foreign direct investment (fdi). However, it has been argued that the development of global value chains, which is an important determinant of fdi in the exporting sectors of Mexico (automobiles, electronics), has disrupted domestic production chains and has increased the demand for imports. The lack of domestic market integration has limited the overall formation of capital and has reduced the growth capacity of the Mexican economy (Moreno-Brid, Rivas and Santamaría, 2002).
In order to corroborate that the increase of exports has promoted economic growth, it is important to analyze this relationship by including regional analysis at the state level. By analyzing exports and economic growth at the state level for the period 2007-2014, the paper seeks to estimate the relationship between the two, considering the different regional components of the overall growth of the Mexican economy. In order to be able to incorporate the regional approach, exports, GDP and other variables will be disaggregated at the state level.
The paper is structured as follows: the first section analyzes the empirical evidence between export expansion and economic growth; section two presents a review of the main contributions to the study of the relationship between exports and economic growth; section three develops the theoretical approach of the paper; section four describes the methodological aspect of the paper; results of the econometric estimations are presented in section five and the conclusions in section six.
1. EXPORTS AND ECONOMIC GROWTH IN MEXICO
Mexican exports have had an important expansion since the 1990s. The annual average rate of growth (aa rg) from 1994 to 2015 was 8.7%. During the decade of 2000, the rhythm of growth has diminished, particularly during the economic recession of 2008 and 2009. As a result, during the period 2007-2015 the aa rg decreased to 4.2%, which, although considerably slower than the whole period, can still be considered accelerated. According to estimations based on data form the National Institute of Statistics, Geography and Informatics (inegi), the rapid growth was caused by the explosion in manufacturing exports, which experienced an aa rg of 9.1% between 1994 and 2015. In 2003 the share of manufacturing exports reached 96.8% of all non-oil exports (Figure 1). This trend continued and by 2015, the share only diminished to 95.1%. Since the Mexican economy has become an important exporting economy, it is relevant to analyze the magnitude of the effect of the export sector on the overall performance of the economy.
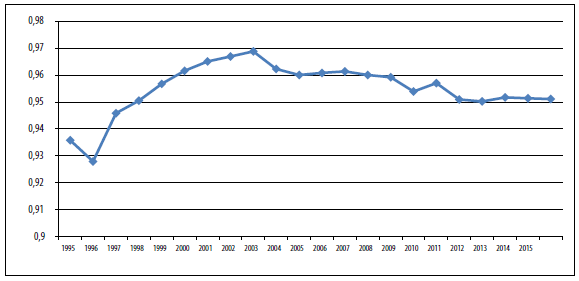
Source: own elaboration based on data from the National Institute of Statistics, Geography, and Informatics (INEGI).
Figure 1 Evolution of the manufacturing exports share of total non-noil exports
It is possible to conclude that any important positive impact of exports on overall economic growth is therefore related to the manufacturing exports. It has been argued that exports could be an important source of growth because it provides capital, technology and economies of scale that could contribute to the growth of the exporting economy. When correlating exports with gdp growth at the state level in Mexico for the period 2007-2014, a slight positive correlation was found (Figure 2), which tends to corroborate the hypothesis that exports at the regional level have a positive effect on regional economic growth.
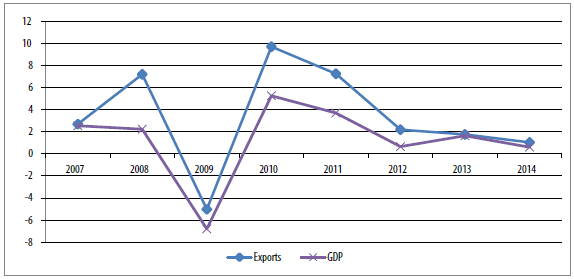
Source: own elaboration based on data from the National Institute of Statistics, Geography, and Informatics (INEGI).
Figure 2 Mexico: annual average rates of growth of GDP and exports, 2007-2014
Additionally, several states that experienced the fastest export growth also showed a rapid increase of gdp, therefore suggesting that at the regional level exports and economic growth have a positive correlation in the case of the Mexican economy. Table 1 shows that states that are located in the northern border region of Mexico or in the corridor between Mexico City and the northeast border have experienced comparatively rapid growth; this is the case of Coahuila, Nuevo Leon, the state of Mexico, and Guanajuato. Also, it is interesting to notice that those states have also had relatively rapid expansion in terms of exports and foreign direct investment (FDI).
Table 1 GDP, exports and IED principal state shares, 2014
| State | PIB | State | Exports | State |
| DF | 16,52% | Chih | 3,7% | DF |
| Mex | 9,30% | BC | 2,9% | Guan |
| NL | 7,29% | Coah | 2,8% | Col |
| Jal | 6,54% | NL | 2,6% | Mex |
| Ver | 5,09% | Tam | 2,2% | NL |
| Camp | 4,24% | Mex | 1,9% | Chia |
| Guan | 4,18% | Camp | 1,8% | Guer |
| Coah | 3,40% | Jal | 1,5% | BC |
| Pue | 3,16% | Guan | 1,4% | Ver |
| Tab | 3,14% | Son | 1,3% | SLP |
Source: own elaboration with data form the Economic Information Bank (BIE), National Institute of Statistics and Informatics (INEGI).
It is worth mentioning that the states’ accumulated value of exports and fdi for the period 2007-2014 showed that there is a positive correlation between a higher value of exports and the highest level of fdi (Figure 3). Therefore, there is empirical evidence of a link between fdi, exports and growth.
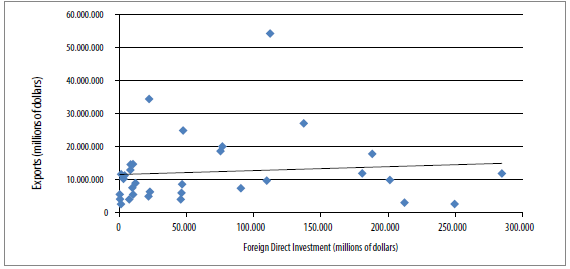
Source: own elaboration with data form the Economic Information Bank (BIE), National Institute of Statistics and Informatics (INEGI).
Figure 3 Mexico: State accumulated exports and FDI, 2007-2014 (millions of dollars)
When analyzing the performance of economic growth at the regional level for the period 2007-2014, several important characteristics were found. The first is that the growth of the gdp in nominal terms was very heterogeneous among states. Particularly, states in the central region of Mexico that are specialized in automobile industry exports such as Queretaro, Guanajuato and Aguascalientes, showed the highest rates of annual average growth (Table 2). Additionally, the states that experienced the highest rates of economic growth also exhibited a rapid expansion in exports, as is again the case of Queretaro, Guanajuato and Aguascalientes.
Table 2 Mexico: Annual average growth of GDP, total investment and exports, 2007-2014.
| States | GDP | Total investment | Exports |
| Zacatecas | 6,23% | 18,80% | 5,40% |
| Querétaro | 5,18% | -1,57% | 14,10% |
| Guanajuato | 4,69% | 1,75% | 13,91% |
| Tabasco | 4,65% | 32,70% | 4,53% |
| Hidalgo | 4,15% | -7,51% | 4,01% |
| Aguas Calientes | 4,14% | 12,51% | 9,29% |
| Quintana Roo | 4,06% | 10,98% | -10,67% |
| Nayarit | 3,76% | 1,80% | 15,86% |
| Coahuila | 3,70% | 3,07% | 9,84% |
| Sonora | 3,67% | 2,48% | 2,64% |
| Oaxaca | 3,64% | -53,10% | 11,14% |
| Yucatán | 3,62% | -28,48% | 3,08% |
| Chiapas | 3,54% | 17,08% | 6,82% |
| San Luis Potosí | 3,51% | -10,61% | 8,08% |
| Michoacán | 3,49% | -3,35% | 16,06% |
| Colima | 3,47% | 5,82% | 17,44% |
| Estado de México | 3,44% | 3,54% | 13,83% |
| Tlaxcala | 3,41% | -1,05% | 7,14% |
| Jalisco | 3,30% | 1,22% | 3,72% |
| Nuevo Leon | 3,06% | 13,77% | 6,64% |
| Puebla | 3,05% | 3,47% | 4,41% |
| Durango | 3,01% | -11,78% | 10,73% |
| Veracruz | 2,96% | 7,08% | 7,65% |
| Sinaloa | 2,77% | 0,61% | 12,32% |
| Guerrero | 2,72% | -10,70% | 17,80% |
| Baja California Sur | 2,53% | 3,84% | 2,93% |
| Morelos | 2,50% | 5,97% | 8,75% |
| Chihuahua | 2,41% | -3,83% | 6,92% |
| DF | 2,19% | 31,46% | 0,32% |
| Tamaulipas | 2,00% | -21,42% | 2,82% |
| Baja California | 0,78% | -10,92% | 1,34% |
| Campeche | -2,17% | 42,56% | -3,68% |
Source: own elaboration with data from the Economic Information Bank (BIE), National Institute of Statistics and Informatics (INEGI).
It is important to underline that the total investment varied at the state level. On the one hand, some states experienced very negative annual average rates of growth of total investment, for example Hidalgo, Oaxaca, Yucatán, Durango and Baja California. On the other hand, other states experienced high annual average rates of growth during the same period, as is the case of the Federal District, Campeche, Nuevo León and others. Finally, it is important to point out that there are some states that experienced negative effects of total investment on the GDP but were Exports and economic growth in Mexico, 2007-2014: a panel cointegration approach partially compensated by the positive expansion of exports. Therefore, the states of Queretaro, Chihuahua, Baja California, Oaxaca, Michoacán, among others, exhibited negative growth rate of total investment in the period but had both positive GDP and exports growth.
Consequently, the recent evolution of the Mexican economy at the state level suggests that exports have encouraged economic growth and have also become a factor to offset the impact of the lack of dynamism in domestic investment at the regional level. Further econometric evidence is required to corroborate the trends observed in the regional economic data of the Mexican economy.
The rapid expansion of the export-manufacturing sector during the nineties was motivated by the need to develop supply chains in order to reduce the costs of intermediate inputs. It is worth mentioning that a large share of the manufacturing exports of Mexico has been produced by the assembly plants (maquiladoras), which import intermediate inputs and, after assembling them and incorporating value-added, they export them back to the usa and the rest of the world (Hanson, 2010). The establishment of the North American Free Trade Agreement encouraged increased Mexican trade with the usa based on the automobile industry, as well as electronics and machinery. Those industries have become major players in the expansion of Mexican exports since the decade of 1990.
As mentioned before, the increase of the manufacturing exports is related to the combination of the preferential reduction of tariffs and the interaction of FDI and outsourcing looking to develop the specialization of the production process (Fukao, Okubo and Stern, 2003). As a result, in the case of the Mexican economy, an initial surge of vertical specialization combined with geographic proximity encouraged maquiladora activities (assembly of temporarily imported inputs from the usa ) and transformed the patterns of Mexican exports (Hummels, Ishii and Yi, 2001). Figure 3 shows that total exports at the state level accumulated during the period 2007-2014, and exhibited a positive correlation with the accumulated FDI investment. This positive correlation suggests that the engine of the Mexican exports dynamic is partly caused by the fdi looking for low wages, economies of scale and lower transportation costs.
Nevertheless, it is important to underline several shortcomings of the model of economic growth based on manufacturing exports adopted in the Mexican economy. In the first place, the rapid growth of manufacturing exports has not been able to change the uninterrupted manufacturing trade deficit experienced by the Mexican economy. A second aspect of the Mexican manufacturing trade has to do with the uneven dynamics of the exports of manufactures. There are only a few manufacturing activities that are predominant in the export manufacturing activity. Those are the machinery and equipment subsector and electric and electronic equipment. Therefore, it can be clearly stated that the dynamics of Mexican manufacturing exports are characterized by a strong concentration of exports in a very few manufactures. If we consider, as mentioned previously, that Mexican exports are mainly sent to the usa , it can be concluded that Mexican manufacturing exports depend on a very limited range of exports concentrated in the us market. Therefore, the possibilities of economic expansion are limited by the particular pattern of export-led economic growth experienced in the Mexican economy.
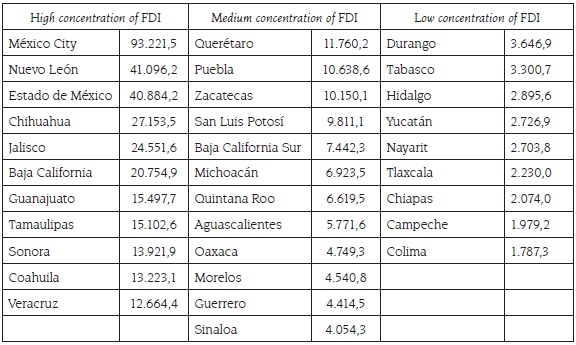
FDI has had an uneven impact both at the sectoral and regional levels in Mexico. The Mexican manufacturing sector has received a larger share of fdi than other sectors. Between 1999 and the first quarter of 2017, the accumulated FDI was 231.684,5 million dollars, representing 48,9% of the total fdi invested in Mexico. In particular, the transportation equipment sector accumulated 11,9% of the fdi. Therefore, there is an evident connection between the dynamic of the exporting sector of the Mexican economy and the multinational firms that allocate production process in the Mexican economy. Geographically, the localization of fdi in Mexico can be divided in three main groups (Table 3). The first group shows that the states with a higher concentration of fdi are precisely the ones characterized by being the main exporter states, such as Nuevo León, State of Mexico, Coahuila, Baja California and Chihuahua. Most of them are located in the central and northern regions of Mexico. Therefore, the impact of fdi on economic growth is concentrated in a few economic sectors and regions.
2. EMPIRICAL LITERATURE REVIEW
Initially, several authors estimated the impact of exports on economic growth by establishing a production function for a group of developing economies (Michalopoulos and Jay, 1973) and for middle-income economies (Tyler, 1981). The econometric estimations suggested that exports encourage economic growth. The results indicated that including exports as a variable in the production function could show the positive effect of exports on the productivity of the economic factors derived from economies of scale, efficient resource allocation and innovation.
Feder (1983) extended the theoretical approach by analyzing export and nonexport sectors productivity differentials due to differences in externalities that are created by export growth for the period 1964-1973. The results suggest that exports increase optimal allocation of resources. Additionally several empirical studies have analyzed the impact of both exports and FDI on economic growth. The economic argument is that, in addition to the positive impact of exports, FDI could contribute to technology transfer and spillovers (Sala-I-Martin, 1996). The export-led economic growth of the Asian countries that experienced rapid industrialization such as Korea, Hong Kong and Singapore, have been considered examples of the impact of the effect of externalities generated by exports and technology transfers generated by fdi. Following the same theoretical framework developed by Feder (1983), Esfahani (1991) studied export-promotion in semi-industrialized countries. He estimated statistically significant positive correlations between export growth expansion and output growth. As a result, he suggested the existence of externalities derived from resource allocation, economies of scale, and demonstration effects.
From this perspective, Sengupta and España (1994) developed an econometric model based on a cointegration methodology to estimate the contribution of export externalities on productivity and their role as a catalyst for the expansion of other economic activities. The results supported the positive impact of exports and fdi in the economic expansion of Korea. Similarly, Yao (2006), using a panel data of 28 Chinese provinces for the period 1978-2000, applied a panel unit root test and an Arellano and Bond dynamic panel regression. He found that both foreign direct investment and exports have a positive impact on economic growth at the regional level, supporting the hypothesis that developing economies can benefit from export and FDI promotion.
Crespo and Wörz (2005), based on the concept of export externality, tested the hypothesis of qualitative differences between high and low exports on its impact on economic growth for 33 industries of 45 economies during the period 1981-1997. Using a random effects panel model with instrumental variables, they found that externalities from high-tech exports is higher than the low-tech industries. In the case of the Latin American economies, estimations of the impact of exports on economic growth for the period 1960-1995 did not present evidence of an influence of exports (Reyes, 2002). The empirical model included factors of production such as labor and capital, and added exports and a set of control variables such as oil, manufacturing and the primary sector. The estimations of a multivariate regression with dummy variables for different regions indicate that both labor and capital are important sources of growth; however, the coefficient of exports was only important during the seventies in oil exporter economies such as Mexico and Venezuela.
For the case of Mexico, Thornton (1996) applied cointegration and Grangercausality tests to real exports and real gdp for the period 1985-1992. The results indicated a significant and positive Granger-causal relationship running from exports to economic growth. Ramos (2000) used the causality test of Granger to determine whether exports growth impacted the rate of growth of economic activity for the period 1983-1997. The author did not find causality between the growth rates of the different export categories and output growth. Nevertheless, there was a negative causality between total exports and manufacturing exports. Therefore, the author considered that the benefits of export-led growth based on manufactures have not been able to encourage economic growth.
Pacheco-López (2005) estimated unit root and cointegration tests for FDI, exports and imports for the Mexican economy during the period 1970-2000. She also founded a bi-directional causality between exports and FDI. The author considered that this result indicates that the export-led economic growth of Mexico is based on multinational enterprises that have their own international strategies that have not upgraded export manufactures and have not sufficiently encouraged sustained growth in the Mexican economy. Also, the promotion of exports has considerably increased imports content, since the demand of inputs for both exports and domestic goods has increased.
Additionally, the effects of fdi on the Mexican economy have added important information on the process of liberalization of that economy. Blomstrom and Persson (1983) studied the spillover efficiency related to fdi. They used labor productivity as measure of technical efficiency. They concluded that there is a positive correlation between the efficiency of the plants and foreign participation in some industries.
Ramírez (2000) estimated a cointegration model to analyze the influence of FDI on the productivity of labor for the period 1960-1995. He found that private capital and exports have a positive effect on the growth rate of Mexican labor productivity. Regarding the impact of FDI on the manufacturing sector, Nunnenkamp, Alatorre and Waldkirch (2007) applied a dynamic panel in order to estimate the effect of FDI on the rate of growth of labor employment for the Mexican manufacturing sector for the period 1994-2006. The results showed a positive but weak impact of FDI on manufacturing for both blue and white collar employment. However, the positive effect on blue collar workers’ employment diminished as the labor skill level of manufacturing industries increased.
By introducing externalities as an explanatory factor for the positive impact of FDI on economic growth, Jordaan (2008) developed a cross section model for data from the Economic Census of 2004. The results showed the existence of negative externalities in industries with backward linkages, that the externalities are affected by technological differences between firms, and that there was an important heterogeneity of the impact of fdi on externalities. Finally, Mendoza (2011) studied the impact of FDI on the growth of the manufacturing sector in the period 1999-2008, using panel data for nine manufacturing sub-sectors of the Mexican economy. Mendoza found a statistically inconclusive effect of FDI. However, the FDI coefficient exhibited positive effects for the skilled personnel in manufacturing industry. Therefore, previous studies about the effect of FDI on the Mexican economy have delivered weak evidence of any positive effects of exports and FDI on economic growth. Therefore further estimations are required to provide further information with respect to the link between exports and growth in Mexico.
3. EXPORTS AND GROWTH: THEORETICAL CONSIDERATIONS
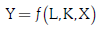
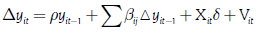
From the standpoint of economic theory, the rapid growth of exports can encourage productivity, resources allocation and economies of scale, making the export-led growth economies more competitive. The theoretical model to estimate the effects of exports on economic growth is based on a general production function which includes exports as an input as follows:
 (1)
(1)
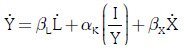
Where Y is the output, L is labor, K is capital and X is exports. Totally differentiating the function and manipulating the expression, the function is presented in terms of growth:
 (2)
(2)
Where  and
and  are the growth rates of the economically active population and
  is the investment output ratio.
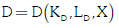
Another theoretical approach to study the effect of exports on economic growth is related to the seminal article of Feder (1983). The author developed a model with an export sector and a non-export sector. As a result, each sector has a different production function and it is assumed that the activity in the export sector generates positive externalities to the non-export sector derived from the reduction of economies of scale, specialization, technology, etc. Formally, the two sectors can be described as follows:
 (3)
(3)
 (4)
(4)
Where
D = non-export sector
E = export sector
K = capital stock
L = labor force
X = exports
The model assumes that productivity in the export sector is higher than the one in the non-export sector. Totally differentiating (1) and (2) yields the following equations:
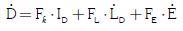 (5)
(5)
 (6)
(6)
Where I is sectorial gross investment, L is labor and F and G are differentials in the capital stock and labor force of each sector. The gross domestic product can Exports and economic growth in Mexico, 2007-2014: a panel cointegration approach be defined as: Y = D + E, and assuming that there is higher factor productivity of the exporting sector (δ>1) -where  and also positive externalities of the exporting sector to the importing sector (FE), substituting (5) and (6) yields the following expression:
 (7)
(7)
Where I is equal to gross investment and L is equal to labor growth. Finally assuming that  and
and  and dividing by Y, it is possible to obtain a function that can be the basis for an empirical estimation of the effect of exports on economic growth:
 (8)
(8)
4. METHODOLOGICAL STRATEGY AND PANEL COINTEGRATION ANALYSIS
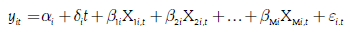
In order to study the effect of export expansion on economic growth in Mexico, a cointegration panel model was applied. This methodology allows the integration of the regional dimension and the temporality in order to have comprehensive information on the impact of exports of the state gdp of the Mexican economy. The econometric analysis relates the Mexican GDP growth to increase in exports, FDI and population progression. The data encompasses all the 32 states that integrate Mexico. Based on equation 8, the regression equation in the model has the following specification:
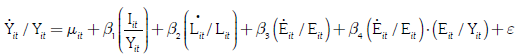 (9)
(9)
Where
 = Annual rate of gdp growth in dollars of state i at time t.
I/Y = Total investment share of gdp
 = Population growth
 = Annual rate of exports growth
E / Y= Share of exports to gdp
The coefficients of the equation represent, in the first place, the marginal productivity of capital at the state level (β1), which should be positive and with a probable low value due to the differences in regional marginal productivity of that factor. It is followed by labor growth, that should also be significant and greater than zero (β2). Finally, the coefficient exhibiting the impact of marginal productivity in the exporting sector on total productivity (β3) is assumed to be positive, since it is supposed that it is creating positive externalities for the economy as a whole.
The database encompasses the 32 states of Mexico over the period 2007 to 2014 with panel annual series by state for Mexican GDP, exports and total investment that were obtained from the Economic Census of 2004, 2009 and 2014. The period of time corresponds to the Mexican government measures towards increasing labor flexibility. Additionally, data for previous years is not available for information on the characteristics of labor. The states GDP data was acquired from National Account data, and the external sector information from the Bank of Economic information (BIE) of the National Institute of Statistics, Geography and Informatics (INEGI). All the variables are denominated in current dollars. Also the population data was obtained from the interactive information of the Population and Housing census from INEGI1.
4.1 Panel cointegration analysis
The estimation methodology requires a test of whether or not the series of the variables used in the model have a panel unit root. It has been demonstrated that pooled time series data can also exhibit a time trend and therefore could be nonstationary. As a result, estimations of ordinary least squares have the possibility of being spurious. In order to avoid misspecification errors, several authors have developed multiple series unit root-tests for panel data structures. The tests are divided into two types. Breitung (2001), Levin, Lin and Chu (2002), and Im, Pesaran and Shin (2003) use Augmented Dickey Fuller tests, while Maddala, and Wu (1999), Choi (2001) and Hadri (2000) use Phillip-Perron tests. The specification of the tests is formally presented in an ar(1) process for panel data as follows:
 (10)
(10)
Where
Yit = pooled variable
Xit = exogenous variables (geographical fixed effects and unit time trends)
Vit = error terms (mutually independent disturbances).
In the model, if  is considered to be weakly (trend) stationary and if
  , it is considered that it has a unit root. The Levin-Lin-Chu test (LLC) and Breitung tests assume that there is a common unit root process for all the cross sections with a null hypothesis similar to the Augmented Dickey Fuller test. Therefore, it is assumed that α=ρ-1 is equal across the three cross-sections. Only the IPS test estimates a separate ADF regression for each of the three cross sections and therefore ρi could be different in each cross-section.
Additionally, in order to determine the existence of a long term equilibrium among the variables included in the model, a panel cointegrated test was estimated according to the methodology developed by Pedroni (1999), that extended the Engle and Granger tests in order to include panel data. The test analyzes whether the residuals of the variables are cointegrated I(0) or not I(1). The difference is that, in the case of panel statistics, the first-order autoregressive term is assumed to be the same for all the cross sections. On the other hand, in the case of group panel statistics, the heterogeneous intercepts and trend coefficients can vary over the cross sections. The model is specified as follows:
 (11)
(11)
Where y and x are assumed to be cointegrated to order one I(1), and the parameters α and δ are individual and trend effects. The null hypothesis assumes no cointegration of the residuals I(1) and is tested by running a regression of the residuals εi,t, and constructing a cointegration statistic that varies depending on the values of N and T.
Most of the economic time series are difference stationary, and therefore a regression based on variables in levels will produce misrepresentative results, and the Wald tests for coefficient significance will exhibit spurious relationships between series. Therefore, to avoid that problem, it is important to determine the existence of a cointegrating vector. For that purpose, a fully modified ordinary least squares model (fmols) was estimated. The method was developed by Phillips and Hansen (1990) with the objective of removing the long-run correlation between the stochastic regressors and the cointegration equation.
This technique generates consistent estimates of the parameters and also limits correlation and the endogeneity of the regressors. As a result, the estimator of this method is considered asymptotically unbiased, and therefore allows for standard Wald tests. Thus, the model is developed to estimate the effect of numerical labor flexibility on the unemployment rate long-run estimates of the coefficients in equation 9, by using the fmols methodology. Finally, a Dynamic Ordinary Least Squares model (DOLS), developed by Saikkonen (1992) and Stock and Watson (1993), which eliminates the asymptotic endogeneity, was also estimated. This technique includes lags in the regressors that are assumed to eliminate the long-run correlation of the estimated errors.
5. ESTIMATION RESULTS
In order to undertake panel unit root testing of the five variables considered in the empirical model, several tests were estimated. The panel unit root testing considers the asymptotic behavior of the time-series T and the cross-sectional dimension N. There are different tests for estimating the asymptotic behavior of the estimators for nonstationary panels. The Levin-Lin-Chu test (LLC) assumes common unit root process and that the lag p varies across individuals. The null hypothesis considers that each time series contains a unit root and the alternative hypothesis is that each time series is stationary. For the LLC test for all series both in levels and in first differences, the null hypothesis of the existence of a unit root at a 5% level of confidence was rejected (Table 4). It is worth mentioning that this test performs well with large samples (T between 5 and 250). However, a disadvantage of the test is that it assumes cross-sectional independence.
Table 4 Panel unit root test
| Variable | Breitung | LLC | Hadri | IPS | ADF | PPF |
| DY | –9,33* | –14,24* | 57,43* | –3,55* | 118,94* | 279,36* |
| IY | 4,89 | –16,97* | 43,79* | –1,95* | 103,09* | 89,59* |
| DL | –1,52 | –4,90* | 40,66* | –0,025 | 69,34 | 37,93 |
| DX | –7,55* | –11,30* | 33,33* | –2,95 | 106,35* | 195,56* |
| DXXY | –5,97* | –16,45* | 42,67* | –3,39 | 110,74 | 173,57* |
| Δ DY | –16,45* | –34,62* | 58,66* | –9,51* | 222,45* | 351,41* |
| Δ IY | –4,93* | –53,71* | 58,41* | –21,67* | 317,43* | 143,9* |
| Δ DL | –0,09 | –32,91* | 58,66* | –12,94* | 258,63* | 325,09* |
| Δ DX | –8,88* | –15,38* | 31,60* | –4,57* | 135,72* | 309,68* |
| Δ DXXY | –8,99* | –18,72* | 54,22* | –4,78* | 136,29* | 287,83* |
Notes: * Indicates rejection of null hypothesis of nonstationarity of Levin, Lin and Chu (LLC), Im, Pesaran and Shin (IPS) and Breitung, and
** indicates rejection of null hypothesis of stationarity of Hadri with a statisticalt significance of 5%.
Total number of observations (NT) is 256. DY: DGP growth, DL: population growth, DX: exports growth, IEDY:
foreign direct investment to GDP and DXXY: exports growth to share of exports of GDP.
Breitung:
Null: Panel data has unit root (assume common unit root process)
Alt: Panel data does not have unit root
LLC (Levin, Lin y Chu):
Null: Panel data has unit root (assume common unit root process)
Alt: Panel data does not have unit root
Hadri:
Null: Panel data does not have unit (stationary)
Alt: Panel data has a unit root
IPS (Im, Pesaran and Shin):
Panel data has unit root (assume individual unit root process
Alt: Panel data does not have unit root (stationary)
ADF (Augmented Dickey-Fuller) and PPF (Phillips, Perron and Fisher):
Null: Panel data has unit root (individual process)
Alt: Panel data does not have unit root (stationary)
Source: Own work.
The Im, Pesaran and Shin (IPS) test allows for heterogeneous coefficients and the null hypothesis considers that all individuals follow a unit root process and the alternative hypothesis allows some individuals to have unit roots. The results of the estimation of the test showed that the variables of FDI share to GDP, population growth, export increase and export growth times the share of exports to GDP, failed to reject the null hypothesis, and only the GDP growth series rejected the null hypothesis of the existence of a unit root at the 5% level of confidence.
In order to corroborate the unit root test estimations, additional tests were undertaken. The ADF-Fisher and PP-Fisher test estimation results indicated that the null hypothesis of individual unit root tests for all cross sections was rejected in levels and first differences for the dependent and independent variables, but failed to reject the null hypothesis for the case of the population growth variable. Finally, the Hadri test was estimated. The null hypothesis of the test assumes no unit root existence in any of the series considered (analogous to the KPSS unit test for time series). The results of the test supported the previous tests estimated and failed to reject the null hypothesis of no unit root for all the variables both in levels and in first differences.
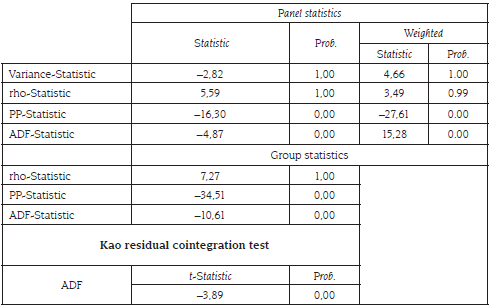
Since the series of the variables used in the model did not exhibit a unit root, a panel cointegration analysis of the series was carried out. In order to determine if there are cointegrating relationships in the variables included in the model, four panel statistics and three group panel statistics tests were estimated. The null hypothesis of the test is no cointegration against the alternative of cointegration. Table 5 presents the tests divided in two sections: the panel statistics and the group statistics. In the first test, it is assumed that a first-order autoregressive term is the same across all the cross sections, while in the case of the group panel statistics, the parameter of the term varies over the cross sections. The estimations of PP and adf panel and group statistics rejected the null hypothesis of no cointegration for the variables of the model. Consequently, the Pedroni test for cointegration rejected that the residuals of the series are integrated in order I (1), suggesting the existence of panel cointegration. In addition, a Kao test, following the basic approach of Pedroni but with homogeneous coefficients, also provided evidence of panel cointegration of the series of the model.
Table 5 Panel cointegration tests estimations
Pedroni and Kao
Null: No cointegration
Alt: cointegration. common AR coefficients (within dimensions)
Source: Own work.
Additionally, a Granger causality test for panel data was estimated for the variables included in the model with a specification of two lags. Table 6 shows the results for the causality test between the GDP growth and the explanatory variables in the model. The test rejected the null hypothesis that DX and DXXY do not cause DY (GDP growth). On the other hand, the results of the test indicate that the other two explanatory variables IEDY and dl fail to reject the null hypothesis and therefore, there is no causality among these variables and the GDP growth.
Table 6 Granger causality test for exports and GDP growth
| Null Hypothesis: | Obs. | F-Statistic | Prob. |
| IEDY does not Granger Cause DY | 192 | 0,59185 | 0,5543 |
| DY does not Granger Cause IEDY | 1,87132 | 0,1568 | |
| DL does not Granger Cause DY | 192 | 0,04645 | 0,9546 |
| DY does not Granger Cause DL | 0,77171 | 0,4637 | |
| DX does not Granger Cause DY | 192 | 2,41293 | 0,0923 |
| DY does not Granger Cause DX | 16,6734 | 2,00E-07 | |
| DXXY does not Granger Cause DY | 192 | 3,93287 | 0,0212 |
| DY does not Granger Cause DXXY | 17,6349 | 1,00E-07 |
Source: Own work.
5.1 fmols, dols and cointegration relationships
In order to determine the long run cointegration relationship of the variables, two regression models were estimated with the variables considered. In order to generate long run estimates for a cointegrated panel, while avoiding endogeneity for the regressors and serial correlation, and generating consistent parameters, a panel modified ordinary least squares regression was estimated (FMOLS). Also, this method is useful because its estimates and the significance of the coefficients are considered sufficient to validate the existence of cointegrating equations (Table 7).
Table 7 Panel fully modified least squares (FMOLS) and panel dynamics least squares (DOLS) estimations
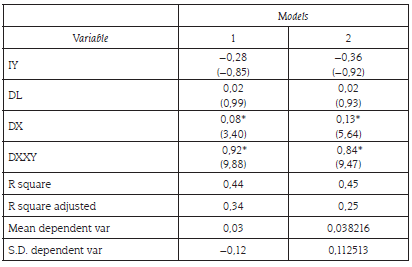
Notes: t-statistics are in parenthesis. Model (1) cointegration equation deterministic is C and (2) cointegration equation deterministic is a linear trend. Unbalanced panel, N=32, T=32, observations = 2974. * Statistically significance at 1% level.
Source: Own work.
The estimations of the model indicate the existence of a cointegration equation, which is deterministic in a linear trend. The first model showed that labor, exports growth (DX) and the effect of exports on export share of growth (DXXY) presented positive and statistically significant coefficients. On the other hand, the coefficients of the total investment share of GDP and labor growth were positive but statistically insignificant. The adjusted R squared of this model was 0.44, signifying an acceptable goodness of fit of the model and a good approximation of the regression to the real data points. Therefore, the results suggest that exports are an important factor in the economic expansion of the Mexican economy for the period analyzed.
In addition, a dynamic ordinary least squares (DOLS) regression was estimated. This regression is considered to generate more consistent weighted estimators based on average covariance for each cross section, and it represents an alternative to FMOLS estimators when dealing with problems of cross section correlation (Kao and Chiang, 2001). The estimations corroborate that the growth of exports seems to have a positive effect on the economic growth of the Mexican economy, measured by its GDP. It is important to underline that FDI and population growth also had positive coefficients, however, they were not statistically significant.
6. CONCLUSIONS
After the rapid growth experienced during the decades of 1990 and 2000, exports have become the most dynamic sector of the Mexican economy. In particular, manufacturing exports have had a positive impact on economic growth. Therefore the importance of exports as a source of growth is a recurrent and important topic of empirical research.
The initial analysis of exports and gdp at the state level during the period 2007- 2014 exhibited a slight positive correlation coefficient, suggesting that exports at the state level have a positive impact on regional economic growth in Mexico. It is important to underline that the export model followed by the Mexican economy is closely related to the FDI flows from the USA , oriented to the manufacturing and maquiladora activities. Therefore, it could be concluded that the economic dynamics in Mexico is related to the exports of multinational corporations that have encouraged
export growth in that economy.
As a consequence, the type of model of economic growth based on exports promotion adopted in the Mexican economy has not been able to reduce the manufacturing trade deficit, the uneven dynamics of the exports of manufactures by sectors and states, and their concentration on the USA market. Hence, the Mexican exports promotion model is constrained and dependent on the USA economic activity. Therefore it is important to evaluate whether or not exports promotion could also positively impact the non-tradable sector of the Mexican economy.
Testing the hypothesis of export-led growth in the case of the Mexican economy at the regional level is important, since it can provide information regarding exports and GDP growth at the state level. In order to estimate the effect of exports on economic growth, a panel cointegration analysis was undertaken. In the first place, a unit root test of the series was applied. For the majority of the tests applied the null hypothesis of the existence of a unit root of the series was rejected and therefore they could be considered stationary. The tests of panel cointegration provided evidence that the series of the panel data base are cointegrated and therefore long run integration regressions were estimated.
The results showed the existence of a cointegration equation and a positive externality of exports on economic growth that was statistically significant. On the other hand, the coefficients of the total investment share of GDP and labor growth were positive but statistically insignificant. The results provided evidence of positive externalities of exports in the dynamics of the economic growth of the Mexican economy at the state level, probably influenced by the exporting expansion of the economy. Additionally, the results indicate that the lack of investment at the regional level is affecting the expansion of the regional GDP of the Mexican economy. Therefore, in order to generate more balanced sectorial and geographical growth, trade policy should encourage FDI in different regions and sectors, oriented not only to exporting industries but also to the industries producing for the domestic market.
Since export dynamics and FDI have been features of the export-led economic growth in Mexico, the potential positive impacts of exports on growth are related, not only to trade policy but to the power of attraction of FDI. However, when comparing the successful economic growth of Korea and the rather limited effects of exports in Mexico, it has been argued that a long term economic growth strategy should include not only liberal trade policies but also tools such as infrastructure and education development in order to achieve technological spillovers, economies of scale and economic development (Berasaluce and Romero, 2017).
Further econometric analysis should be developed to study the effect of imports and the balance of trade on the dynamics of the Mexican economy. However, the results of the econometric model support initiatives to promote strategic trade policies to generate competitive exporting industries, a balanced export expansion and an increase in the externalities of the exporting sector to encourage the economic growth of the Mexican economy.

