Inglés (pdf)
 Articulo en XML
 Referencias del artículo
 Enviar articulo por email
 Citado por SciELO
  Citado por Google
  Similares en
SciELO
Similares en
SciELO  Similares en Google
 Permalink
INTRODUCTION
Inequality, in the widest sense, is a social phenomenon in which part of the population faces restrictions in access to a set of opportunities that enhance their capabilities and determine their participation in different social roles. The study of this phenomenon has always played an important role in the agenda of policymakers, which is why, in 2015, reducing inequality was included as one of the Sustainable Development Goals (SDGs).
Social disruptions generated by inequality such as collective discontent and unrest lay the foundations for revolutions, violence, crises and political instability, which can have negative impacts on economic growth and investment (Alesina & Perotti, 1993; Furman & Stiglitz, 1999). In line with this, Wilkinson &Pickett (2009) highlight correlations between inequality and social problems such as drug abuse, rising mortality rates, homicide, violent crime and racism, which adds to the case for encouraging the continued study of inequality.
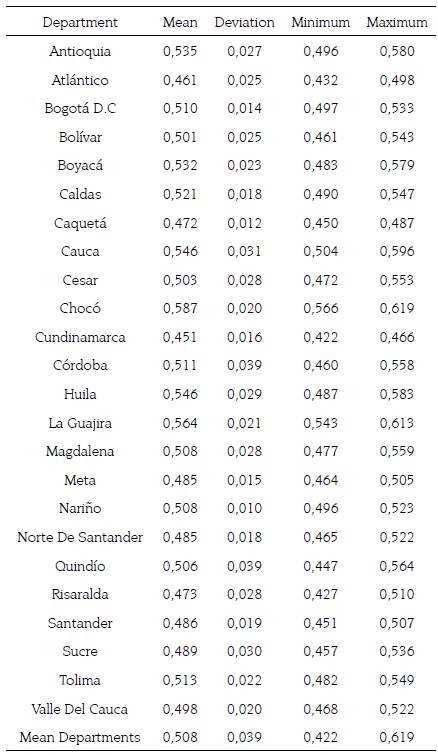
In Colombia, disparities in income distribution are evident. According to data from the National Department for Statistics (DANE) on inequality and poverty, we find that inequality has reduced by 9.26 %. On average, the Gini coefficient in 2008 was 0.54, while for 2018 it was 0.49. However, when examining the figures at a higher level of disaggregation, it is notable that peripheral regions like La Guajira, Cesar and Magdalena have higher levels of inequality compared to central regions such as Boyaca, Cundinamarca and Quindio, which have seen remarkable decreases in inequality.
However, in terms of the relation between inequality and education, data from the Ministry of Education (2011) revealed an alarming situation in terms of access to education, as it showed that low-income families with limited human capital do not have effective access to higher education; only 2 % of the bottom decile of the population with the lowest income have access to higher education, while for the higher income deciles the percentage is 91 %.
Thus, since inequality is a product of the concentration of income in a particular population group (according to the definition in terms of income), we propose not only public spending on education as a mechanism for combatting inequality, but a wider focus on education because of its role in developing transversal skills that enable access to better remuneration. This is in line with the argument that it is necessary to channel the benefits of economic growth in a targeted way. Our hypothesis re-evaluates the role of public spending and overall provision of education in the fight against inequality. We argue that public spending on education is one strategy for reducing inequality but turns out not to be as effective, while increasing provision generates differential effects in terms of inequality depending on the level of education offered.
Access to education translates, in the medium term, into better working conditions for those who successfully enter the labour market, in accordance with the theory of human capital (Becker, 1964). Given that the impacts of efforts to reduce inequality only become evident in the long term, it is not only important for researchers to focus on the contemporary dynamics of inequality in order to understand its various determinants, but also on the econometric problems in the area of Development Economics. In light of this, our research offers an inferential and not a causal analysis.
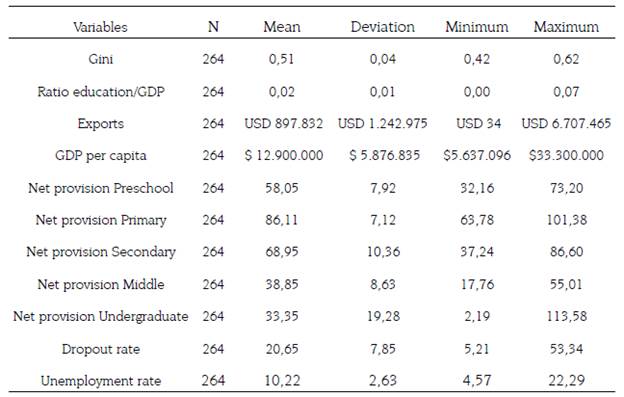
Our empirical strategy used the following variables: inequality measured by the Gini coefficient, inequality lagged one period, the ratio of public spending on education to Gross Domestic Product (GDP), overall access to education for early years, primary, middle, secondary and higher education levels, the intra-year dropout rate, the unemployment rate, GDP per capita, and exports for the 23 main departments of Colombia and for Bogotá D.C. for the period 2008-2018. In particular, in order to study the relation between the variables in question and inequality, this research adopted the econometric correction proposed by Hausman & Taylor (1981) and Amemiya & MaCurdy (1986) to correct for the endogeneity caused by introducing the lagged inequality variable, GDP per capita, and unemployment in a panel data model.
The results suggest that increasing spending on education relative to GDP reduces inequality, although the impact is less if we compare the coefficients obtained for different education levels. A 10 % increase in the education-to-GDP ratio reduces income inequality by 0.5 %, while an increase in provision has differential effects. The result of a 10 % increase in provision of early years education (preschool and primary) increases inequality by 0.8 % and 1.23 %, respectively, while for secondary education the increase has a substantial impact as it generates a reduction of 1.44 %. For higher education the reduction is 0.04 % following a 10 % increase in provision at each level.
Our results are in line with the studies presented in the paper, suggesting the importance of encouraging not only policies that improve public spending on education, but also the targeting of education policies in terms of provision (further expansion of secondary education). On the other hand, unemployment, also considered as a social problem, increases inequality, while GDP per capita, as a proxy for income, reduces it. Dropout turns out to be statistically insignificant and again inequality is explained by the same factors for previous years (0.45 %).
The article is divided into three sections. In the first section we present the literature review; in the second section we discuss our methodology, including our data sources, the specification of the econometric model and the main descriptive statistics; the third section presents and discusses the results of the econometric inferences; the fourth and final section presents our conclusions and discusses limitations of the research and policy recommendations.
1. LITERATURE REVIEW
The discussion on the effect of public spending and provision of education on inequality is not convergent, in the sense that some authors claim that it reduces inequality while others point out that the effect is negative or ambiguous. Hence, we report on both approaches, which are largely determined by the levels of development of the economies analysed and the deciles of the population that benefit from public spending.
Jimenez (1986), Medina & Moreno (1995), and Nielsen & Alderson (1997) emphasize the role of education in combating inequality. The skills gained through education are associated with better future wage returns compared to the population that does not have access to it. Mostajo (2000) analysed the distributive effect of social spending in nine Latin-American countries, including Colombia in the 1990s, finding that improving human capital, especially through primary education, is more effective in reducing inequality. Another finding was that spending on university education is strongly regressive in these countries, while secondary education is progressive, although to a lesser extent. This is consistent with the work of Beyer (2000) on Chile, where spending on primary and secondary education had progressive effects, while spending on higher education had the opposite effect.
On the other hand, in his study on the department of Chocó in Colombia, Benavides (2013) found that the effect of public spending was positive in terms of income distribution, which was associated with a reduction of the Gini Coefficient by 8.2 percentage points between 2005 and 2010 due to progress in the distribution and allocation of subsidies, improvements in provision of healthcare and primary and secondary education. In a study on Bangladesh, Karim (2015) argues that education spending reduced the level of inequality between 2001 and 2012, with poorer families benefiting more from primary and secondary education than from higher education because they have not been able to complete secondary education and therefore cannot access higher education.
Other authors argue that spending on education is not the best way to combat inequality because of its ambiguous or negative effect on inequality. Checchi's (2001) research in South Asian countries points out that income distribution and educational performance are inversely proportional because income inequality limits access to education when it is costly for families. The more skewed the income distribution, the higher will be the proportion of the population excluded from the opportunity to obtain better education and human capital, leaving families at risk of getting trapped in poverty. However, Sylwester (2002) observes that countries that allocate fewer resources to education as a percentage of their GDP have greater inequality in income distribution in the long run, which is consistent with the findings of Chaudhuri, Ghosh, & Banerjee (2018) specific factor general equilibrium framework for analyzing endogenous skill formation in a dynamic set-up and examining the consequence of a public subsidy policy on education on the skilled-unskilled wage inequality in a small open economy. It shows that given the technologies of production the policy produces a favorable impact on the wage inequality only in one of the two periods while producing an adverse consequence in the other. If the wage income inequality improves (deteriorates that there is a negative relationship between equality in access to education and income inequality.
The inverse relationship between education spending and inequality is determined by the fact that the benefit accrues to the population in the highest income brackets, which increases inequality. This is corroborated by Fang, Zhang & Fan, (2009) on China in the 1990s, who found that education spending had increased inequality, as those in the highest income brackets saw their income increase by more than 50 %, while for the lowest income percentiles it had increased by only 14 %.
A similar study was carried out by Ospina (2014) on Latin American economies between 1980 and 2000, finding that spending on education and health reduced inequality, although spending on primary and secondary education is progressive, while spending on higher education is regressive. The author's explanation is that developing countries have a large proportion of students from the lowest income quintile who do not access or complete primary and secondary education. Thus, public spending on higher education ends up benefiting students from the highest income quintiles.
In his study of the inefficiency of public spending on education in Uganda, Datzberger (2018) reinforces the assessment made in the previous paragraph, suggesting that in many cases the subsidies in education provided by the state generate benefits for wealthier families instead of benefiting the families that need it most. This is due to the indirect costs of education, such as transport, food, materials such as books and notebooks, and the opportunity cost of young people's time, since in many cases these young people contribute financially to their homes or carry out domestic work, making it difficult for them to attend school.
Indeed, Trucco (2010) reflects on the disparity in access to educational opportunities provided by the State. Given that higher education is accessed mainly by the high-income population, for lower income sectors the insufficient acquisition of the skills required to cope with the difficulties of advanced studies, the uneven quality of education received in the course of primary and secondary education, and other factors such as having to work from a very early age in order to earn an income and thus access minimum levels of well-being, makes it difficult not only to enter but also to complete vocational technical education or university education.
Seefeldt (2018) analysed the relationship between public spending on education at the state level and inequality in the United States from 1987 to 2015, finding that there is an inverse relationship between public spending on education at all levels (primary, secondary and university) and inequality. This suggests that spending on education is crucial for reducing inequality. Therefore, the author proposes that a more educated population leads to a more equal distribution of income in a more equitable way, since, in line with human capital theory, an increase in inequality in education affects income inequality.
More recent studies show interesting results. Arshed, Anwar, Hassan & Bukhari (2019) establish a quadratic relationship between education and income inequality among Asian economies between 1960 and 2015. This relationship shows that initially the increase inprovision of primary, secondary and higher education brings about greater income inequality, but after reaching a certain threshold inequality started to decrease. This is evidence that as a larger proportion of the population gains access to all levels of education, income inequality begins to decline over time.
Lastly, Dobre, Jianu, Bodislav, Radulescu & Burlacu (2020) discovered differential effects of spending on education and health on inequality in Europe in the periods 2002-2008 and 2009-2015. Their results suggest that, although the impact of public spending on education is greater than public spending on health, the magnitude of the coefficients is small. In the case of a one percentage unit increase in health spending, the reduction in inequality is in the order of 0.019 %, while a one percentage unit increase in education spending reduces inequality by 0.024 %.
In line with these studies, this research focuses on the effect of public spending on education on inequality, recognising that there is not a consensus in the literature on the effects generated by education (both in terms of spending and provision) on inequality. What is common across the studies is a focus on measuring and analysing inequality that takes into account, for example, the way in which income is distributed and its relationship with fundamental factors such as education, employment, security, economic growth, among others, which are usually present in the agenda of public policymakers. This leads us to a reflection on the inheritance of characteristics that determine inequality as Núñez, Ramírez & Taborda (2006) suggested. In the literature on poverty and inequality traps, for example, educational level of the parents is associated with the future income of their children.
It is important that more research be done on the relationship between education spending and the set of educational variables on inequality. Although there is no prevailing view as to the impact of public spending on education on inequality, the assumption and hypothesis of this research is that there is an indirect relation between them, in line with the theory of human capital.
The above exemplifies the wide debate on whether government investment in education has a negative, positive or null impact on inequality, and which type of education (primary, secondary or higher education) has a greater effect on the income distribution of a population or region. Authors such as Sylwester (2002) and Seefeldt (2018) have discovered a positive correlation between these two variables, while Datzberger (2018) suggests that the education variable is not as relevant for reducing inequality. Thus, contributions in this field are still open.
2. METHODOLOGY
2.1 Data sources
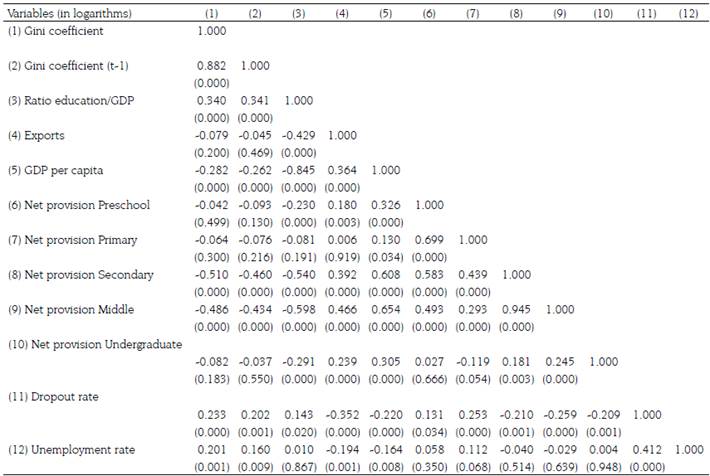
Data at the departmental level corresponding to the period 2008-2018 are taken from the National Department for Statistics (DANE in Spanish), the National Planning Department (DNP in Spanish) and the Ministry of Education (MEN in Spanish). We use the Gini coefficient as a measure of inequality, while explanatory variables are the ratio of education expenditure to GDP, net levels of provision of education across all levels of education (preschool, primary, secondary, and higher), the intra-annual dropout rate, the unemployment rate, exports and GDP per capita. For the construction of the variables education expenditure, GDP per capita and departmental GDP, 2015 was considered as the base year and exports are measured in dollars. Subsequently, all variables were log-transformed in order to capture elasticity.
2.2 Econometric specification
At the outset we assume an endogeneity problem in the sense that inequality is bidirectionally related to lagged inequality, GDP per capita and unemployment. This relationship is because working implies the generation of income that determines the location itself in a situation of income inequality, for example. In the same way, it is probable that the environments where inequality predominates, unemployment is higher, which is why correcting this apparent double causality is important. Thus, we adopt the econometric correction proposed by Hausman & Taylor (1981) and Amemiya & MaCurdy (1986) in order to solve the problem and obtain the most efficient estimators. The model follows a panel data structure with random effects estimated as follows:
Here i = 1,..., n represents the units of analysis, t = 1, n corresponds to the period under study, y it is the Gini coefficient as a measure of income inequality, yit-1, X1it, X2it correspond to vectors of observations of the endogenous variables mentioned, which are time variant, while Z jit corresponds to the set of explanatory variables. The random effect μi is unobservable, while e it is the idiosyncratic error where both assume zero mean, finite variance and independent and identical distribution.
2.3 Descriptive analysis
The main statistics and graphs are presented in annex 1. figure 1 below shows the average tendency for inequality, which is decreasing according to the Gini coefficient for the years after 2008, despite the fact that there was a brief increase in 2018. The above leads us to reflect that in general terms, although inequality appears to be reducing, a greater level of disaggregation would generate a better understanding of inequality in the sense that the redistribution of the gains of economic growth does not reach all actors in society to the same extent. We also found that the average reduction in inequality was 9.3 %.
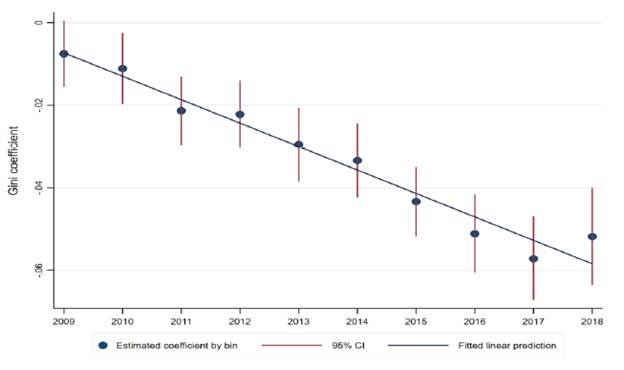
Note: The values correspond to the estimation of a simple regression model where the explanatory variable is years, with 2008 as the reference year. The dependent variable is the average Gini coefficient for the 23 main departments of Colombia and Bogotá D.C. The errors are clustered by each department and Bogotá D.C. Source: Gini Index figures by DANE.
Figure 1 Average Gini coefficient variation by year
The divergence between departments both in terms of levels of inequality and its reduction is latent. According to the tendency in income inequality between 2008 and 2018 (see annex 2), Chocó (0.59), La Guajira (0.56), Cauca (0.55), Huila (0.55) and Antioquia (0.53) are the five most unequal departments in Colombia, while Cundinamarca (0.45), Atlântico (0.46), Caquetá (0.47), Risaralda (0.47) and Meta (0.48) are the least unequal. However, the variation of inequality within departments is consistent with the overall reduction of inequality in the country. However, there are some departments that have not performed well in this regard, as is the case of Santander compared to Quindío (see figure 2).
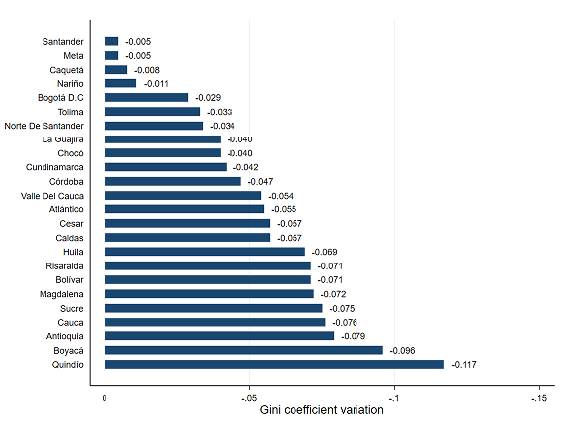
Note: The variation of the Gini coefficient between 2008 and 2018 was calculated at the departmental level. The x-axis shows a division of the variation of the coefficient, which in all cases is negative, representing a reduction in the indicator. Source: Gini Index figures by DANE.
Figure 2 Variation in Gini coefficient
There are also interesting findings in relation to public spending on education as a percentage of GDP (see figure 3). For example, the department with the highest expenditure on education as a percentage of GDP is Chocó, which turns out to be the most unequal and with the lowest GDP of all the departments. This may be explained by corruption, as suggested by Hernández (2017).
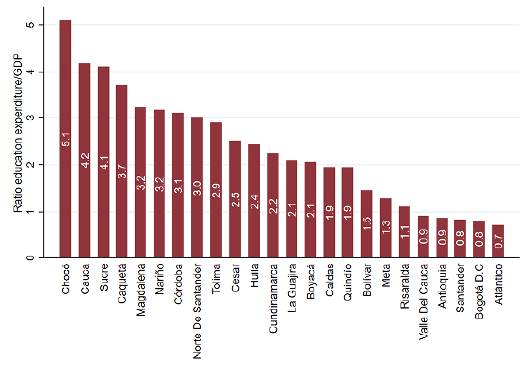
Note: The construction of the education/GDP ratio took 2015 as the base year from which the average of the indicator was calculated for each department. Source: public spending by DNP and department GDP figures by DANE.
Figure 3 Public expenditure on education as a percentage of GDP
Also, we observe that Antioquia, Bogotá D.C., Santander, Atlântico and Valle del Cauca spend less than 1 % of their GDP on education. If we exclude the first two, we can see that these departments have below average levels of inequality. This suggests that when inequality is examined in detail, a correspondence between spending and reduction is not evident.
However, in relation to net provision of education, we observe that for all departments and Bogotá D.C. provision for secondary education is above 70 %, while provision for preschool level remains low (see figure 4, panel A). This again shows the disparities in the provision of education, since when examining departments such as Guajira, Nariño and Chocó, the percentages are the lowest, whilst the high percentage of provision of primary education stands out in most of the departments.
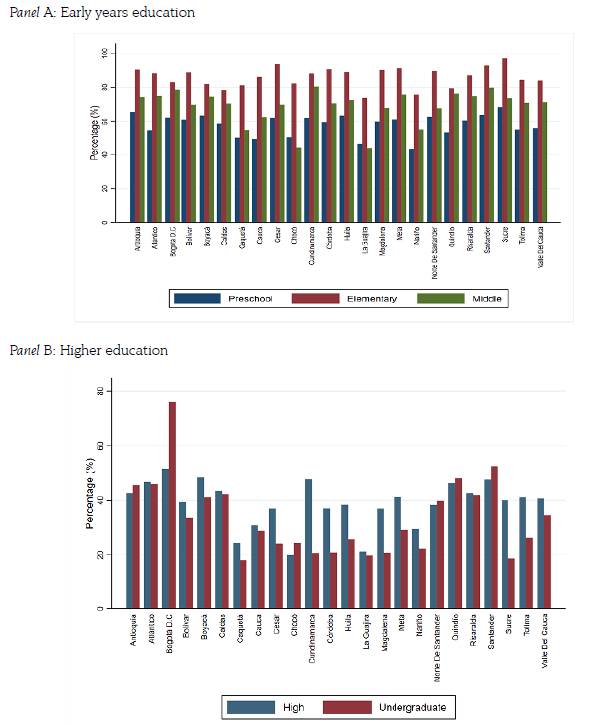
Note: The graphs present the average net provision for five educational levels in two panels. Panel A is titled early years education because it covers pre-school and primary education, while panel B presents advanced education and includes not only tenth and eleventh grades (middle school) but also higher education. The average provision percentages between 2008 and 2018 were used for the calculation. Source: net levels of provision of education across all levels of education by MEN.
Figure 4 Average tendencies in net provision
Unfortunately, the situation is alarming in respect of provision of secondary and university education. On the assumption that these levels of education hone important cognitive competences and develop skills for effective insertion in the labour market, the divergence is latent (see Figure 4, panel B). Bogotá D.C. has the highest levels of provision for secondary and higher education, while other departments have percentages below 40 % for secondary education and 50 % for higher education (on average), with Caquetá, Chocó, La Guajira and Nariño having the lowest levels of provision. These results so far present a clear relationship between departments with high inequalities and poor educational provision even at early levels, which would explain why inequality is entrenched in these regions.
In recent years school dropout has become a major problem that increases inequality. The social and economic responsibilities of much of the population, as well as limited household income, lack of food and resources to travel to school, lead to young people having to enter the labor market at an early age in occupations that require low levels of education, which translates into low wages (see figure 5). This problem is found in most departments. Excluding Antioquia, Atlántico, Bogotá D.C., Boyacá and Bolívar, which have the lowest rates, and Caquetá with the highest percentage, the rest range between 16 % and 26 %, which means there is not a clear correlation and suggests there is an effort on the part of departmental leaders to reduce inequality.
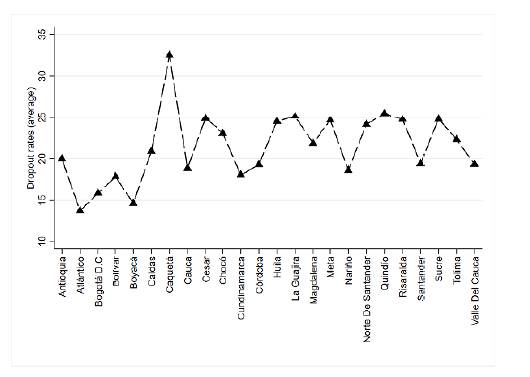
Note: The Intra-annual Dropout Rate is a percentage measure of student dropout during the school year. It displays students who abandon their studies without having completed the level for which they enrolled. The calculation was based on the average of the percentages for the period 2008-2018. Source: MEN.
Figure 5 Intra-annual school dropout rates
3. RESULTS OF ECONOMETRIC INFERENCES
The consolidated results in table 1 allowed us to explore different estimation methods and to analyze the behavior of the variables in five models. However, given the importance of a panel data structure with random effects for capturing the intercept difference between departments, the results of the most efficient model are reported in column 5.
Table 1 Econometric models estimation
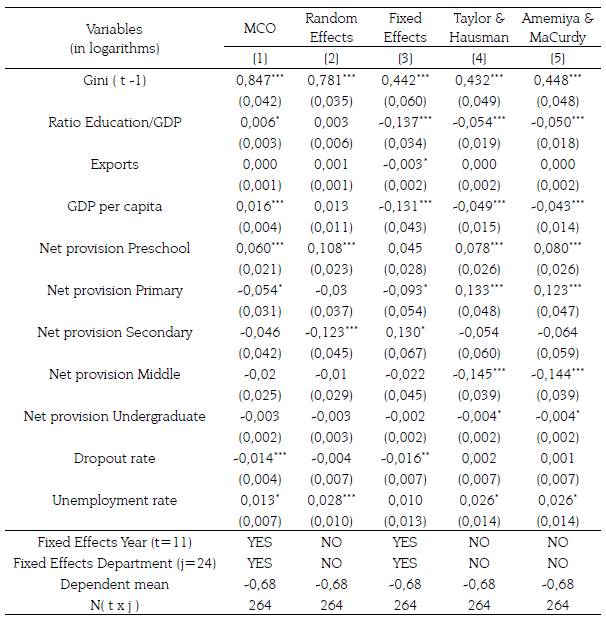
Note: Five econometric models were estimated with a functional form for the double log variables (dependent and independent). The coefficients represent elasticities. The interpreted results correspond to model 5 as it allows controlling endogeneity, the random character of the data panel and leads to more efficient estimators compared to model 4. When calculating the antilogarithm of the mean of the Gini coefficient we find that it is equal to 0.508, facilitating their interpretation. The asterisks indicate that the variables are significant at 10 % (*), 5 % (**) and 1 % (***) level.
Source: own elaboration.
Spending on education has a positive impact on the reduction of inequality, although its effect is not entirely convincing because the coefficient reported is inelastic (β= -0.050), meaning that the efforts made to increase public spending on education will result in a smaller reduction of inequality (in proportional terms). However, in terms of social welfare, any effort to mitigate this problem is justified to the extent that inequality has a direct impact on the quality of life.
This finding points to the importance of identifying where educational resources are best allocated, since establishing mechanisms that lead to a prioritization of spending would generate a greater impact. For example, according to the Public Spending Plan of the Ministry of Education (2018), it was found that the largest amounts were allocated to: i) the implementation of the school meals program (22.16 %); ii) promoting access to higher education by incentivizing demand in Colombia through "Ser PiloPaga" ("Being Smart Pays") grants awarded for undergraduate studies (13.92 %), and iii) construction, expansion, improvement and provision of educational infrastructure at preschool, primary and secondary levels nationwide (9.35 %). However, it is evident that resources have mainly been allocated to programs aimed at increasing access to higher education rather than to improving the quality of education provided at other education levels.
In fact, in examining the provenance of financial resources for education, it is clear that 80 % comes from the General System of Participations and, according to the five criteria of prioritization of the use of these resources documented in Forero & Saavedra (2019), which is also in accordance with Law 715 of 2001, this is an unproductive expense in the sense that these resources are used for paying the salaries of teaching and administrative staff, which supports the idea that the targeting should be reconsidered.
Provision of education has a differential impact on inequality. Early years education such as preschool and primary are directly related to inequality, while secondary education is not statistically significant. This suggests that a 10 % increase in preschool and primary provision translates into an increase in inequality of 0.80 % and 1.23 % respectively. Although it seems counterintuitive, this result is explained by the work of Arshed, Anwar, Hassan & Bukhari (2019) in that as economies enter a development path, early years education increases inequality until countries reach the threshold at which the effect would be expected. This shows that the country has not yet seen the benefits of this educational strategy.
The results forsecondary and higher education provision are quite interesting in that they suggest useful areas for future research. Both are associated with a reduction in inequality, but higher education provision tends to be almost perfectly inelastic in that the coefficient is close to zero (β= -0.004). Increasing access to higher education is justified to the extent that the skills provided at this level would enable workers to compete more effectively in the labor market and give them a better chance of earning more income, which in turn would reduce the inequality gap between different sectors of the population. However, the country has long experienced high unemployment rates for young people, which along with high levels of informality in the labor market suggest that the solution lies not only in improving access to and the quality of education (through provision of skills) but also in developing synergies with employers.
The above assumption is in line with the result for the unemployment variable. It is statistically significant and shows that the higher the unemployment rate, the greater the inequality, since a 5 % increase in the unemployment rate would translate into a 0.13 % increase in inequality. Unemployment in the country turns out to be structural, and when combined with the high rate of informality (60 %) suggests that the trend in recent years is unlikely to improve soon. Additionally, in terms of differential impacts across the population, we find that young people and women have difficulty finding employment, which means they face challenges in terms of getting an income. Unemployment is associated with the economic slowdown, so reviewing strategies for generating stable jobs would contribute to reducing inequality.
For the variables intra-annual dropout and exports, the coefficients were not statistically significant. However, in relation to the former it is clear that the higher the dropout rate, the lower the likelihood of attaining the skills necessary for the workplace, leading to an increase in income inequality.
School dropout affects the qualification of the future labor force and means that many young people cannot gain access to the different support schemes offered by the government or by companies. This can also impact negatively on labor productivity, which in turn leads to slower economic growth. In social terms, dropout stimulates public spending by governments in an attempt to prevent it, since failure to do so generates more social inequalities and poverty. Furthermore, it is possible to identify two situations that lead to school dropout: the first is the socioeconomic conditions of the student, whereby economic difficulties force young people into prematurely seeking employment, and the second one is related to the educational context itself in terms of poor academic standards and performance, problems with the teacher-student relationship, and dilapidated school infrastructure, which all combine to produce high dropout rates.
Finally, current levels of inequality are the result of the same persistent forces and dynamics over the years, which highlights the importance of designing effective strategies for reducing inequality, especially considering that departments with high levels of inequality will take longer to reduce it given the inelastic nature of the coefficient. GDP per capita turns out to be statistically significant and positive in terms of reducing inequality, which suggests the need to rethink economic growth as a means for combatting social problems, given that authors such as Deininger & Squire (1996), Ravallion & Chen (1997) and Dollar & Kraay (2002) argue that the income of the poor increases in a greater proportion than the income of the rest of the population once economic growth is generated.
CONCLUSIONS, LIMITATIONS AND POLICY RECOMMENDATIONS
Inequality has shown a reduction in the period under study, but when examining the figures across departments in Colombia, large divergences are observed, which support the importance of targeting social policies. It has been found that departments with high levels of inequality have high spending on education yet low provision for secondary education. This is illustrated by the situation of Chocó and Cundinamarca, in which the latter department has less than twice the expenditure in education but has more than 2.5 times the provision of secondary education than Chocó, making it the department with the lowest inequality in the country.
In summary, the reduction of inequality is related to public spending, provision of secondary and higher education, the unemployment rate, GDP per capita, and the dependent variable lagged one period. However, public spending on education in Colombia turns out to be unproductive in that large amounts are allocated to administrative and payroll expenses that do not improve quality or infrastructure; this would explain why the coefficient turned out to be inelastic.
The results suggest that education provision does indeed reduce inequality, which leads to two points. Firstly, education makes it possible to gain the necessary skills to enter a labor market in which the workforce is not highly qualified. Secondly, which is in line with the result obtained for unemployment, jobs must be generated for the most vulnerable sectors of the population, given that the low-income population is unable to accumulate sufficient human capital to access better-paid jobs.
Provision of education undoubtedly generates differential impacts, which are corroborated by the findings of other authors. However, the recommendation is not to target investment at specific education levels, but rather to continue increasing resources until reaching the threshold at which early years education also becomes a mechanism for reducing inequality. Thus, promoting policies that benefit the departments with the highest levels of inequality would surely lead to improved levels of equality in Colombia. Educational subsidies aimed at increasing access are mainly available in the major cities, which increases inequality insofar as people with lower incomes in areas with less provision cannot afford to travel to the cities.
Lastly, we must point out two major limitations of our research. The first is that, due to methodological changes in the Integrated Household Surveys there is unfortunately a discontinuity in the figures, which meant we had to undertake the study using 2008 as the base year and therefore could not construct a data panel with a longer time frame in order to examine inequality in the long term. The second limitation is that we could not access information to analyze the effects of educational performance on inequality. It would be expected that in areas where the population reaches higher levels of education, inequality would be lower and, therefore, improving educational quality would be the best public policy in terms of the prioritization and allocation of public resources. This should be addressed in future research.