SciELO - Scientific Electronic Library Online

 
vol.37 issue1Severity Markers of Acute Appendicitis: Diagnostic Test StudySurvival in Patients with Cirrhosis According to Etiology. Retrospective Cohort author indexsubject indexarticles search
Home Pagealphabetic serial listing  

Services on Demand

Journal

Article

Indicators

Related links

  • On index processCited by Google
  • Have no similar articlesSimilars in SciELO
  • On index processSimilars in Google

Share


Revista colombiana de Gastroenterología

Print version ISSN 0120-9957On-line version ISSN 2500-7440

Rev. colomb. Gastroenterol. vol.37 no.1 Bogotá Jan./Mar. 2022  Epub June 02, 2022

https://doi.org/10.22516/25007440.644 

Original article

Usefulness of the Liver Fibrosis Index (LFI) Measured during Endoscopic Ultrasonography in Evaluating the Pancreatic Parenchyma

Martín Alonso Gómez-Zuleta1  * 
http://orcid.org/0000-0002-2377-6544

Oscar Fernando Ruiz-Morales2 
http://orcid.org/0000-0001-6555-1573

Eddy Johanna Buitrago-Laguado3 
http://orcid.org/0000-0003-0655-9780

1MD, Internist, Gastroenterologist, Lecturer of Gastroenterology, Universidad Nacional de Colombia. Gastroenterology Service. Hospital Universitario Nacional de Colombia. Bogotá, Colombia.

2MD, Internist, Gastroenterologist. Gastroenterology Service, Hospital Universitario Nacional de Colombia, Colombia.

3Internist, Gastroenterology fellow, Universidad Nacional de Colombia, Hospital Universitario Nacional de Colombia. Bogotá, Colombia.


Abstract

Endoscopic ultrasound has changed the evaluation of pancreatic diseases and has achieved a histopathological diagnosis (when associated with a puncture); however, this procedure requires training, is not free of complications, and around 25 % of patients may have false negatives. Therefore, quantitative elastography with the strain ratio has been implemented to differentiate benign masses from malignant ones. There is growing but not yet conclusive evidence, given the heterogeneity of the results (without consensus on its performance). It is necessary to develop other methods that allow for greater diagnostic certainty, such as the liver fibrosis index (LFI) measured by endoscopic ultrasonography. This method is based on artificial intelligence and validated for diagnosing and monitoring liver fibrosis. Our group considers that it could also be used to assess the pancreatic parenchyma.

Aim:

To evaluate whether the LFI can differentiate three types of pancreatic tissues: normal pancreas, fatty pancreas, and pancreatic cancer.

Materials and methods:

Prospective cross-sectional single-center study. We included sixty-six patients over 18 years of age with an indication for endoscopic ultrasonography. Group 1 consisted of patients with an indication other than the biliopancreatic disease (55 patients). The endoscopic ultrasonography (EUS) fatty pancreas classification scale was applied to this group, taking the echogenicity of the spleen (previously validated) as a reference; this group was subdivided into normal pancreatic parenchyma and fatty pancreas. Group 2 (11 patients) included those examined for solid pancreatic lesions with a positive cytological diagnosis of pancreatic carcinoma. We used a Google Form as a data collection tool, available with a shortened address (shorturl.at/pIMWX). It was filled out before and after the procedure by Gastroenterology fellows, previously trained for this purpose. The LFI was measured in the pancreas in real-time using software supplied by the manufacturer (Hitachi Noblus) between January 2019 and January 2020. All patients underwent a complete biliopancreatic echoendoscopy, with a linear Pentax echoendoscope and Hitachi Noblus processor. Then, qualitative and quantitative elastography was performed, including LFI measurement.

Results:

We included a total of 66 patients: 11 with a diagnosis of pancreatic cancer confirmed by cytology and 55 sent for ultrasound endoscopy due to pathologies other than the biliopancreatic disease. The age range was 23-89, with a mean of 56.75 years. The most frequent history was steatosis or steatohepatitis (n = 14) (25.45 %). The most frequent indication for performing the procedure was subepithelial lesion (n = 29) (52.73 %). The percentages of patients according to pancreatic echogenicity were Grade I (n = 29) (52.73 %); Grade II (n = 5) (9.09 %); Grade III (n = 18) (32.73 %); Grade IV (n = 3) (5.45 %). Grades I and II were taken as a normal pancreas and Grades III and IV as a fatty pancreas, divided into n = 34 patients (61.82 %) for a normal pancreas and n = 21 (38 %) for a fatty pancreas. According to the scale used, there is a fatty pancreas prevalence of 38.18 %. The LFI was measured in three subgroups: those considered endoscopically normal, those classified as fatty pancreas, and patients diagnosed with pancreatic cancer confirmed by cytology taken from the pancreas. The LFI for these groups were, respectively, normal pancreas: LFI 2.60, range 0.97-3.47 (95 % CI 2.17-3.02); fatty pancreas: LFI 3.87, range 2-5.5 (95 % CI 3.44-4.29); pancreatic cancer: LFI 6.35, range 5.8-7.8 (95 % CI 5.92-6.77).

Conclusions:

This is the first pilot study that applies the LFI to the pancreatic parenchyma. It is useful in differentiating a normal pancreas, a fatty pancreas, and pancreatic carcinoma non-invasively. This finding must be validated in larger and more heterogeneous populations.

Keywords: Endoscopic ultrasonography; elastography; liver fibrosis index; fatty pancreas; pancreatic steatosis; pancreatic cancer

Resumen

El ultrasonido endoscópico ha cambiado la evaluación de las enfermedades pancreáticas y ha logrado un diagnóstico histopatológico (cuando se asocia con la punción); sin embargo, este procedimiento requiere de entrenamiento, no está libre de complicaciones y alrededor de 25% de los pacientes puede tener falsos negativos. Por esto se ha implementado el uso de la elastografía cuantitativa con el strain ratio, el cual permite diferenciar las masas benignas de las malignas. Existe evidencia creciente, pero aún no conclusiva, dada la heterogeneidad de los resultados (sin consenso para su realización), por lo que es necesario desarrollar otros métodos, que permitan una mayor certeza diagnóstica, como el índice de fibrosis hepática (IFH) medido por ultrasonografía endoscópica, el cual tienen como base la inteligencia artificial, validado para el diagnóstico y el seguimiento de la fibrosis hepática. Nuestro grupo considera que se podría usar de la misma forma para valorar el parénquima pancreático.

Objetivo:

evaluar si el IFH puede diferenciar tres tipos diferentes de tejidos pancreáticos: páncreas normal, páncreas graso y cáncer de páncreas.

Metodología:

estudio prospectivo de corte transversal en un solo centro. Se incluyeron 66 pacientes mayores de 18 años, con indicación de ultrasonografía endoscópica. El grupo 1 fue de pacientes con indicación diferente a la enfermedad biliopancreática (55 pacientes). En este grupo se aplicó la escala de clasificación de páncreas graso por ultrasonografía endoscópica (USE), utilizando como referencia la ecogenicidad del bazo (previamente validada); este grupo se subdividió en uno con parénquima pancreático normal y en otro con páncreas graso. En el grupo 2 (11 pacientes) se incluyeron los pacientes llevados para el estudio de lesión sólida pancreática, con diagnóstico citológico positivo para carcinoma de páncreas. Como herramienta de recolección de datos se utilizó un formulario virtual de Google Drive, disponible con dirección acortada: shorturl.at/pIMWX, diligenciado antes y después del procedimiento por fellows de Gastroenterología, previamente entrenados para este fin. El IFH se tomó en el páncreas en tiempo real mediante un software suministrado por el fabricante (Hitachi-Noblus), en un período comprendido entre enero de 2019 y enero 2020. A todos los pacientes se les realizó una ecoendoscopia biliopancreática completa, con un ecoendoscopio Pentax lineal y procesador Hitachi-Noblus; luego se efectuó una elastografía cualitativa y una cuantitativa, la cual incluyó la medición del IFH.

Resultados:

en total se incluyeron 66 pacientes: 11 pacientes con diagnóstico confirmado por citología de cáncer de páncreas y 55 pacientes que se enviaron para ecoendoscopia por evaluación de otras patologías diferentes a la biliopancreática. El rango de edad fue de 23-89, media de 56,75 años. El antecedente más frecuente fue la esteatosis o esteatohepatitis (n = 14) (25,45 %). La indicación para la realización del procedimiento más frecuente fue la lesión subepitelial (n = 29) (52,73 %). Los porcentajes de pacientes según los grados de ecogenicidad del páncreas fueron de grado I (n = 29) (52,73 %); grado II (n = 5) (9,09 %); grado III (n = 18) (32,73 %); grado IV (n = 3) (5,45 %). Se tomaron los grados I y II como páncreas normal, y los grado III y IV como páncreas graso. Estos se dividieron en n = 34 pacientes (61,82 %) para páncreas normal y n = 21 (38 %) para páncreas graso; es decir, que de acuerdo con la escala utilizada hay una prevalencia para páncreas graso de 38,18 %. Se realizó el IFH en los tres subgrupos diferentes: los considerados como ecoendoscópicamente normales, los clasificados como páncreas graso y los pacientes con diagnóstico de cáncer de páncreas confirmado por citología, tomado en el páncreas. El IFH para los tres diferentes grupos fueron, respectivamente, normal: IFH 2,60, rango 0,97-3,47 (IC 95 % 2,17-3,02); páncreas graso: IFH 3,87, rango 2-5,5 (IC 95 % 3,44-4,29); cáncer de páncreas: IFH 6,35, rango 5,8-7,8 (IC 95 % 5,92-6,77).

Conclusiones:

este es el primer estudio piloto que usa el IFH aplicado al parénquima pancreático, y se sugiere su utilidad para diferenciar, de manera no invasiva, el páncreas normal, el graso y el carcinoma de páncreas. Este hallazgo se debe confirmar en poblaciones más amplias y heterogéneas, con el fin de ser validado.

Palabras clave: Ultrasonografía endoscópica; elastografía; índice de fibrosis hepática; páncreas graso; esteatosis pancreática; cáncer de páncreas

Introduction

Despite the exponential growth of medical knowledge and technological and scientific progress in diagnostic methods and treatments, pancreatic diseases remain poorly understood, posing a diagnostic challenge. Symptoms are usually nonspecific or nonexistent (until advanced stages) because the retroperitoneal location of the pancreas makes its exploration difficult using traditional diagnostic imaging techniques. Considering that pathologies such as chronic pancreatitis, pancreatic cancer, and, more recently, fatty pancreas have been increasing in incidence and morbidity and mortality1,2, new diagnostic methods are required to diagnose them earlier and more accurately and provide timely treatment.

In 1980, DiMagno et al and Hisanaga et al developed endoscopic ultrasonography (EUS)3,4. Since then, it has become a diagnostic and therapeutic tool in pancreatic diseases, which better assesses the entire parenchyma, with reported sensitivities of 87-100%5,6. It has achieved better performance when compared to computerized axial tomography and magnetic resonance imaging6-8. Moreover, EUS plus fine-needle aspiration (EUS-FNA) has become the method to diagnose solid lesions in the pancreas, including pancreatic cancer, especially in lesions smaller than 30 mm, reaching a sensitivity of 93%6,9,10. However, up to 25% of patients may have false negatives, depending on various factors (type of needle, technique, experience, availability of a pathologist in the room, among others), added to its complications (such as pancreatitis and bleeding) and high cost (needles between USD 500 and 800), forcing the exploration of new cost-effective, non-invasive diagnostic methods with more outstanding performance. Therefore, EUS plus elastography has been explored as a complementary method.

Elastography evaluates tissue elasticity by ultrasonography, magnetic resonance, or optical coherence tomography11. It has shown its usefulness in the breasts12, prostate13, and thyroid14,15, as well as to guide or avoid biopsies of tissues, especially the liver. Although biopsy has been considered the gold standard for determining the fibrosis index, its use is limited by the invasiveness of the method (with significant morbidity and mortality), costs, and error in taking the sample, making it challenging to monitor the progression of fibrosis16.

Currently, transient elastography (FibroScanTM) has made it possible to establish the degree of fibrosis non-invasively, making it a widely used method16,17. It is less sensitive in patients with ascites, abundant adipose tissue, narrow intercostal spaces, and liver atrophy18,19 with a significant intra- and interobserver variability depending on the compression of the probe and less accuracy in the diagnosis of moderate fibrosis17,19,20. Therefore, real-time elastography (RTE) has emerged as the evolution of transient elastography, which may be more sensitive in diagnosing the degree of liver fibrosis. It will accurately determine that a liver fibrosis index (LFI) greater than 2.56 correlates with METAVIR scores of F421,22, even in the presence of inflammation23-27.

In the pancreas, RTE-EUS better characterizes different pathologies, such as chronic pancreatitis, fatty pancreas, and pancreatic cancer, by evaluating the rigidity of the pancreatic tissue with a color scale (qualitative elastography)28,29. In this field, pancreatic steatosis, an entity described in cadavers in 1926 and documented 40 years later concerning age and obesity30,31, has been classified as congenital and acquired. The latter is associated with obesity and metabolic syndrome, called pancreatic steatosis or nonalcoholic fatty pancreas disease32,33. The consequences are still under study; however, a relationship has been found with pancreatic cancer development, increasing its relevance 34,35.

Our group considers it could be used the same way but to assess the pancreatic parenchyma. In this pilot study, our objective is to assess whether the LFI measured by RTE-EUS is useful for differentiating normal, fatty, or cancerous pancreatic tissue in a cohort of patients evaluated using EUS.

Materials and methods

Study design and population

A prospective cross-sectional study was carried out at the University Hospital, a reference center for Gastroenterology and Ultrasound Endoscopy in Bogotá, Colombia, between January 2019 and January 2020. A total of 682 endoscopic ultrasounds were performed in patients who met the following criteria.

Inclusion criteria

  • Age equal to or older than 18 years (for both groups)

  • Patients referred for diagnostic ultrasound endoscopy without a history of the biliopancreatic disease (subepithelial or mucosal lesions, among others) (Group 1)

  • Patients sent for biopsy of solid pancreatic lesions, suspicious of cancer, whose cytology confirmed adenocarcinoma of the pancreas (Group 2)

  • Signed informed consent

Exclusion criteria

  • Patients with a history of acute or chronic pancreatitis

  • Patients who underwent an endoscopic ultrasound biopsy, but the pathology did not confirm the tumor

  • Patients with biliopancreatic disease other than cancer

  • Patients with portal hypertension of any etiology

  • Patients without a spleen

  • Patients with biliopancreatic anatomical alteration

  • Patients with decreased functionality greater than four on the Eastern Cooperative Oncology Group (ECOG)36 scale

  • Patients at risk of bleeding, with an international normalized ratio (INR) > 1.5 or with a platelet count < 50,000/mm2

  • Pregnant woman

  • Patients under 18 years of age

  • Patients who did not authorize the inclusion of their data in the study

Following the criteria, 66 patients were included for analysis (Figure 1).

Figure 1 Diagram of the study’s basic design. 

Intervention

Patients who received endoscopic ultrasonography indicated by their treating physician, both inpatient and outpatient, and did not meet any of the exclusion criteria were questioned before the procedure, following a virtual form-type data collection tool. It gathered the demographic data, indication for the study, and the patient’s relevant history. A specialist in Internal Medicine and Gastroenterology fellow, previously trained to fill out the virtual form, simultaneously recorded the data obtained during the study. These data were downloaded, corrected, and entered into SPSS software (version 12.0; SPSS Inc).

In all patients, endoscopic ultrasonography was performed following the quality indicators of the American Society for Gastrointestinal Endoscopy and the American College of Gastroenterology37. They were carried out in the Gastroenterology ward of a reference unit for diagnostic endoscopic procedures under sedation guided by an anesthesiologist, with a combination of propofol and remifentanil, titrated according to each patient’s characteristics, after examination by the Anesthesiology service.

All procedures were performed with a Pentax linear echoendoscope (EG3870UTK; Pentax, Tokyo, Japan), combined with a portable Noblus color Doppler ultrasound system (Hitachi Aloka Medical, Tokyo, Japan), including the elastography module and another LFI module supplied by the manufacturer. An endoscopist experienced in interventional procedures, with more than 2,000 diagnostic and therapeutic EUSs, performed all EUSs.

The pancreatic parenchyma was evaluated during the examination, while the echogenicity was classified into Grades I to IV. The classification system was adapted from Sepe et al35. Besides echogenicity, the salt-and-pepper pattern of the pancreatic parenchyma and the clarity in delimiting the pancreatic duct were assessed. Grade I was defined as a pancreas in which more than 80% of the parenchyma is hypoechoic or isoechoic compared to the spleen, the major pancreatic duct is visibly outlined, and the salt-and-pepper pattern is observed. Grade II was defined as a pancreas in which more than 80% is hyperechoic compared to the spleen, the major pancreatic duct is visibly outlined, and the salt-and-pepper pattern is observed. Grade III was defined as a pancreas in which more than 80% is moderately hyperechoic when compared to the spleen, the major pancreatic duct is moderately obscured, and the salt-and-pepper pattern is moderately blurred. Grade IV was defined as a pancreas in which more than 80% is severely hyperechoic compared to the spleen, the margins of the main pancreatic duct are severely obscured, and the salt-and-pepper pattern is severely blurred. Grades I and II were considered normal, while grades III and IV as the fatty pancreas (Table 1)35.

Table 1 Fatty pancreas classification scale. Taken from35  

Grade
I Pancreas in which more than 80% of the parenchyma is hypoechoic or isoechoic compared to the spleen. The major pancreatic duct is visibly outlined, and the salt-and-pepper pattern is observed.
II Pancreas in which more than 80% is hyperechoic compared to the spleen. The major pancreatic duct is visibly outlined, and the salt-and-pepper pattern is observed.
III Pancreas in which more than 80% is moderately hyperechoic compared to the spleen. The major pancreatic duct is moderately obscured, and the salt-and-pepper pattern is moderately blurred.
IV Pancreas in which more than 80% is severely hyperechoic compared to the spleen. The margins of the major pancreatic duct are severely obscured, and the salt-and-pepper pattern is severely blurred.

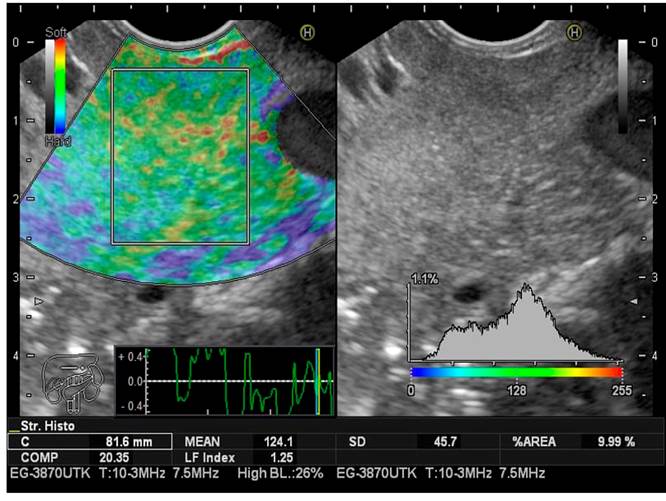
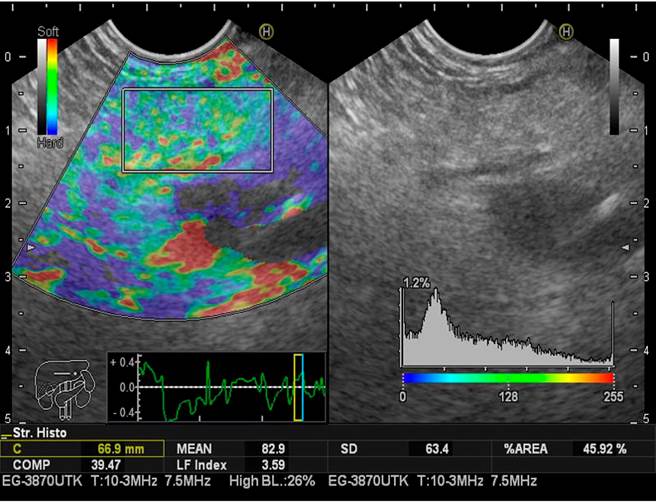
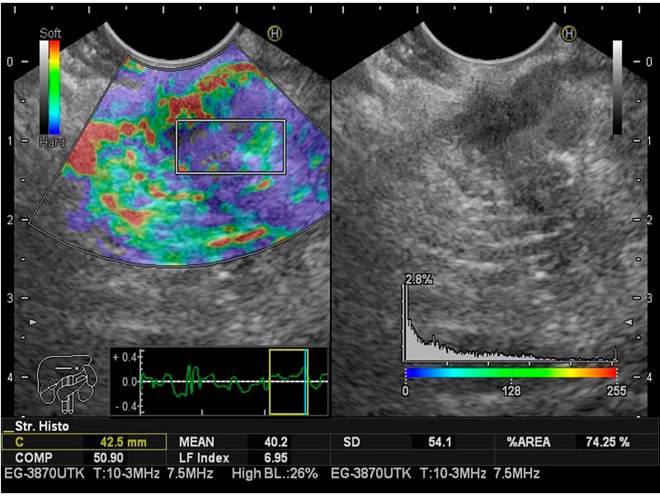
LFI taken for the pancreas was estimated three times during endoscopic ultrasonography in all patients to limit selection bias. The mean value of the three measurements was considered the final result of the analysis. As previously described, the LFI considers 11 parameters to find image patterns that assess the stiffness of the liver parenchyma. It is achieved by simply placing the cursor where we want to measure the LFI. The computer immediately calculates this index by pressing the “Enter” button. It has been used in abdominal ultrasound for the staging of liver fibrosis for approximately a decade using elastography images (RTE).

The sequential LFI is completed as follows:

  1. Convert the selected analysis area of the RTE image to a 256-frame color scale image.

  2. Plot the voltage histogram.

  3. Calculate the mean of the relative stress (mean), the standard deviation of the relative stress (SD), the skewness of the strain histogram (SKEW), and the kurtosis of the strain histogram (KURT).

  4. Binarize the RTE image into black and white regions: White as low voltage (blue) and black as all other regions.

  5. To characterize the low-stress regions (blue), calculate the proportion of low-stress regions within the selected analysis area (area%) and the complexity of the low-stress region (COMP).

  6. Calculate entropy (ENT).

  7. Calculate the inverse difference moment (IDM) and angular second moment (ASM) to assess the texture of the RTE image

  8. Perform multiple regression analysis to improve diagnostic accuracy using all of these imaging features, rather than diagnosing with individual imaging features, as shown in the following multiple regression equation23:

  9. LFI = -0.009 x MEAN - 0.005 x SD + 0.023 x Area % + 0.025 x COMP + 0.775 x SKEW - 0.281 x KURT + 2.083 x ENT + 3.042 x IDM + 39.979 x ASM - 5.542

This calculation is done in milliseconds with the software, which does not significantly increase the time of the procedure (Figures 2,3y4).

Figure 2 Elastography and LFI in normal pancreas. 

Figure 3 Elastography and LFI in the fatty pancreas. 

Figure 4 Elastography and LFI in pancreatic cancer. 

Study variables and definition of variables

Table 2 shows the study variables and their definitions.

Table 2 Study variables and definitions 

Variable Nature Scale Category
Age Quantitative Ratio Discrete Years old
Sex Qualitative

  • Nominal

  • Dichotomous

  • Male

  • Female

Background Qualitative

  • Nominal

  • Polychotomous

  • High blood pressure

  • Diabetes mellitus

  • Obesity; BMI > 30

  • Hypothyroidism

  • Dyslipidemia

  • Coronary heart disease

  • Cerebrovascular disease

  • Alcohol use (>14 g week)

  • Hepatic steatosis confirmed by imaging

  • Other

EUS indication Qualitative Nominal Polychotomous

  • Indication described by the treating physician

Classification of the fatty pancreas by ultrasound endoscopy Qualitative Nominal Polychotomous

  • Grade I

  • Grade II

  • Grade III

  • Grade IV

Pancreatic fibrosis index Quantitative Continuous

  • Fibrosis index value

BMI: Muscle mass index; EUS: Endoscopic ultrasonography.

Statistical analysis

The database was registered in a virtual form (available on Google Drive with the shortened address shorturl.at/pIMWX). Then, this information was downloaded into Excel data tables, version 2013. We corrected, tabulated, and analyzed the data in the statistical package SPSS, version 2.1. Quantitative variables with normal distribution are presented as the mean and those with abnormal distribution as the median.

The univariate analysis was performed using a descriptive statistic to determine the absolute and relative frequencies in the qualitative variables. In the case of quantitative variables, central tendency, dispersion, or position measures were taken (using mean and standard deviation when the numerical variable follows the normal or median distribution).

We calculated the confidence interval for the data set based on the mean, standard deviation, and sample size for the data unit, with a P-value equal to 0.05. To determine the normal distribution of the numerical variables, the Kolmogorov-Smirnov statistic (KS statistic) was used, understanding that a p-value equal to 0.05 follows the normal distribution curve. An analysis of variance (one-way ANOVA) was performed to determine statistically significant differences between the means of these three groups (normal pancreas, fatty pancreas, pancreatic cancer), which is greater than 0.05. The prevalence will be expressed as a percentage. We sought to determine whether the LFI is different in the normal pancreas, fatty pancreas, and pancreatic carcinoma groups.

Objective

To assess whether LFI can distinguish normal pancreas from the fatty pancreas and pancreatic cancer.

Results

In total, 66 patients were included. Group 1 included 55 patients sent for ultrasound endoscopy to assess pathologies other than a biliopancreatic disease; 32 were women, with an age range of 23-89, the mean age being 56.75 years. Group 2 had 11 patients diagnosed with pancreatic cancer confirmed by cytology, six women and five men, with an age range of 54-89, the mean being 69.56 years. The personal history of this population was high blood pressure, diabetes mellitus, obesity (defined as BMI greater than 30), hypothyroidism, and dyslipidemia, the most frequent being steatosis or steatohepatitis (n = 14), the mean being 25.45. The most frequent indication to perform the procedure was subepithelial lesion (n = 29). The percentages of patients according to the echogenicity of the pancreas were Grade I (n = 29), Grade II (n = 5), Grade III (n = 18); Grade IV (n = 3) (Table 3).

Table 3 Demographic characteristics of the study population 

Group 1 Group 2
Normal pancreas Fatty pancreas Total Pancreatic cancer
Age n = average (range in years) 57.26 (25-72) n = average (range in years) 55.90 (23-78) n = average (range in years) 56.58 (23-78) n = average (range in years) 69.56 (54-89)
Gender Normal (n = 34); n = (%) Fat (n = 21); n = (%) Total (n = 55); n = (%) Total (n = 11); n = (%)
Female 23 (67.65) 9 (42.86) 32 (58.18) 6 (54.55)
Male 11 (32.35) 12 (57.14) 23 (41.82) 5 (45.45)
History
Steatosis or steatohepatitis (confirmed by a previous diagnostic imaging test, ultrasound, MRI, tomography) 6 (17.65) 8 (38.09) 14 (25.45)
Hypothyroidism 5 (14.71) 3 (14.29) 8 (14.54) 2 (18.18)
Diabetes mellitus 4 (11.76) 4 (19.05) 8 (14.54) 5 (45.45)
Dyslipidemia 4 (11.76) 3 (14.29) 7 (12.73)
Alcohol use (more than 14 g per week) 2 (5.88) 2 (9.52) 4 (7.27) 3 (27.27)
Arrhythmia 1 (2.94) 1 (1.82)
Coronary heart disease 1 (2.94) 1 (4.76) 2 (3.64) 1 (9.09)
Barrett’s esophagus 1 (2.94) 1 (1.82)
Dyspepsia 1 (2.94) 8 (14.54)
High blood pressure 1 (2.94) 2 (9.52) 3 (5.45) 5 (45.45)
Cerebrovascular disease 1 (2.94) 1 (4.76) 1 (1.82)
Kidney failure 1 (2.94) 1 (1.82)
No history 6 (17.65) 2 (9.52) 8 (14.54)
BMI classification. Taken from38
Underweight < 18.5 5 (14.71) 1 (4.76) 6 (10.91) 5 (45.45)
Normal range (18.5-24.9) 18 (52.94) 5 (23.81) 23 (41.82) 6 (54.55)
Overweight (25.0-29.9) 8 (23.53) 10 (47.62) 18 (32.73)
Obesity (≥ 30) 2 (5.88) 4 (19.05) 6 (10.91)
Class I obesity (30.0-34.9) 1 (2.94) 3 (14.29) 4 (7.27)
Class II obesity (35.0-39.9) 1 (2.94) 1 (1.82)
Class III obesity (> 40) 1 (4.76) 1 (1.82)
Indication of the procedure
Abdominal pain 5 (14.71) 3 (14.29) 8 (14.54)
Pancreatic tumor 11 (32.35)
Gastric neuroendocrine tumor 1 (4.76) 1 (1.82)
Gastric extrinsic compression 1 (2.94) 1 (1.82)
Subepithelial lesion 20 (58.82) 9 (42.86) 29 (52.73)
Unexplained weight loss 2 (5.88) 2 (3.64)
Thick gastric folds 3 (8.82) 2 (9.52) 5 (9.09)
Gallbladder polyps 1 (4.76) 1 (1.82)
Elevated gastric lesion 2 (5.88) 4 (19.05) 6 (10.91)
Elevated duodenal lesion 1 (2.94) 1 (4.76) 2 (3.64)

The LFI for the pancreas (mean value of the three measurements), taking Grades I and II as normal and Grades III and IV as fatty pancreas, were, respectively: Normal (n = 34), LFI 2.60, range 0.97-3.47; fatty pancreas (n = 21), LFI 3.87, range 2-5.5. There is a prevalence for the fatty pancreas of 38.18% when LFI is performed in three different subgroups considered endoscopically normal, fatty pancreas, patients with a previous diagnosis of pancreatic cancer confirmed by histology. The LFI taken in the pancreas was for the three groups, respectively: Normal (Grades I and II): LFI 2.60, range 0.97-3.47 (95% CI 2.17-3.02); fatty pancreas (Grades III and IV): LFI 3.87, range 2-5.5 (95% CI 3.44-4.29); pancreatic cancer: LFI 6.35, range 5.8-7.8 (95% CI 5.92-6.77) (Table 4).

Table 4 LFI results in the three groups 

Number Average LFI taken in the pancreas 95% CI (p < 0.05)
Grade I and II 34 2.60 2.17-3.02
Grade III and IV 21 3.87 3.44-4.29
Pancreatic carcinoma 11 6.35 5.92-6.77

95% CI: 95% confidence interval of 2.17-3.02; LFI: Liver fibrosis index.

Discussion

The fatty pancreas is a recently recognized condition that has been little investigated39. Different names have described these changes: Fatty pancreas, fatty infiltration, fatty replacement, and pancreatic lipomatosis. For this article, we have called it a fatty pancreas. Its spectrum ranges from the accumulation of interlobular fat (macrovesicles) to nonalcoholic pancreatic steatosis40. Thus, its epidemiology is not yet well defined, given the lack of parameters for a precise diagnosis and, as noted, the apparent differences in terminology to refer to the same entity.

A fatty pancreas is generally deemed an incidental finding during abdominal imaging for other reasons (with no standardized screening test yet). Epidemiological data are limited to the Asian population, and it is estimated that its prevalence may be between 16% and 35%41. A fatty pancreas has been associated with further development of pancreatic and metabolic complications. An association has been found with type 2 diabetes mellitus, acute pancreatitis (onset and severity), exocrine pancreatic insufficiency, chronic pancreatitis, pancreatic fibrosis, and even pancreatic carcinoma35,39-42.

Its pathogenesis is still under investigation, and data are scarce. However, an emerging hypothesis has been proposed that there is a more significant infiltration of macrophages in the pancreatic fatty tissue due to the alteration of the hormonal microenvironment, resulting in a chronic inflammatory condition characterized by the secretion of proinflammatory cytokines (TNF-α and IL-1β)42. Alternative hypotheses suggest that lipotoxicity resulting from triglyceride accumulation in β cells causes impaired glucose metabolism, leading to cell apoptosis and fat replacement. Paracrine signaling by adipocytes in the pancreas is added, which negatively regulates β cells. All of this alters glucose metabolism, which predisposes to type 2 diabetes mellitus41,42.

Pathways affected in acute pancreatitis involve increased production of free radicals, leading to injury and death of acinar cells. They can be replaced by fatty tissue, predisposing patients to develop more severe acute pancreatitis32-35,39-42. Finally, concerning pancreatic cancer, a fatty pancreas independently predisposes individuals to develop a pancreatic malignancy. Although the mechanism is unclear, this association may derive from chronic lipogenic inflammation while altering the microenvironment in a protumoral way32,34,42.

Assessment of the fatty pancreas includes a histological examination. The fatty infiltration of the pancreas bypasses the acini (exocrine function) and the islets of Langerhans (endocrine function) and preferentially accumulates within the pancreatic interstitial septa for unknown reasons. Usually, the entire pancreas is affected diffusely. Rarely, the ectopic fat deposition can be uneven, which occurs preferably in the head of the anterior pancreas, with preservation of the uncinate process, probably related to its embryological origin43.

The retroperitoneal location of the pancreas, the heterogeneous distribution of fat, and poorly defined borders make the fatty pancreas assessment challenging40-43; therefore, EUS plays a dominant role in this and other pancreatic diseases since it has significantly changed the diagnosis and management of 25% to 50% of cases44-48. However, an accurate diagnosis cannot always be determined using conventional EUS images alone. For example, in pancreatic cancer, the accuracy of EUS (without elastography) to differentiate cancer from benign lesions is approximately 75%39-43,49, requiring EUS-FNA, which reaches a sensitivity of 89%, specificity of 96%, and diagnostic accuracy of 97%37,50-52.

One of the difficulties in EUS-guided puncture is that tissue collection is technically demanding, and multiple punctures may be needed to obtain a sufficient amount of tissue47,48. Occasionally, despite repeated sampling, cytohistological evaluation may be falsely negative and may be associated with small but not insignificant morbidity rates53. Therefore, it is necessary to explore new methods to characterize lesions more precisely but non-invasively, limiting the need for biopsy in the areas with the highest suspicion of malignancy. One of these methods is EUS-guided elastography, which gave rise to the vibration technique in breast ultrasonography53,54.

Elastography is based on the knowledge that many pathological processes, such as fibrosis, inflammation, and cancer, induce alterations in tissue stiffness12,55,56. This technique assesses stiffness by applying slight compression. Using an ultrasound transducer on the target tissue and recording the displacement of the evaluated region, the physiological and respiratory vascular pulsations provide the vibrations (compressions) necessary for the study57-59.

There are different generations of initially qualitative elastography (colors), which served as the basis for the recently described second-generation elastography by EUS. It enables the quantitative evaluation of tissue stiffness with two different approaches: The strain ratio (SR) and the strain histogram (SH). This RTE-EUS can improve diagnostic performance non-invasively44-48,50-56,60-69.

The most studied of these methods is the SR by Itokawa et al, being a quantitative elastography technique to differentiate a lesion highly suggestive of cancer, with an average SR of 39.08 or more, from an inflammatory mass, with a mean SR of 23.66 or less (p < 0.05)61. Unfortunately, subsequent studies have not been consistent or reproducible, defining different cut-off values ranging from SR 3.7 to 24, with a sensitivity of 67-98% and with lower levels of specificity of 45-71%. Hence, its application in routine clinical practice is complex56,61,62,67. There is a need to assess other methods with more accurate and reproducible results. The answer could lie in the LFI, which, as explained previously, has already been validated, and its usefulness has been demonstrated in the non-invasive diagnosis of liver diseases, with an excellent correlation in measuring the stiffness of the liver parenchyma and detecting fibrosis and fatty liver23,25.

As explained above, the LFI is calculated automatically using software that uses the elastography images in real time; 11 variables are included. An initial finding of our work is that a third (38%) of the patients evaluated by EUS have a finding compatible with a fatty pancreas. Nonetheless, as reported in the literature, the prevalence in Asian countries and the United States ranges between 16% and 35%55,65. It may be related to the fact that 19% had obesity (BMI greater than 30) and 38% had fatty liver, documented by previous imaging. Of those with a fatty pancreas, more than 30% had some symptom of pancreatic insufficiency. From this study, it is not possible to establish relationships, even though a clear association has been found between nonalcoholic fatty pancreatic disease (NAFPD) with obesity and metabolic syndrome. Fatty degeneration and fibrosis in the pancreatic tissue surrounding most pancreatic adenocarcinomas have also been found33,70-72.

Therefore, detecting the fatty pancreas, especially the early detection of pancreatic cancer, is a permanent challenge in clinical practice. It is crucial to have an accurate tool for the early detection of these conditions, allowing timely medical intervention. Our proposal is to use the LFI measured by elastography through EUS.

We carried out this pilot study to evaluate its usefulness in the pancreas. This study found that, as in the liver, there is an association between the increase in LFI and tissue stiffness in the three groups of patients evaluated: Normal pancreas, fatty pancreas, and pancreatic carcinoma. We believe that it could be a useful and more objective tool than the SR if these results can be reproduced in studies with a larger and more heterogeneous population, making it possible to assess its performance in different scenarios of the fatty pancreas in controlled studies.

The main limitation is the sample size, as it is a single-center study with one observer. Being a pilot study with promising findings, it innovates in a field of medical knowledge still in development. It opens the door for new studies that clearly define the usefulness of this diagnostic and follow-up method in this and other settings.

Conclusion

This pilot study is the first in the world to use LFI applied to the pancreatic parenchyma. It was shown to help differentiate between normal and fatty pancreas and pancreatic carcinoma non-invasively; however, this finding must be validated in more extensive and heterogeneous populations.

Referencias

1. Gordon-Dseagu VL, Devesa SS, Goggins M, Stolzenberg-Solomon R. Pancreatic cancer incidence trends: Evidence from the surveillance, epidemiology and end results (SEER) population-based data. Int J Epidemiol. 2018;47(2):427-39. https://doi.org/10.1093/ije/dyx232Links ]

2. Petrov MS, Yadav D. Global epidemiology and holistic prevention of pancreatitis. Nat Rev Gastroenterol Hepatol. 2019;16(3):175-84. https://doi.org/10.1038/s41575-018-0087-5Links ]

3. Hisanaga K, Hisanaga A, Nagata K, Ichie Y. High speed rotating scanner for transgastric sonography. Am J Roentgenol. 1980;135(3):627-9. https://doi.org/10.2214/ajr.135.3.627Links ]

4. Dimagno EP, Regan PT, Clain JE, James EM, Buxton JL. Human endoscopic ultrasonography. Gastroenterology. 1982;83(4):824-9. https://doi.org/10.1016/S0016-5085(82)80012-7Links ]

5. Yamashita Y, Kato J, Ueda K, Nakamura Y, Kawaji Y, Abe H, et al. Contrast-enhanced endoscopic ultrasonography for pancreatic tumors. Biomed Res Int. 2015;2015:491782. https://doi.org/10.1155/2015/491782Links ]

6. Moutinho-Ribeiro P, Iglesias-García J, Gaspar R, Macedo G. Early pancreatic cancer - The role of endoscopic ultrasound with or without tissue acquisition in diagnosis and staging. Dig Liver Dis. 2019;51(1):4-9. https://doi.org/10.1016/j.dld.2018.09.027Links ]

7. DeWitt J, Devereaux BM, Lehman GA, Sherman S, Imperiale TF. Comparison of endoscopic ultrasound and computed tomography for the preoperative evaluation of pancreatic cancer: A systematic review. Clin Gastroenterol Hepatol. 2006;4(6):717-25. https://doi.org/10.1016/j.cgh.2006.02.020Links ]

8. DeWitt J, Devereaux B, Chriswell M, McGreevy K, Howard T, Imperiale TF, et al. Comparison of endoscopic ultrasonography and multidetector computed tomography for detecting and staging pancreatic cancer. Ann Intern Med. 2004;141(10):753-63. https://doi.org/10.7326/0003-4819-141-10-200411160-00006Links ]

9. Luz LP, Al-Haddad MA, Sey MSL, Dewitt JM. Applications of endoscopic ultrasound in pancreatic cancer. World J Gastroenterol. 2014;20(24):7808-18. https://doi.org/10.3748/wjg.v20.i24.7808Links ]

10. Wang W, Shpaner A, Krishna SG, Ross WA, Bhutani MS, Tamm EP, et al. Use of EUS-FNA in diagnosing pancreatic neoplasm without a definitive mass on CT. Gastrointest Endosc. 2013;78(1):73-80. https://doi.org/10.1016/j.gie.2013.01.040Links ]

11. Shi Y, Glaser KJ, Venkatesh SK, Ben-Abraham EI, Ehman RL. Feasibility of using 3D MR elastography to determine pancreatic stiffness in healthy volunteers. J Magn Reson Imaging. 2015;41(2):369-75. https://doi.org/10.1002/jmri.24572Links ]

12. Itoh A, Ueno E, Tohno E, Kamma H, Takahashi H, Shiina T, et al. Breast disease: Clinical application of US elastography for diagnosis. Radiology. 2006;239(2):341-50. https://doi.org/10.1148/radiol.2391041676. [ Links ]

13. Correas JM, Tissier AM, Khairoune A, Khoury G, Eiss D, Hélénon O. Ultrasound elastography of the prostate: State of the art. Diagn Interv Imaging. 2013;94(5):551-60. https://doi.org/10.1016/j.diii.2013.01.017Links ]

14. Lyshchik A, Higashi T, Asato R, Tanaka S, Ito J, Mai JJ, et al. Thyroid gland tumor diagnosis at US elastography. Radiology. 2005;237(1):202-11. https://doi.org/10.1148/radiol.2363041248Links ]

15. Dighe M, Luo S, Cuevas C, Kim Y. Efficacy of thyroid ultrasound elastography in differential diagnosis of small thyroid nodules. Eur J Radiol. 2013;82(6):e274-80. https://doi.org/10.1016/j.ejrad.2013.01.009Links ]

16. Schulman AR, Lin MV, Rutherford A, Chan WW, Ryou M. A prospective blinded study of endoscopic ultrasound elastography in liver disease: Towards a virtual biopsy. Clin Endosc. 2018;51(2):181-5. https://doi.org/10.5946/ce.2017.095Links ]

17. Pang JX, Zimmer S, Niu S, Crotty P, Tracey J, Pradhan F, et al. Liver stiffness by transient elastography predicts liver-related complications and mortality in patients with chronic liver disease. PLoS One. 2014;9(4):e95776. https://doi.org/10.1371/journal.pone.0095776Links ]

18. Castéra L, Foucher J, Bernard PH, Carvalho F, Allaix D, Merrouche W, et al. Pitfalls of liver stiffness measurement: A 5-year prospective study of 13,369 examinations. Hepatology. 2010;51(3):828-35. https://doi.org/10.1002/hep.23425Links ]

19. Wong GLH, Wong VWS, Chim AML, Yiu KK, Chu SH, Li MK, et al. Factors associated with unreliable liver stiffness measurement and its failure with transient elastography in the Chinese population. J Gastroenterol Hepatol. 2011;26(2):300-5. https://doi.org/10.1111/j.1440-1746.2010.06510.xLinks ]

20. Lucidarme D, Foucher J, Le Bail B, Vergniol J, Castera L, Duburque C, et al. Factors of accuracy of transient elastography (fibroscan) for the diagnosis of liver fibrosis in chronic hepatitis C. Hepatology. 2009;49(4):1083-9. https://doi.org/10.1002/hep.22748Links ]

21. Tatsumi C, Kudo M, Ueshima K, Kitai S, Ishikawa E, Yada N, et al. Non-invasive evaluation of hepatic fibrosis for type C chronic hepatitis. Intervirology. 2010;53(1):76-81. https://doi.org/10.1159/000252789Links ]

22. Fujimoto K, Kato M, Tonomura A, Yada N. Non-invasive evaluation method of the liver fibrosis using real-time tissue elastography. Usefulness of judgment liver fibrosis stage by liver fibrosis index (LF index). Kanzo. 2010;51(9):539-41. https://doi.org/10.2957/kanzo.51.539Links ]

23. Fujimoto K, Kato M, Kudo M, Yada N, Shiina T, Ueshima K, et al. Novel image analysis method using ultrasound elastography for noninvasive evaluation of hepatic fibrosis in patients with chronic hepatitis C. Oncology. 2013;84(1):3-12. https://doi.org/10.1159/000345883Links ]

24. Tatsumi C, Kudo M, Ueshima K, Kitai S, Takahashi S, Inoue T, et al. Noninvasive evaluation of hepatic fibrosis using serum fibrotic markers, transient elastography (FibroScan) and real-time tissue elastography. Intervirology. 2008;51(1):27-33. https://doi.org/10.1159/000122602Links ]

25. Benedict M, Zhang X. Non-alcoholic fatty liver disease: An expanded review. World J Hepatol. 2017;9(16):715-32. https://doi.org/10.4254/wjh.v9.i16.715Links ]

26. Sayiner M, Koenig A, Henry L, Younossi ZM. Epidemiology of nonalcoholic fatty liver disease and nonalcoholic steatohepatitis in the United States and the rest of the world. Clin Liver Dis. 2016;20(2):205-14. https://doi.org/10.1016/j.cld.2015.10.001Links ]

27. Kanwar P, Kowdley KV. The metabolic syndrome and its influence on nonalcoholic steatohepatitis. Clin Liver Dis. 2016;20(2):225-43. https://doi.org/10.1016/j.cld.2015.10.002. [ Links ]

28. Hirooka Y, Kuwahara T, Irisawa A, Itokawa F, Uchida H, Sasahira N, et al. JSUM ultrasound elastography practice guidelines: Pancreas. J Med Ultrason. 2015;42(2):151-74. https://doi.org/10.1007/s10396-014-0571-7Links ]

29. Giovannini M, Hookey L, Bories E, Pesenti C, Monges G, Delpero JR. Endoscopic ultrasound elastography: The first step towards virtual biopsy? Preliminary results in 49 patients. Endoscopy. 2006;38(4):344-8. https://doi.org/10.1055/s-2006-925158Links ]

30. Schaefer J. The normal weight of the pancreas in the adult human being: A biometric study. Anat Tec. 1926;32(2):119-32. https://doi.org/10.1002/ar.1090320204Links ]

31. Olsen TS. Lipomatosis of the pancreas in autopsy material and its relation to age and overweight. Acta Pathol Microbiol Scand A. 1978;86A(5):367-73. https://doi.org/10.1111/j.1699-0463.1978.tb02058.xLinks ]

32. Ramkissoon R, Gardner TB. Pancreatic steatosis: An emerging clinical entity. Am J Gastroenterol. 2019;114(11):1726-34. https://doi.org/10.14309/ajg.0000000000000262Links ]

33. Prachayakul V, Aswakul P. Pancreatic steatosis: What should gastroenterologists know? J Pancreas. 2015;16(3):227-31. https://doi.org/10.6092/1590-8577/2987Links ]

34. Alempijevic T, Dragasevic S, Zec S, Popovic D, Milosavljevic T. Non-alcoholic fatty pancreas disease. Postgrad Med J. 2017;93(1098):226-30. https://doi.org/10.1136/postgradmedj-2016-134546Links ]

35. Sepe PS, Ohri A, Sanaka S, Berzin TM, Sekhon S, Bennett G, et al. A prospective evaluation of fatty pancreas by using EUS. Gastrointest Endosc. 2011;73(5):987-93. https://doi.org/10.1016/j.gie.2011.01.015Links ]

36. Othman MO, Wallace MB. The role of endoscopic ultrasonography in the diagnosis and management of pancreatic cancer. Gastroenterol Clin North Am. 2012;41(1):179-88. https://doi.org/10.1016/j.gtc.2011.12.014Links ]

37. Chen G, Liu S, Zhao Y, Dai M, Zhang T. Diagnostic accuracy of endoscopic ultrasound-guided fine-needle aspiration for pancreatic cancer: A meta-analysis. Pancreatology. 2013;13(3):298-304. https://doi.org/10.1016/j.pan.2013.01.013Links ]

38. Datos sobre la obesidad [Internet]. Organización Mundial de la Salud (consultado el 20 de enero de 2020). Disponible en: Disponible en: https://www.who.int/health-topics/obesity#tab=tab_1Links ]

39. Shah N, Rocha JP, Bhutiani N, Endashaw O. Nonalcoholic fatty pancreas disease. Nutr Clin Pract. 2019;34(Suppl 1):S49-S56. https://doi.org/10.1002/ncp.10397Links ]

40. Tariq H, Nayudu S, Akella S, Glandt M, Chilimuri S. Non-alcoholic fatty pancreatic disease: A review of literature. Gastroenterology Res. 2016;9(6):87-91. https://doi.org/10.14740/gr731wLinks ]

41. Khoury T, Asombang AW, Berzin TM, Cohen J, Pleskow DK, Mizrahi M. The clinical implications of fatty pancreas: A concise review. Dig Dis Sci. 2017;62(10):2658-67. https://doi.org/10.1007/s10620-017-4700-1Links ]

42. Acharya C, Navina S, Singh VP. Role of pancreatic fat in the outcomes of pancreatitis. Pancreatology. 2014;14(5):403-8. https://doi.org/10.1016/j.pan.2014.06.004Links ]

43. Singh RG, Yoon HD, Wu LM, Lu J, Plank LD, Petrov MS. Ectopic fat accumulation in the pancreas and its clinical relevance: A systematic review, meta-analysis, and metaregression. Metabolism. 2017;69:1-13. https://doi.org/10.1016/j.metabol.2016.12.012Links ]

44. Mittal D, Kumar V, Saxena SC, Khandelwal N, Kalra N. Neural network based focal liver lesion diagnosis using ultrasound images. Comput Med Imaging Graph. 2011;35(4):315-23. https://doi.org/10.1016/j.compmedimag.2011.01.007. [ Links ]

45. Lightdale CJ. Endoscopic ultrasound. Gastrointest Endosc Clin N Am. 2005;15(1):863-79. https://doi.org/10.1016/j.giec.2004.08.001Links ]

46. Tamerisa R, Irisawa A, Bhutani MS. Endoscopic ultrasound in the diagnosis, staging, and management of gastrointestinal and adjacent malignancies. Med Clin North Am. 2005;89(1):139-58. https://doi.org/10.1016/j.mcna.2004.08.010Links ]

47. Luthra AK, Evans JA. Review of current and evolving clinical indications for endoscopic ultrasound. World J Gastrointest Endosc. 2016;8(3):157-64. https://doi.org/10.4253/wjge.v8.i3.157Links ]

48. Iglesias-García J, Lindkvist B, Lariño-Noia J, Domínguez-Muñoz JE. The role of EUS in relation to other imaging modalities in the differential diagnosis between mass forming chronic pancreatitis, autoimmune pancreatitis and ductal pancreatic adenocarcinoma. Rev Esp Enferm Dig. 2012;104(6):315-21. https://doi.org/10.4321/S1130-01082012000600006Links ]

49. Lee LS, Andersen DK, Ashida R, Brugge WR, Canto MI, Chang KJ, et al. Endoscopic ultrasound and related technologies for the diagnosis and treatment of pancreatic disease - Research gaps and opportunities: Summary of a National Institute of Diabetes and Digestive and Kidney Diseases Workshop. Pancreas. 2017;46(10):1242-50. https://doi.org/10.1097/MPA.0000000000000936Links ]

50. Bhatia V, Varadarajulu S. Endoscopic ultrasonography-guided tissue acquisition: How to achieve excellence. Dig Endosc. 2017;29(4):417-30. https://doi.org/10.1111/den.12823Links ]

51. Huang JYL, Chang KJ. Improvements and innovations in endoscopic ultrasound guided fine needle aspiration. J Hepatobiliary Pancreat Sci. 2015;22(7):E37-E46. https://doi.org/10.1002/jhbp.232Links ]

52. Dumonceau JM, Koessler T, van Hooft Jeanin E, Fockens P. Endoscopic ultrasonography-guided fine needle aspiration: Relatively low sensitivity in the endosonographer population. World J Gastroenterol. 2012;18(19):2357-63. https://doi.org/10.3748/wjg.v18.i19.2357Links ]

53. Jhala NC, Jhala DN, Chhieng DC, Eloubeidi MA, Eltoum IA. Endoscopic ultrasound-guided fine-needle aspiration: A cytopathologist’s perspective. Am J Clin Pathol. 2003;120(3):351-67. https://doi.org/ 10.1309/MFRF-J0XY-JLN8-NVDPLinks ]

54. Dumonceau JM, Deprez PH, Jenssen C, Iglesias-García J, Larghi A, Vanbiervliet G, et al. Indications, results, and clinical impact of endoscopic ultrasound (EUS)-guided sampling in gastroenterology: European Society of Gastrointestinal Endoscopy (ESGE) Clinical Guideline - Updated January 2017. Endoscopy. 2017;49(7):695-714. https://doi.org/10.1055/s-0043-109021Links ]

55. Polkowski M, Larghi A, Weynand B, Boustière C, Giovannini M, Pujol B, et al. Learning, techniques, and complications of endoscopic ultrasound (EUS)-guided sampling in gastroenterology: European Society of Gastrointestinal Endoscopy (ESGE) technical guideline. Endoscopy. 2012;44(2):190-205. https://doi.org/10.1055/s-0031-1291543Links ]

56. Iglesias-García J, Lindkvist B, Lariño-Noia J, Domínguez-Muñoz JE. Endoscopic ultrasound elastography. Endosc Ultrasound. 2012;1(1):8-16. https://doi.org/10.7178/eus.01.003Links ]

57. GBD 2017 Pancreatic Cancer Collaborators. The global, regional, and national burden of pancreatic cancer and its attributable risk factors in 195 countries and territories, 1990-2017: A systematic analysis for the Global Burden of Disease Study 2017. Lancet Gastroenterol Hepatol. 2019;4(12):934-47. https://doi.org/10.1016/S2468-1253(19)30347-4Links ]

58. Siegel RL, Miller KD, Jemal A. Cancer statistics, 2020. CA Cancer J Clin. 2020;70(1):7-30. https://doi.org/10.3322/caac.21590Links ]

59. Pardo C, Cendales R. Cancer incidence estimates and mortality for the top five cancer in Colombia, 2007-2011. Colomb Med (Cali). 2018;49(1):16-22. https://doi.org/10.25100/cm.v49i1.3596Links ]

60. Mondal U, Henkes N, Patel S, Rosenkranz L. Endoscopic ultrasound elastography: Current clinical use in pancreas. Pancreas. 2016;45(7):929-33. https://doi.org/10.1097/MPA.0000000000000595Links ]

61. Itokawa F, Itoi T, Sofuni A, Kurihara T, Tsuchiya T, Ishii K, et al. EUS elastography combined with the strain ratio of tissue elasticity for diagnosis of solid pancreatic masses. J Gastroenterol. 2011;46(6):843-53. https://doi.org/10.1007/s00535-011-0399-5Links ]

62. Okasha HH, Mahdy RE, Elkholy S, Hassan MS, El-Mazny AN, Hadad KEE, et al. Endoscopic ultrasound (EUS) elastography and strain ratio, could it help in differentiating malignant from benign pancreatic lesions? Medicine. 2018;97(36):e11689. https://doi.org/10.1097/MD.0000000000011689Links ]

63. Pérez-Cruz PE, Acevedo F. Escalas de estado funcional (o performance status) en cáncer. Gastroenterol Latinoam. 2014;25(3):219-26. [ Links ]

64. Wani S, Wallace MB, Cohen J, Pike IM, Adler DG, Kochman ML, et al. Quality indicators for EUS. Gastrointest Endosc. 2015;81(1):67-80. https://doi.org/10.1016/j.gie.2014.07.054Links ]

65. Cui XW, Chang JM, Kan QC, Chiorean L, Ignee A, Dietrich CF. Endoscopic ultrasound elastography: Current status and future perspectives. World J Gastroenterol. 2015;21(47):13212-24. https://doi.org/10.3748/wjg.v21.i47.13212Links ]

66. Dietrich CF. Elastography, the new dimension in ultrasonography. Praxis (Bern 1994). 2011;100(25):1533-42. https://doi.org/10.1024/1661-8157/a000735Links ]

67. Krouskop TA, Wheeler TM, Kallel F, Garra BS, Hall T. Elastic moduli of breast and prostate tissues under compression. Ultrason Imaging. 1998;20(4):260-74. https://doi.org/10.1177/016173469802000403Links ]

68. Wang D, Yu X, Xiao W, Jiao X, Wu J, Teng D, et al. Prevalence and clinical characteristics of fatty pancreas in Yangzhou, China: A cross-sectional study. Pancreatology. 2018;18(3):263-8. https://doi.org/10.1016/j.pan.2018.02.004Links ]

69. Lesmana CRA, Pakasi LS, Inggriani S, Aidawati ML, Lesmana LA. Prevalence of non-alcoholic fatty pancreas disease (NAFPD) and its risk factors among adult medical check-up patients in a private hospital: A large cross sectional study. BMC Gastroenterol. 2015;15(1):174. https://doi.org/10.1186/s12876-015-0404-1Links ]

70. Lee JS, Kim SH, Jun DW, Han JH, Jang EC, Park JY, et al. Clinical implications of fatty pancreas: Correlations between fatty pancreas and metabolic syndrome. World J Gastroenterol. 2009;15(15):1869-75. https://doi.org/10.3748/wjg.15.1869Links ]

71. Liles JS, Katz MH. Pancreaticoduodenectomy with vascular resection for pancreatic head adenocarcinoma. Expert Rev Anticancer Ther. 2014;14(8):919-29. https://doi.org/10.1586/14737140.2014.919860Links ]

72. Lesmana CRA, Gani RA, Lesmana LA. Non-alcoholic fatty pancreas disease as a risk factor for pancreatic cancer based on endoscopic ultrasound examination among pancreatic cancer patients: A single-center experience. JGH Open. 2017;2(1):4-7. https://doi.org/10.1002/jgh3.12032Links ]

Citation: Gómez-Zuleta MA, Ruiz-Morales OF, Buitrago-Laguado EJ. Usefulness of the Liver Fibrosis Index (LFI) Measured during Endoscopic Ultrasonography in Evaluating the Pancreatic Parenchyma. Rev Colomb Gastroenterol. 2022;37(1):10-23. https://doi.org/10.22516/25007440.644

Ethical considerations This protocol was designed under the current ethical regulations (Declaration of Helsinki, Belmont report, CIOMS guidelines, guidelines for good clinical practice/international harmonization conference GPC/ICH, and, locally, Resolution 8430/1993). According to Resolution 8430/1993 issued by the Colombia Ministry of Health, it is classified as research with minimal risk. Considering that data collection was based on a review of the videos recorded during the diagnostic procedure or the therapeutic intervention due to the patient’s primary clinical condition, we did not perform any medical intervention, nor did we take contact information from the patient. The patient signed an institutional informed consent form prior to the procedure. The principal investigator of this project collected the information, and all the identity data of the patients were coded. The institutional medical ethics committee approved this document

Study funding: The participants funded the study

Received: August 18, 2020; Accepted: November 10, 2021

*Correspondence: Martín Alonso Gómez-Zuleta. martinalonsogomezz@gmail.com

Conflicts of interest:

The authors declare no conflict of interest

Creative Commons License This is an open-access article distributed under the terms of the Creative Commons Attribution License