


 texto em
  Inglês (pdf)
 Artigo em XML
 Referências do artigo
 Enviar este artigo por email
 Citado por SciELO
  Citado por Google
  Similares em
SciELO
Similares em
SciELO  Similares em Google
 Permalink
Introduction
Liver disease is one of the leading causes of worldwide morbidity and mortality1-3. It is a slow process that persists for long periods and results in the progressive destruction of the liver; its timely diagnosis and treatment manage to prolong life expectancy and improve patients’ quality of life4. Disease burden studies allow the gap between the current health condition and an ideal health condition free of disease and disability to be measured based on the disability-adjusted life years (DALYs) lost, calculated from the sum of years of life lost due to premature death (YLLs) and years lived with disability (YLDs)5. In 2019, the number of DALYs due to all causes amounted to 2.54 billion (2.29 to 2.81) worldwide6.
Chronic liver disease and its complications have been included in global disease burden estimates; however, they are undervalued. Liver disease causes around 844 million cases and more than 2 million deaths annually, so its morbidity and mortality can be compared with other chronic diseases7. It is responsible for the progressive increase in recurrent hospital visits and years of life lost due to chronic diseases2,8,9.
The epidemiology of liver disease varies by etiology, sex, territory, age, and disease-specific risk factors8,10,11. It imposes a substantial health burden in many countries and reports a progressive increase worldwide since 1990, partly due to the growth and aging of the population12. In the case of Latin America, deaths from liver cirrhosis doubled between 1980 (1,503) and 2010 (3,674)1.
Cirrhosis is considered a public health threat due to its high mortality, mainly due to alcoholic liver disease (ALD), metabolic disease-associated fatty liver (MAFLD), and chronic hepatitis C virus infection13.
In Colombia, from 2009 to 2016, there were 649,887 cases of liver disease, the highest proportion of patients corresponding to metabolic disorders, cirrhosis, and viral infections10. Liver cirrhosis has become one of the leading causes of disease burden worldwide. In 2019, it caused 46 million (43-49 million) DALYs (1.82%, confidence interval [CI]: 1.64%-2.02% of total DALYs) and was responsible for more than one million deaths, equivalent to 2.6% of deaths globally6.
In the early stages, the disease is usually compensated and asymptomatic, and patients may have a life expectancy similar to that of healthy adults; however, as the disease progresses and decompensates, it can be lethal in up to 80% of cases and frequent and prolonged hospital stays are required with treatments that include mainly liver transplantation, meaning a burden for patients, the health system, and the government12.
The close relationship between the per capita consumption of liters of alcohol and the increase in the mortality rate from liver disease has been studied throughout the world, and it is decisive given the variety of non-communicable diseases attributable to consumption (fatty liver, alcoholic hepatitis, and cirrhosis)3,9,14.
Non-alcoholic steatohepatitis (NASH) is an essential cause of liver disease worldwide15. In 2019, it caused around 168,000 deaths and 4.4 million DALYs (3.3-5.6) (0.17% of total DALYs)6. Viral infections affect the world population and have gained significant importance due to their considerable increase despite the available vaccines against hepatitis A and B14. In 2015, they caused 1.34 million deaths (primarily due to chronic liver disease [720,000] and primary liver cancer [470,000]), a number comparable to deaths from tuberculosis (1.37 million) and more than deaths from human immunodeficiency virus (HIV; 1.06 million) or malaria (0.44 million)16,17. This scenario does not show much variation compared to 2019, when hepatitis B and C were responsible for 1.1 million deaths and 1.3% of the total DALYs worldwide6.
In 2019, liver cancer was responsible for 484,000 deaths and 12,000 DALYs (0.49% of total DALYs worldwide)6. It is the leading cause of death in many countries with medium and low sociodemographic indices; however, countries with high sociodemographic indices have shown an increase due to risk factors such as alcohol abuse, hepatitis B and C, and NASH18.
Patients with liver disease pose challenges for health professionals; their quality of life is inferior, representing a significant economic burden for the country4. This disease’s treatment is expensive and inaccessible in most of the world1. In Colombia, approaches have been introduced to determine the impact of liver disease; nonetheless, few publications support intervention initiatives in public policy. Therefore, it is necessary to provide an overview of the main etiologies of liver disease.
Materials and methods
Estimation of the disease burden
This descriptive cross-sectional study determined Colombia’s economic and liver disease burden between 2009 and 2016. From the definition of the diagnoses concerned and the creation of disease categories (cirrhosis, portal hypertension, congenital and birth, pregnancy, non-cirrhotic alcoholic liver disease [NAFLD], inflammatory, metabolic, toxic, primary liver tumors [hepatic tumors], vascular, and viral infections), the data were analyzed by sex, year of care/death, ICD-10 primary diagnosis grouped into categories, age in five-year periods, and geographic location. The study used the Data Warehouse-Cube population databases of Colombia’s Integrated Social Protection Information System (SISPRO, for its acronym in Spanish)19 as the primary source of prevalence data and the registry of vital statistics (deaths) of the National Administrative Department of Statistics (DANE, for its acronym in Spanish)20.
To calculate the prevalence and mortality rate of liver disease per year, it was adjusted for underreporting using Bennett Horiuchi’s method, based on the intercensal estimate of deaths between 2009 and 201621.
In the global disease burden study, disability weights were defined for the diseases included in the studies; however, since these data were not available for all disease categories, disability weights were determined with a group of four experts in liver disease using the Delphi method22. We explained to them that the disability weights reflect the severity of the disease on a scale from 0 (perfect health) to 1 (death), exemplified by disability weights from the study conducted worldwide by the Global Burden of Disease (GBD) 201623.
Each expert was sent a format with the list of diagnoses grouped into disease categories, in which, according to their medical criteria, they defined the weight of disability. Two rounds were completed for expert consensus; in the second, the results of the first round were sent, obtaining the final values defined by the experts for each disease category, with which YLDs were calculated.
Prevalence and mortality data were included in the Microsoft Excel template according to the World Health Organization’s (WHO) Manual 21, with the disability weights assigned by the experts for each disease category. The outcome variables for the disease burden given by DALYs were YLL plus YLD. The data was consolidated into a matrix by category for analysis. The disease burden was calculated based on life expectancy at birth for a society with low mortality24,25, with an average of 80 years for men and 82.5 years for women, like Japan26.
Estimation of the economic burden
The economic burden associated with premature deaths from cirrhosis and liver tumors was estimated through the economic valuation of the potentially productive years of life lost (PPYLL). For this, the method applied by the authors in previous studies27-30 was used. The PPYLL was valued based on the productive period of people in Colombia, which ranges from 18-57 years in women and up to 62 years in men. The economic valuation of the PPYLL was discounted using an annual discount rate of 3% to achieve international comparability31,32. All costs were reported in 2019 US dollars, using the average market representative rate published by Colombia’s Central Bank (1 USD = 3,281 Colombian pesos)33. The PPYLL was calculated as follows:

PPYLLi: potentially productive years of lost life of the individual; Ap: pension age (according to the sex of the individual); Ad: death age (adjusted by mid-term); sAdg: start age of the death age group; k: mid-cycle adjustment factor (for children under one year = 0.5; 1 to 4 years = 2; for the other age groups: 2.5).
The estimate of the economic burden associated with premature deaths caused by cirrhosis and liver tumors was modeled for two scenarios:
Floor scenario (lower loss): PPYLLs are valued based on the annual minimum wage (AMW), calculated using the 2019 minimum monthly wage (COP 828,116). This value was multiplied by 13.5 months (12 calendar months + 1.5 months of social benefits).
Ceiling scenario: It refers to the country’s average productivity, evaluated as the gross domestic product per capita (GDPpc) of 2019 (COP 21,506,780)34.
RESULTS
The burden of liver disease
Between 2009 and 2016, the total burden of liver disease represented 687,861 DALYs (1,835 x 1,000 people). By age group and sex, there is evidence of more DALYs in both sexes from age 30 (Table 1).
Table 1 Disability-adjusted life years (DALYs) and economic burden by sex and age group, liver disease, Colombia, 2009-2016
| Age group | Men | Women | Total | ||||
|---|---|---|---|---|---|---|---|
| DALY men | DALY/1,000 | DALY women | DALY/1,000 | Total DALY | DALY/1,000 | ||
| 0-4 | 5814 | 0.330 | 5584 | 0.332 | 11398 | 0.331 | |
| 5-14 | 1966 | 0.056 | 2676 | 0.079 | 4642 | 0.067 | |
| 15-29 | 6356 | 0.127 | 5914 | 0.122 | 12 270 | 0.124 | |
| 30-44 | 24 900 | 0.686 | 15 547 | 0.402 | 40 448 | 0.540 | |
| 45-59 | 84 219 | 3.021 | 52 584 | 1.714 | 136 802 | 2.336 | |
| 60-69 | 139 309 | 13.477 | 151 583 | 13.038 | 290 892 | 13.245 | |
| 70-79 | 63 549 | 11.729 | 77 288 | 11.568 | 140 837 | 11.640 | |
| 80+ | 21 209 | 9.913 | 29 362 | 9.812 | 50 571 | 9.854 | |
| Total | 347 323 | 1.877 | 340 538 | 1.794 | 687 861 | 1.835 | |
Source: The authors.
Annual DALYs increased progressively between 2009 and 2014, from 1.59 to 2.13 DALYs per 1,000 people, with a subsequent decline in 2016 to 1.77 DALYs per 1,000 people (Figure 1). Of the total DALYs due to liver disease, 67% correspond to mortality and 33% to disability. When performing the analysis by sex, the proportion of DALYs due to mortality was higher in men than in women (37% vs. 30%); however, DALYs due to disability were higher in women than in men (19% vs. 14%) (Figure 2).
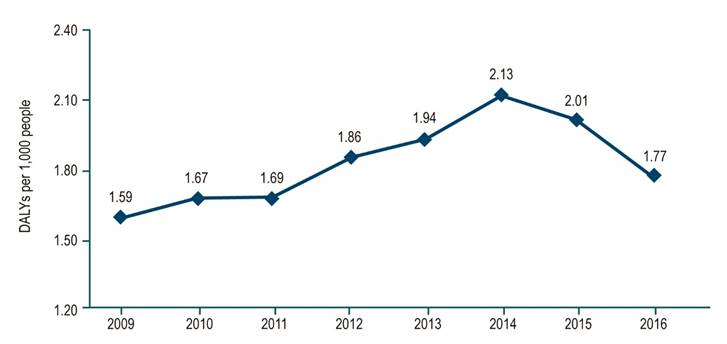
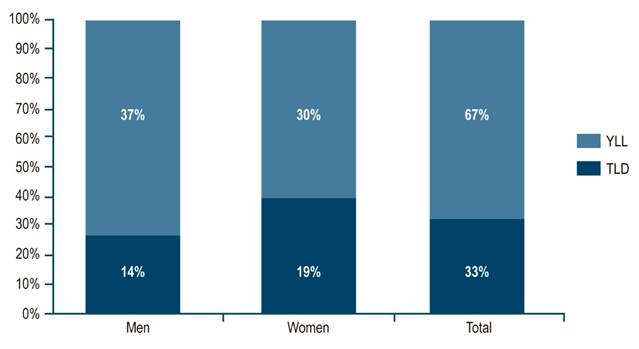
Figure 2 The proportion of YLLs and YLDs over DALYs due to liver disease in Colombia, 2009-2016. Source: The authors.
The main etiologies of liver disease burden were cirrhosis, liver tumors, and metabolic and viral diseases, with differences in burden due to disability and premature death (Figure 3, Table 2).
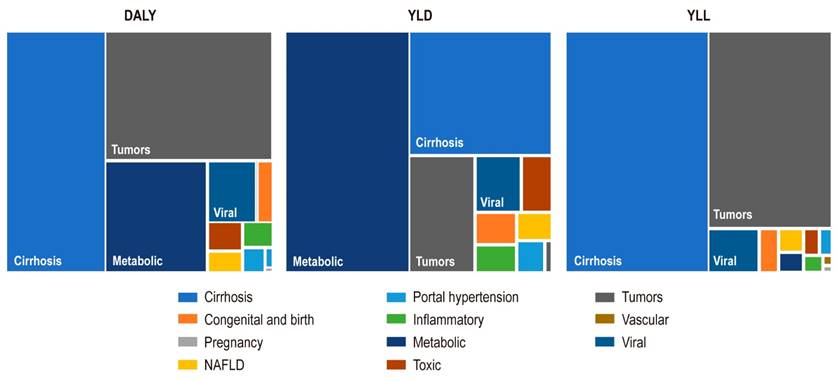
Figure 3 DALYs, YLDs, and YLL distribution due to liver disease in Colombia, 2009-2016. Source: The authors.
Table 2 DALYs, YLLs, and YLD by sex, Colombia, 2009-2016
| DALY | ||||||
|---|---|---|---|---|---|---|
| Category | Men | Men *1,000 | Women | Women *1,000 | Total | Total *1,000 |
| Cirrosis | 177 255 | 7.656 | 130 157 | 5.473 | 307 412 | 6.55 |
| Congénitas y del nacimiento | 3591 | 0.155 | 6975 | 0.293 | 10 567 | 0.22 |
| Del embarazo | 0 | 0.000 | 538 | 0.023 | 538 | 0.01 |
| EHANC | 6009 | 0.260 | 2052 | 0.086 | 8061 | 0.17 |
| Hipertensión portal | 3017 | 0.131 | 3088 | 0.130 | 6105 | 0.13 |
| Inflamatorias | 2757 | 0.119 | 4127 | 0.173 | 6884 | 0.15 |
| Metabólicas | 43 525 | 1.868 | 65 765 | 2.754 | 109 290 | 2.32 |
| Tóxicas | 3992 | 0.173 | 5262 | 0.221 | 9254 | 0.20 |
| Tumores hepáticos | 93 254 | 4.031 | 109 047 | 4.601 | 202 300 | 4.32 |
| Vasculares | 623 | 0.027 | 725 | 0.030 | 1348 | 0.03 |
| Virales | 13 300 | 0.576 | 12 802 | 0.540 | 26 102 | 0.56 |
| Enfermedad hepática | 347 323 | 1.870 | 340 538 | 1.794 | 687 861 | 1.83 |
| YLL | ||||||
| Category | Men | Men *1,000 | Women | Women *1,000 | Total YLLs | %YLLs |
| Cirrosis | 150 968 | 6.526 | 94 683 | 4.020 | 245 651 | 53% |
| Congénitas y del nacimiento | 2683 | 0.116 | 3295 | 0.135 | 5978 | 1% |
| Del embarazo | 0 | 0.000 | 536 | 0.017 | 536 | 0% |
| EHANC | 3852 | 0.166 | 609 | 0.023 | 4461 | 1% |
| Hipertensión portal | 1625 | 0.071 | 1273 | 0.059 | 2898 | 1% |
| Inflamatorias | 1295 | 0.057 | 1330 | 0.055 | 2625 | 1% |
| Metabólicas | 1715 | 0.073 | 2086 | 0.088 | 3800 | 1% |
| Tóxicas | 1551 | 0.068 | 1461 | 0.061 | 3011 | 1% |
| Tumores hepáticos | 80 278 | 3.466 | 94 969 | 4.022 | 175 246 | 38% |
| Vasculares | 346 | 0.015 | 269 | 0.009 | 615 | 0% |
| Virales | 9347 | 0.405 | 7316 | 0.310 | 16 663 | 4% |
| Enfermedad hepática | 253 659 | 10.952 | 207 826 | 8.800 | 461 485 | 100% |
| YLD | ||||||
| Category | Men | Men *1,000 | Women | Women *1,000 | Total de APMPs | % YLDs |
| Cirrosis | 26 287 | 1.091 | 35 475 | 1.484 | 61 761 | 27% |
| Congénitas y del nacimiento | 908 | 0.038 | 3680 | 0.154 | 4588 | 2% |
| Del embarazo | 0 | 0.000 | 3 | 0.000 | 3 | 0% |
| EHANC | 2157 | 0.090 | 1443 | 0.060 | 3600 | 2% |
| Hipertensión portal | 1392 | 0.058 | 1815 | 0.076 | 3207 | 1% |
| Inflamatorias | 1462 | 0.060 | 2798 | 0.117 | 4259 | 2% |
| Metabólicas | 41 810 | 1.727 | 63 679 | 2.665 | 105 490 | 47% |
| Tóxicas | 2442 | 0.101 | 3801 | 0.159 | 6242 | 3% |
| Tumores hepáticos | 12 976 | 0.540 | 14 078 | 0.592 | 27 054 | 12% |
| Vasculares | 277 | 0.011 | 455 | 0.019 | 732 | 0% |
| Virales | 3952 | 0.165 | 5486 | 0.231 | 9438 | 4% |
| Enfermedad hepática | 93 663 | 3.882 | 132 712 | 5.557 | 226 375 | 100% |
Source: The authors.
Liver cirrhosis had 307,412 DALYs (0.82 x 1,000 people), 58% in men. Of these, 245,651 DALYs were attributed to mortality (80%) and 60,793 to disability. Both men and women had the highest number of DALYs after 60. By year, it is evident that the highest DALY rates occurred between 2014 and 2015 (0.940 and 0.932 x 1,000 inhabitants, respectively) (Table 2).
Metabolic diseases had 109,280 DALYs (0.29 x 1,000 people), 43,535 DALYs (40%) in men, and 65,765 DALYs (60%) in women. Of the total DALYs, 3,800 (3%) correspond to mortality and 105,490 (97%) to disability. By age group, 82,366 DALYs (75.4%) belong to the 60-69 age group, followed by the 70-79 age group with 19,466 DALYs (17.8%). Metabolic diseases showed 0.413 DALYs x 1m000 people in 2014, followed by 0.356 in 2016 and 0.337 in 2015; the other years had less than 0.332 DALYs x 1,000 people (Table 2).
Liver tumors had 202,300 DALYs (0.54 x 1,000 people), of which 93,254 DALYs (46%) were in men and 109,047 DALYs (54%) in women. 175,246 DALYs (87%) were reported for mortality, and 27,054 DALYs (13%) for disability. When analyzed by age groups, there are 65,709 DALYs (32.5%) between 60 and 69 years, followed by 51,248 DALYs (25.3%) between 70 and 79 years, and 46,270 DALYs (22.9%) between 45 and 59 years. In 2014, there was a rate of 0.595 DALYs x 1,000 people, followed by 2012, 2014, and 2015 with rates between 0.558 and 0.561 DALYs x 1,000 people (Table 2).
Viral infections featured 26,102 DALYs (0.07 x 1,000 people), of which 13,300 DALYs (51%) correspond to men and 12,802 DALYs (49%) to women. 16,663 DALYs (64%) were registered for mortality, and 9438 DALYs (36%) for disability. 10,983 DALYs (42%) were reported between 60 and 69 years, followed by 4,506 (17%) between 45 and 59 years and 3,795 (15%) between 70 and 79 years, and the year 2016 had the lowest DALY rate (0.058 x 1,000 people). In the other years, they ranged between 0.068 and 0.078 x 1,000 people (Table 2).
The DALY, YLD, and YLL data for alcoholic liver disease portal hypertension, congenital and birth, pregnancy, inflammatory, toxic, vascular diseases, and NAFLD are found in Table 2 because they do not represent a significant disease burden.
Economic burden of deaths from cirrhosis and liver tumors
For 2016, deaths in productive ages due to cirrhosis caused 9,064 YPLL (69.5% in those over 40) and 4,103 (62.8%) from liver tumors. These YPLYL due to cirrhosis produced an economic burden that ranged between 19.6 and 37.8 million dollars, and for liver tumors, between 8.6 and 16.5 million dollars (Table 3).
Table 3 Estimated PLYL and economic burden for cirrhosis and liver tumors, with and without discount. Colombia, 2016
| Age group | Total PPYLL | PPYLL discount | Economic burden without discount* | Economic burden with discount * | ||||||||
| Floor | Ceiling | Floor | Ceiling | |||||||||
| F | M | F | M | F | M | F | M | F | M | F | M | |
| Hepatic cirrhosis | ||||||||||||
| 15-19 | 249 | 90 | 80 | 25 | $ 847 305 | $ 306 204 | $ 1 630 010 | $ 589 063 | $ 271 523 | $ 84 643 | $ 522 345 | $ 162 833 |
| 20-24 | 149 | 163 | 54 | 51 | $ 506 182 | $ 556 095 | $ 973 772 | $ 1 069 793 | $ 182 567 | $ 173 013 | $ 351 215 | $ 332 835 |
| 25-29 | 381 | 214 | 159 | 77 | $ 1 298 467 | $ 728 555 | $ 2 497 937 | $ 1 401 564 | $ 542 916 | $ 262 772 | $ 1 044 440 | $ 505 509 |
| 30-34 | 158 | 366 | 77 | 153 | $ 539 194 | $ 1 245 935 | $ 1 037 279 | $ 2 396 878 | $ 261 356 | $ 520 952 | $ 502 786 | $ 1 002 185 |
| 35-39 | 336 | 658 | 189 | 319 | $ 1 144 412 | $ 2 241 980 | $ 2 201 572 | $ 4 313 026 | $ 643 067 | $ 1 086 725 | $ 1 237 106 | $ 2 090 596 |
| 40-44 | 390 | 1007 | 254 | 566 | $ 1 329 645 | $ 3 431 601 | $ 2 557 916 | $ 6 601 571 | $ 866 156 | $ 1 928 284 | $ 1 666 274 | $ 3 709 551 |
| 45-49 | 450 | 1288 | 340 | 839 | $ 1 533 219 | $ 4 388 930 | $ 2 949 542 | $ 8 443 240 | $ 1 157 845 | $ 2 859 031 | $ 2 227 414 | $ 5 500 085 |
| 50-54 | 349 | 1501 | 305 | 1134 | $ 1 188 428 | $ 5 115 726 | $ 2 286 248 | $ 9 841 419 | $ 1 040 412 | $ 3 863 257 | $ 2 001 501 | $ 7 431 972 |
| 55-59 | - | 1315 | - | 1152 | $ 0 | $ 4 482 199 | $ 0 | $ 8 622 667 | $ 0 | $ 3 923 952 | $ 0 | $ 7 548 734 |
| 60-64 | - | - | - | - | $ 0 | $ 0 | $ 0 | $ 0 | $ 0 | $ 0 | $ 0 | $ 0 |
| Total | 2461 | 6603 | 1457 | 4315 | $ 8 386 853 | $ 22 497 227 | $ 16 134 275 | $ 43 279 221 | $ 4 965 843 | $ 14 702 628 | $ 9 553 081 | $ 28 284 300 |
| Liver tumors | ||||||||||||
| 15-19 | 166 | 90 | 53 | 25 | $ 564 870 | $ 306 204 | $ 1 086 673 | $ 589 063 | $ 181 015 | $ 84 643 | $ 348 230 | $ 162 833 |
| 20-24 | 74 | 326 | 27 | 102 | $ 253 091 | $ 1 112 191 | $ 486 886 | $ 2 139 586 | $ 91 284 | $ 346 026 | $ 175 608 | $ 665 671 |
| 25-29 | 64 | 143 | 27 | 51 | $ 216 411 | $ 485 704 | $ 416 323 | $ 934 376 | $ 90 486 | $ 175 181 | $ 174 073 | $ 337 006 |
| 30-34 | 53 | 122 | 26 | 51 | $ 179 731 | $ 415 312 | $ 345 760 | $ 798 959 | $ 87 119 | $ 173 651 | $ 167 595 | $ 334 062 |
| 35-39 | 336 | 152 | 189 | 74 | $ 1 144 412 | $ 517 380 | $ 2 201 572 | $ 995 314 | $ 643 067 | $ 250 783 | $ 1 237 106 | $ 482 445 |
| 40-44 | 281 | 322 | 183 | 181 | $ 957 345 | $ 1 098 112 | $ 1 841 699 | $ 2 112 503 | $ 623 632 | $ 617 051 | $ 1 199 718 | $ 1 187 056 |
| 45-49 | 307 | 539 | 232 | 351 | $ 1 045 376 | $ 1 837 227 | $ 2 011 051 | $ 3 534 379 | $ 789 440 | $ 1 196 804 | $ 1 518 691 | $ 2 302 361 |
| 50-54 | 281 | 393 | 246 | 296 | $ 957 345 | $ 1 337 445 | $ 1 841 699 | $ 2 572 920 | $ 838 110 | $ 1 010 002 | $ 1 612 320 | $ 1 942 999 |
| 55-59 | - | 456 | - | 399 | $ 0 | $ 1 552 140 | $ 0 | $ 2 985 941 | $ 0 | $ 1 358 824 | $ 0 | $ 2 614 049 |
| 60-64 | - | - | - | - | $ 0 | $ 0 | $ 0 | $ 0 | $ 0 | $ 0 | $ 0 | $ 0 |
| Total | 1561 | 2542 | 981 | 1530 | $ 5 318 581 | $ 8 661 714 | $ 10 231 664 | $ 16 663 042 | $ 3 344 153 | $ 5 212 964 | $ 6 433 341 | $ 10 028 482 |
*Amounts in 2019 US dollars. Source: The authors.
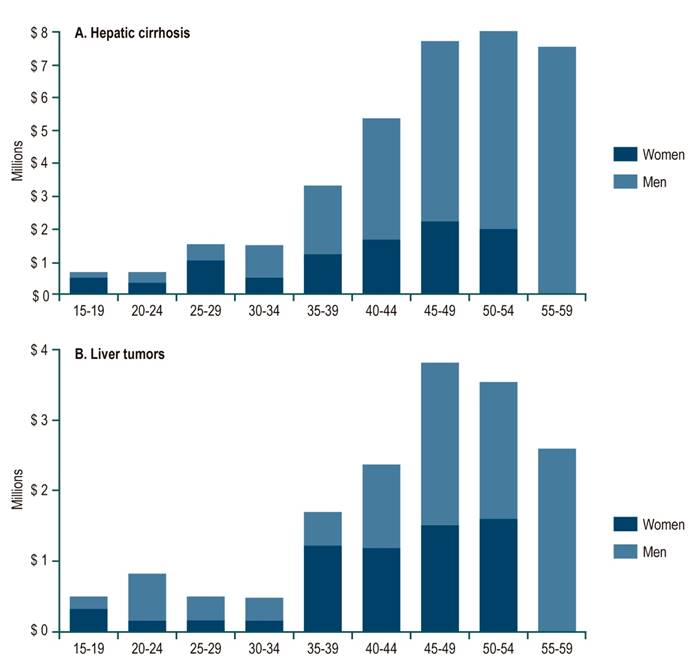
Figure 4 shows the economic burden of premature mortality due to cirrhosis and liver tumors by sex and age group. Most of the economic burden of cirrhosis occurs in men, especially those aged 35 years or older (Figure 4A), and it ascends to 54 years. In turn, the economic burden of liver tumors is higher in women in the 15-19 and 35-39 age groups; the burden is more significant in men in the remaining groups. A variable economic burden is noted in the first age groups, rising from over 35 to 49 and then decreasing to 59 years (Figure 4B).
Discussion and conclusions
The total burden of liver disease represented 687,861 DALYs (1,835 x 1,000 inhabitants), with an increase between 2009 and 2014 (1.59 to 2.13 DALYs x 1,000 people) and a subsequent decrease in 2016 (1.77 DALYs x 1,000 people).
The highest proportion of DALYs was due to mortality (67%). Men had more YLL, and women exhibited the highest YLDs due to liver disease. This trend was maintained throughout the study period, which may be related to a longer life expectancy in women, biological factors (genetic, hormonal, autoimmune), and social and behavioral factors (tobacco and alcohol use)35,36.
Deaths from cirrhosis created an economic burden that ranged between US 19.6 and 37.8 million, and from liver tumors between US 8.6 and 16.5 million, which can be significantly impacted by immunization against hepatitis B in the pediatric population and strategies against alcohol6, implemented since 1992 and 2007, respectively37,38.
In 2017, liver disease caused more than 1.32 million deaths globally in Europe, North America, South America, and Central Asia, and alcohol is the most common cause of liver cirrhosis. In some countries of the European region, approximately 2 million years of life are lost due to liver disease in people under 50 years of age (60%-80% due to alcohol)39.
In 2012, cirrhosis and liver cancer in the United States were among the top 5 causes of death from gastrointestinal, liver, and pancreatic diseases40. In 2015, they were the 11th and 16th most frequent causes of death in the world, causing 1.16 million and 788,000 deaths, respectively, and when combined, they represent 3.5% of deaths worldwide17. These results are consistent with our findings, in which cirrhosis and primary liver tumors were Colombia’s leading causes of death from liver disease.
By 2015, regionally, the highest proportion of deaths from cirrhosis and liver cancer was found in Latin America and the Caribbean, the Middle East, and North Africa17. Most liver cancers (83%) are diagnosed in less developed countries41; however, Fitzmaurice et al.18 described that the chances of developing liver cancer are higher in countries with a medium sociodemographic index (SDI). In 2005, liver cancer in Santander, Colombia, represented 59.4 DALYs x 100,000 people, of which 89.7% correspond to mortality and 10.2% to disability42.
The proportion in the distribution of mortality and disability does not show significant differences with our study since 202,300 DALYs (0.5 x 1,000 people) were estimated between 2009 and 2016, of which 87% correspond to mortality and 13% to disability. Considering the possibility of information systems underreporting mortality and prevalence in Colombia and studies worldwide, liver disease is related to geographic, socioeconomic, and sociocultural factors that lead to disparities with a significant impact on the health of the population and the country’s development concerning disability and premature mortality outcomes10,43,44.
Despite public health interventions related to immunization, healthy lifestyle habits (physical activity, diet), and measures to control alcohol use, the burden of liver disease in Colombia reflects the need to strengthen intervention strategies, from promotion and prevention to timely diagnosis and treatment, since economic and social expenses (drugs and technologies) can become unsustainable due to the increase in the disease burden45.
Limitations
The study’s main limitations in estimating cases and analyzing the population impact of public policy are the scarcity of epidemiological studies of liver disease in Colombia and underreporting in the information systems. This study does not include complications associated with the disease categories studied (such as variceal bleeding, ascites, hepatorenal syndrome, and portosystemic encephalopathy, among others, in the case of portal hypertension).
Care should be taken to interpret the data because the disease burden was assigned by disease category and does not include the severity scenario by disease category or other more complex situations in which multiple causes or risk factors contribute to disabilities or premature death individually.
The estimation of mortality costs was limited. Our analysis was performed from the perspective of the human capital method, which implied that friction costs were not considered. Some authors suggest that the friction cost method is an alternative to the human capital method. The latter would overestimate the costs associated with premature mortality because the production not obtained due to the death of a worker can be replaced by unemployed individuals46-48. This article justified the assessment of premature mortality due to liver diseases by selecting a floor scenario that illustrates these losses according to the annual minimum wage, which is close to 86.2% of the country’s median salaries49. The second scenario, or ceiling scenario, is the country’s average productivity evaluated as GDP per capita50,51.
Biases
Information bias regarding disability weights for all liver disease categories included in the study was controlled by expert consensus to assign values between 0 (perfect health) and 1 (death) because they were not fully defined in previous disease burden studies. Subjectivity bias in data analysis was contained by involving all researchers.
Recommendations
Despite national efforts to prevent and control chronic diseases, there is a substantial burden of liver disease in the Colombian population, requiring a more significant approach through strategies that contain, eliminate, or minimize the risk of developing the disease and its negative impact on the country, including the costs attributable to disability and premature mortality.
Our study shows that liver disease in Colombia and globally is a public health problem. It must be addressed with comprehensive strategies for prevention, control, treatment, and rehabilitation (particularly for patients with liver transplantation), with a multisectoral focus. Decisive public policy actions are required, such as vaccination (viral hepatitis, liver cancer), education on and restriction of alcohol use (cirrhosis), prevention and control of chronic non-communicable diseases such as diabetes and obesity (non-alcoholic cirrhosis), and of course, improved information systems to have the most reliable data to assess the impact of these public health measures.

