


 text in
  English (pdf)
 Article in xml format
 Article references
 Send this article by e-mail
 Cited by SciELO
  Cited by Google
  Similars in
SciELO
Similars in
SciELO  Similars in Google
 Permalink
Introduction
Liver cirrhosis is the fourth cause of death worldwide. Patients with decompensated cirrhosis have a ten-fold increased risk of death compared to the general population1. Currently, fatty liver disease (FLD) is the most common cause of chronic liver disease in most Western countries1-3.
Type 2 diabetes mellitus (T2DM), obesity, hyperlipidemia, and high blood pressure (HBP) are considered risk factors for the development of FLD, and this subgroup of patients is considered to be the one with the highest risk of advanced liver fibrosis, hepatocellular carcinoma, and cirrhosis2,3. At the same time, FLD is an independent risk factor for cardiovascular events4.
It has been described that end-stage renal disease (ESRD) and FLD have common pathophysiology pathways, and the diagnosis of metabolic syndrome has been associated with the progression of both pathologies3. Some studies have pointed out an increase in the prevalence (odds ratio [OR]: 2.1; 95% confidence interval [CI]: 1.69-2.66) and incidence of ESRD (1.79; 95% CI: 1.65-1.95) in patients with FLD3,5. A recent study that included 1,992 patients with diabetes found a bidirectional relationship between the appearance of FLD and chronic kidney disease and even pointed out some pathways through which these two entities can mutually influence their risk of manifestation6.
In patients with cirrhosis, chronic kidney disease (CKD) is associated with a higher risk of adverse renal and hospital outcomes and decreased survival7. On the other hand, patients with cirrhosis due to FLD on the transplant list face unique challenges and require simultaneous liver and kidney transplantation in more significant numbers compared to other etiologies8-10.
Transient elastography (Fibroscan) is a non-invasive technique used to estimate liver fibrosis11, assessing the hardness of the organ by measuring the speed at which a vibrating wave passes through the liver parenchyma. In addition to avoiding all the risks inherent in performing the biopsy, the procedure incorporates some quality criteria12,13 that allow the soundness of results to be determined at the bedside. Elastography has proven to be a valid tool for estimating the degree of liver fibrosis in FLD and other pathologies14.
Although the risk factors for liver fibrosis and cirrhosis have been well characterized in patients with FLD15,16, the studies carried out paradoxically exclude patients on dialysis in whom many of these factors frequently coexist and in whom the diagnosis of chronic liver disease may have important prognostic implications17.
The identification of risk factors for liver fibrosis in a population with ESRD can facilitate the early diagnosis of this complication and allow the activation of monitoring protocols that have been shown to reduce the morbidity and mortality associated with chronic liver disease18,19.
This study aims to describe the factors associated with advanced liver fibrosis in diabetic patients with ESRD on hemodialysis.
Materials and methods
Study design and population
A cross-sectional study was conducted, identifying diabetic patients on hemodialysis from the database of a hemodialysis unit in Cartagena until November 12, 2019. These patients attend three hemodialysis sessions weekly and are evaluated through a monitoring protocol that includes evaluation by a nephrologist and the performance of a set of laboratory tests. Medical history, sociodemographic, anthropometric, and analytical data were obtained from the medical records of each patient. We included patients on hemodialysis, over 18 years of age, with a diagnosis of diabetes mellitus and ESRD defined as GFR by Cockcroft-Gault formula <15 mL/min/1.73 m2.
Transient elastography and steatosis estimation were performed, taking advantage of the patients’ attendance at their hemodialysis sessions, and information from the medical records was collected simultaneously on the same day of the procedure. We used results from medical records to calculate the NAFLD score (for FLD) and the APRI score (AST to platelet ratio index); none were older than one month at the time of calculation.
Transient elastography and controlled attenuation parameter
The Fibroscan Touch Compact 530 was employed. All patients had fasted at least six hours before the study. The M or XL probes were used as appropriate. The result was the median value of ten valid kilopascal (kPa) measurements. The manufacturer’s quality criteria were considered to validate the robustness of results (interquartile range [IQR] ≤30% and success rate ≥60%). A cohort point of 8.2 kPa and 13.6 kPa were used to diagnose significant liver fibrosis and cirrhosis, respectively13. A controlled attenuation parameter (CAP) value ≥302 dB/m was the cohort point for the diagnosis of hepatic steatosis13.
Technical failure was deemed to occur when no valid measurement could be obtained. Only results that met the manufacturer’s quality criteria were included for analysis12-14.
NAFLD Score
The NAFLD score was calculated with the following formula:
-1.675 + (0.037 * age [years]) + (0.094 * BMI [kg/m2]) + (1.13 * carbohydrate intolerance/diabetes [yes = 1, no = 0]) + (0.99 * AST/ALT ratio) - (0.013 * platelet count [×109/L]) - (0.66 * albumin [g/dL]).
ALT: alanine aminotransferase; AST: aspartate aminotransferase; BMI: body mass index.
Three categories were identified according to a range of values as follows:
1.455- > low risk of liver fibrosis (sensitivity: 77%, specificity: 71%; positive predictive value [PPV]: 52%, negative predictive value [NPV]: 88%
≥ -1.455 to 0.676: undetermined risk.
> 0.676: high risk of liver fibrosis (sensitivity: 43%, specificity: 96%, PPV: 82%, NPV: 80%, LR +: 11)20.
Aspartate aminotransferase to platelet ratio index
The APRI score was calculated with the following formula:
(AST in IU/L) / (AST upper limit of normal in IU/L) / (platelets in 109/L)
A cut-off point of 0.7 was used to discriminate fibrosis (sensitivity of 65% and specificity of 72%)21.
Bioimpedanciometry
Bioimpedanciometry is a non-invasive technique used to accurately estimate total body water (TBW). With assumptions based on tissue hydration constants, we obtain fat-free mass (FFM) and fat mass (FM). These data help adjust renal replacement therapy22.
Statistical analysis
The mean (SD) and percentages described quantitative and categorical variables. The hypotheses were contrasted through the chi-squared test and the Student’s T-test, as appropriate. OR (95% CI) and mean differences were used to estimate the magnitude of associations. Statistical significance was established with a p-value = 0.05. The data were analyzed with Statistical Package for the Social Sciences (SPSS) version 15.
Results
Clinical and sociodemographic description of the study population
Eighty patients were included in the study, of which 16 were excluded due to failure to obtain a reliable elastographic measurement (seven did not meet the quality criteria and nine due to technical failure) (Figure 1). Of the 64 patients included, 56% were obese or overweight. The baseline characteristics of the population are shown in Table 1.
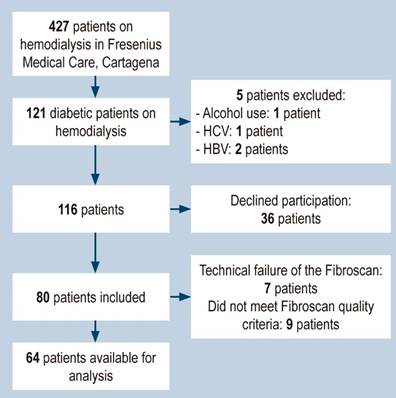
Table 1 Baseline characteristics of study patients*
| Variable | (n,%) |
|---|---|
| Age (years) | 63.5 (9.2) |
| Male sex | 34 (53) |
| High blood pressure | 62 (96.9) |
| HBP > 10 years | 62 (96.9) |
| DM > 10 years | 63 (98.4) |
| - Cerebrovascular disease | 3 (4.7) |
| - Myocardial infarction | 4 (6.3) |
| - Peripheral vascular disease | 7 (10.9) |
| - Heart failure | 13 (20.3) |
| - Atrial fibrillation | 1 (1.6) |
| - Retinopathy | 7 (10.9) |
| Causes CKD | |
| - Hypertension and diabetes | 46 (71.9) |
| - Hypertension | 7 (10.9) |
| - Diabetes | 9 (14.1) |
| - Other | 2 (3.1) |
| Time on dialysis (years) | 5 (3.3) |
| Weight (kg) | 66.6 (13) |
| Height (m) | 1.61 (0.07) |
| BMI (kg/m2) | 25.57 (5) |
| Classification according to BMI | |
| - Normal | 28 (43.8) |
| - Overweight | 22 (34.4) |
| - Obesity | 12 (18.8) |
| - Underweight | 2 (3.1) |
| Waist circumference (cm) | 94.2 (10.7) |
| Metabolic syndrome | 33 (51.6) |
| - Hemoglobin (g/dL) | 10.6 (1.5) |
| - Platelets x 109/L | 213 196 (83 915) |
| - LDL (mg/dL) | 88.1 (33) |
| - Total cholesterol (mg/dL) | 155.6 (41.1) |
| - HDL (mg/dL) | 32.6 (9.1) |
| - Triglycerides (mg/dL) | 174.3 (91.7) |
| - Glycosylated hemoglobin (%) | 6.5 (2) |
| - Creatinine (mg/dL) | 9.1 (3) |
| - Urea nitrogen (mg/dL) | 48 (15.1) |
| - Potassium (mEq/L) | 5 (0.8) |
| - Sodium (mEq/L) | 139.2 (2.4) |
| - Phosphorus (mEq/L) | 4.1 (1.3) |
| - Parathyroid hormone (pg/mL) | 372 (372) |
| - Calcium (mEq/L) | 8.5 (0.6) |
| - AST (UI/L) | 14.7 (6.7) |
| - ALT (UI/L) | 14 (10.6) |
| - Albumin (g/dL) | 4 (0.4) |
| - Alkaline phosphatase (IU/L) | 137.3 (95) |
| Fibroscan (kPa) | 7.2 (5.6) |
| IQR (kPa) | 0.15 (0.05) |
| CAP (dBm) | 244.1 (54.6) |
| APRI score (> 0.7) | 17 (26.6) |
| NAFLD Score | |
| - Low risk | 3 (47) |
| - Indeterminate | 46 (71.9) |
| - High risk | 15 (23.4) |
| Hepatic steatosis | 7 (10.9) |
| Liver fibrosis | 11 (17.2) |
| Hepatic cirrhosis | 7 (10.9) |
*Quantitative variables are expressed as mean and standard deviation (SD), and categorical variables are expressed as absolute frequencies and percentages (%). APRI: AST to platelet ratio index; ARA: angiotensin receptor antagonists; CAP: controlled attenuation parameter; DM: diabetes mellitus; CKD: chronic kidney disease; HDL: high-density lipoproteins; HBP: high blood pressure; ACEI: angiotensin-converting enzyme inhibitor; LDL: low-density lipoproteins; NAFLD score: nonalcoholic fatty liver disease score; IQR: interquartile range. Table prepared by the authors.
The population’s average age was 63.5 years; a similar proportion was observed between both sexes, and 77% belonged to SELs 1 and 2. Metabolic syndrome was found in 33 patients (52%). Sixty-two patients (96.9%) were hypertensive, 33 patients were dyslipidemic (50%), and 41 patients had an abdominal circumference above that recommended for their sex (64%).
Depending on the BMI values, 3% are underweight, 43% are normal weight, 34% are overweight, and 18% are obese. The average fatty tissue index was 17.7 kg/m2, and the lean tissue index was 12.1 kg/m2. According to CAP measurements, hepatic steatosis was found in 13.8% of patients.
Despite being a cohort of diabetic patients with ESRD, 100% had a triglyceride value, and 77% had a glycosylated hemoglobin A1c (HbA1c) value within the established goals; however, only 17% had adequate control of LDL levels, and 63% of blood pressure levels.
The most frequent secondary chronic complications of diabetes, apart from chronic renal failure, were heart failure (20%), retinopathy (11%), peripheral vascular disease (11%), acute myocardial infarction (6%), and cerebrovascular disease (5%).
The leading cause of CKD is the combination of diabetic and hypertensive nephropathy (72%), followed by diabetes (14%) or high blood pressure (11%) independently. The cohort of patients studied had a mean time on dialysis of 5 years; of these, 67% received some antihypertensive treatment. The most frequently used were calcium antagonists, clonidine, and angiotensin-converting enzyme inhibitors (ACEI) or angiotensin II receptor antagonists (ARBs).
84% of the patients received treatment with erythropoietin analogs and 60% with parenteral iron. Only 18 patients have hemoglobin levels below the expected values. Alterations in mineral and bone metabolism are also present in the studied patients, of which 43% received treatment with calcium carbonate and 34% with calcitriol. For the treatment of hyperparathyroidism, 11 patients received sevelamer (Renvela-Renagel) and six cinacalcet (Mimpara-Sensipar).
Regarding indirect markers of liver injury, aminotransferases and albumin were within typical values in 89% and 84% of patients, respectively. The risk assessment scales for liver fibrosis indicated that tem (19%) were at high risk for liver fibrosis according to the NAFLD score and twelve (23%) according to the APRI score.
Descriptive analysis of the population with significant liver fibrosis
There were eleven (17%) patients with significant liver fibrosis, among which seven (63%) had elastographic values compatible with established liver cirrhosis at the time of their evaluation, and none of whom had a previous diagnosis of chronic liver disease.
All patients had more than ten years of evolution for HBP and DM. The most common complications of diabetes were heart failure (36.4%), peripheral vascular disease (27.3%), cerebrovascular events (18%), retinopathy (18%), and myocardial infarction (9%). Besides, 54% of the patients were of normal weight, 36% were overweight, and 9% were underweight (Table 2).
Table 2 Characteristics of patients with fibrosis*
| Variable | Fibrosis n (%) |
|---|---|
| Male sex | 8 (72.7) |
| Age | 67.9 (8) |
| Health system | |
| - Subsidized | 5 (45.5) |
| - Contributory | 5 (45.5) |
| - Special | 1 (9.1) |
| HBP | 11 (100) |
| HBP > 10 years | 11 (100) |
| DM > 10 years | 11 (100) |
| Cerebrovascular disease | 2 (18.2) |
| Myocardial infarction | 1 (9.1) |
| Peripheral vascular disease | 3 (27.3) |
| Heart failure | 4 (36.4) |
| Atrial fibrillation | 0 (0) |
| Retinopathy | 2 (18.2) |
| Causes CKD | |
| - Hypertension and diabetes | 5 (45.5) |
| - Hypertension | 3 (27.3) |
| - Diabetes | 3 (27.3) |
| BMI classification | |
| - Normal | 6 (54.5) |
| - Overweight | 4 (36.4) |
| - Obesity | 0 (0) |
| - Underweight | 1 (9.1) |
| Metabolic syndrome | 4 (36.4) |
| Treatment | |
| - ACEI or ARA | 3 (27.3) |
| -β blockers | 4 (36.4) |
| - Clonidine | 6 (54.5) |
| - Calcium antagonist | 10 (90.9) |
| - Minoxidil | 2 (18.2) |
| - Erythropoietin | 8 (72.7) |
| - Parenteral iron | 5 (45.5) |
| - Calcitriol | 3 (27.3) |
| - Calcium carbonate | 4 (36.4) |
| - Aluminum hydroxide | 1 (9.1) |
| - Paricalcitol | 1 (9.1) |
| - Cinacalcet | 1 (9.1) |
| - Sevelamer | 2 (18.2) |
| NAFLD score | |
| - Low risk | 1 (9) |
| - Indeterminate | 5 (45.5) |
| - High risk | 5 (45.5) |
| APRI | |
| - Low risk | 6 (55) |
| - High risk | 5 (45) |
*Quantitative variables are expressed as mean, SD, and categorical variables as absolute frequencies and percentages (%). APRI: AST to platelet ratio index; ARA: angiotensin receptor antagonists; CAP: controlled attenuation parameter; DM: diabetes mellitus; CKD: chronic kidney disease; HDL: high-density lipoproteins; HBP: high blood pressure; ACEI: angiotensin-converting enzyme inhibitor; LDL: low-density lipoproteins; NAFLD score: nonalcohol fatty liver disease score; IQR: interquartile range. Table prepared by the authors.
The NAFLD score identified only 45% of patients with fibrosis within the high-risk group; one of the eleven patients was classified within the low-risk group, and the remaining five were within the indeterminate risk group. The APRI score correctly classified 45% within the high-risk group (Table 3).
Table 3 Classification of patients according to NAFLD and APRI scores in patients with and without fibrosis
| Variable | No fibrosis n (%) | Fibrosis n (%) | p |
|---|---|---|---|
| NAFLD | 0.1 | ||
| Low risk | 2 (4) | 1 (9) | |
| Indeterminate | 41 (77) | 5 (45.5) | |
| High risk | 10 (19) | 5 (45.5) | |
| APRI | 0.1 | ||
| Low risk | 41 (77) | 6 (55) | |
| High risk | 12 (23) | 5 (45) |
APRI: AST to platelet ratio index; NAFLD score: nonalcoholic fatty liver disease score. Table prepared by the authors.
Factors associated with significant liver fibrosis
The factors associated with liver fibrosis were a history of cerebrovascular disease (p = 0.02), peripheral vascular disease (p = 0.05), BMI (p = 0.05), total cholesterol (p = 0.05), HbA1c (p = 0.01), sodium (p = 0.001), and AST (p = 0.02) (Tables 4 and 5).
Table 4 Bivariate analysis of continuous variables and comparison of means between patients with and without fibrosis*
| Variable | Fibrosis (mean, SD) | No fibrosis (mean, SD) | Mean difference | 95% CI | p |
|---|---|---|---|---|---|
| Age (years) | 67.9 (8) | 63.4 (9.2) | 4.4 | (-10.4)-3 | 0.14 |
| Time on dialysis (years) | 6.4 (2.4) | 4.6 (3.3) | 1.6 | (-3.9)-0.6 | 0.15 |
| Weight (kg) | 61.9 (13.4) | 67.8 (12.8) | 6 | (-2.3)-14.4 | 0.15 |
| Height (m) | 1.6 (0.03) | 1.6 (0.08) | 0.02 | (-0.05)-0.007 | 0.13 |
| BMI (m/m2) | 23.3 (4.5) | 26.3 (5) | 3.2 | (-0.01)-1.6 | 0.05 |
| Waist circumference (cm) | 91.9 (12.8) | 96.1 (10.5) | 5 | (-2.1)-12.2 | 0.16 |
| Systolic blood pressure (mm Hg) | 151.6 (32.8) | 151.9 (27.8) | 1.2 | (-19)-9.3 | 0.89 |
| Diastolic blood pressure (mm Hg) | 64.1 (10.9) | 75.6 (13.2) | 8.9 | 0.3-17.5 | 0.42 |
| Lean tissue index (kg/m2) | 14.9 (8.8) | 11.3 (5.7) | 4 | (-10)-2.7 | 0.17 |
| Fat tissue index (kg/m2) | 21.6 (16.5) | 16.9 (8.9) | 5.5 | (-16)-5 | 0.29 |
| Hydration status (L) | 30 (6) | 29 (7.2) | 0.8 | (-5.4)-2.3 | 0.73 |
| Hemoglobin (g/dL) | 10.9 (2.3) | 10.3 (1.7) | 0.1 | (-1.3)-0.5 | 0.72 |
| Platelets x 109/L | 197(106) | 222 (83) | 24626 | (-31858)-81110 | 0.38 |
| Ferritin (ng/mL) | 964 (649) | 666 (472) | 155.7 | (-492)-180.8 | 0.35 |
| Transferrin saturation index (%) | 37 (24.6) | 27.3 (14.6) | 6.4 | (-22.6)-9.7 | 0.4 |
| LDL (mg/dL) | 66.5 (19.7) | 88.5 (35.9) | 20.6 | (-2.1)-11.4 | 0.75 |
| Total cholesterol (mg/dL) | 124.2 (26.6) | 156.2 (50) | 31.5 | 0.0004-63 | 0.05 |
| HDL (mg/dL) | 29.3 (11.1) | 32.7 (10.8) | 3.7 | (-3.3)-10.8 | 0.29 |
| Triglycerides (mg/dL) | 141.7 (75.5) | 175 (99) | 35.9 | (-27.2)-99.1 | 0.26 |
| HbA1c (%) | 7.2 (1.1) | 5.6 (2.8) | 1.4 | (-0.2)-(-2.5) | 0.01 |
| Creatinine (mg/dL) | 8.8 (3) | 8.5 (3.1) | 0.06 | (-2.1)-2 | 0.95 |
| Urea nitrogen (mg/dL) | 45.4 (15.1) | 47.1 (14.9) | 3.2 | (-7.1)-13.5 | 0.5 |
| Potassium (mEq/L) | 5.1 (1.1) | 4.9 (0.7) | 0.1 | (-0.6)-0.3 | 0.5 |
| Sodium (mEq/L) | 136.9 (2.1) | 139.3 (2.4) | 2.7 | 1.1-4.4 | 0.001 |
| Phosphorus (mEq/L) | 3.6 (1.5) | 4.2 (1.2) | 0.39 | (-0.4)-1.2 | 0.37 |
| Parathyroid hormone (pg/mL) | 140 (88.1) | 381 (366) | 153 | (-85)-391 | 0.2 |
| Calcium (mEq/L) | 8.6 (0.4) | 8.6 (0.6) | 0.06 | (-0.4)-0.3 | 0.7 |
| AST (UI/L) | 21.3 (10.8) | 13 (5.7) | 8.5 | (-15.7)-(-1.3) | 0.02 |
| ALT (UI/L) | 22.3 (14) | 11.9 (9) | 8.3 | (-17.6)-0.9 | 0.07 |
| Albumin (g/dL) | 3.8 (0.7) | 3.9 (0.4) | 0.1 | (-0.1)-0.4 | 0.3 |
| Alkaline phosphatase (IU/L) | 119 (26.7) | 146 (119.7) | 11 | (-16)-(-7) | 0 |
*Quantitative variables are expressed as mean and standard deviation (SD). Table prepared by the authors.
Table 5 Bivariate analysis of the sociodemographic characteristics and background of the population and the presence or absence of liver fibrosis*
| Variable | Fibrosis n (%) | No fibrosis n (%) | OR | 95% CI | p |
|---|---|---|---|---|---|
| Female sex | 3 (27) | 27 (51) | 2.8 | 0.6-11.5 | 0.15 |
| Urban residence | 9 (82) | 49 (92) | 2.7 | 0.4-17.1 | 0.27 |
| Socioeconomic levels 1 and 2 | 11 (100) | 53 (82) | 0.28 | 0.03-2.3 | 0.21 |
| Subsidized system | 5 (45) | 29 (54) | 1.4 | 0.3-5.3 | 0.57 |
| Mixed race | 8 (72) | 47 (89) | 2.9 | 0.6-14.1 | 0.16 |
| High blood pressure | 11 (100) | 51 (96) | 1.2 | 1-1.3 | 0.51 |
| HBP > 10 years | 11 (100) | 51 (96) | 1.2 | 1-1.3 | 0.51 |
| DM > 10 years | 11 (100) | 52 (98) | 1.2 | 1-1.3 | 0.64 |
| Cerebrovascular disease | 2 (18) | 1 (1.9) | 11.5 | 0.9-141 | 0.02 |
| Myocardial infarction | 1 (9) | 3 (6) | 1.6 | 0.1-17.7 | 0.66 |
| Peripheral vascular disease | 3 (27) | 4 (7) | 4.5 | 0.8-24 | 0.05 |
| Heart failure | 4 (36) | 9 (17) | 2.7 | 0.6-11.5 | 0.14 |
| Atrial fibrillation | 0 (0) | 1 (2) | 0.8 | 0.7-0.9 | 0.64 |
| Retinopathy | 2 (18) | 5 (9) | 2.1 | 0.3-0.1 | 0.39 |
| Overweight and obesity | 5 (45) | 31 (58) | 0.5 | 0.1-2.1 | 0.42 |
| Metabolic syndrome | 4 (36) | 23 (36) | 0.4 | 0.1-1.7 | 0.24 |
DM: diabetes mellitus; HBP: high blood pressure. Table prepared by the authors
No relationship was found between NAFLD and APRI scores and the presence of fibrosis (p = 0.1). Among patients without fibrosis, 19% were in the high-risk group and 77% within the indeterminate group when the NAFLD score was used; for the APRI score, 77% of the group without fibrosis was in the low-risk group (Table 3).
Discussion
This study noticed a prevalence of significant liver fibrosis and cirrhosis of 17%, of which more than 50% had liver cirrhosis, which may have important prognostic implications in the evolution of the natural history of these two pathologies. These results are similar to those previously reported in which a prevalence of significant fibrosis between 13% and 21% has been found in diabetic patient populations17,23-25.
The relationship between the duration of diabetes and glycemic control with the risk of target organ damage has been fully established in other clinical scenarios15,26-28. The fact that 100% of patients with fibrosis had a diabetes history of more than ten years and worse glycemic control (HbA1c 7.6% vs. 5.6%) could partly explain the high prevalence of liver cirrhosis within this group of diabetic patients29,30.
Patients in this cohort have a high prevalence of cardiovascular risk factors such as age, male sex, lower glomerular filtration rate (GFR), dyslipidemia, and HBP, which are known synergistic risk factors for the development of liver fibrosis15,16.
However, despite T2DM and cardiovascular risk factors in this group, the presence of hepatic steatosis due to CAP was low, approximately 14%. This contradictory finding could be explained by the low prevalence of obesity in this sample (18%). The intense multidisciplinary interventions aimed at reducing cardiovascular risk factors that these patients undergo when included in a dialysis program may have positively affected weight and steatosis control at the time of evaluation. Some studies also indicate that patients with cirrhosis due to FLD in advanced stages may not have histological findings of steatosis despite multiple risk factors for metabolic syndrome31. Although the pathways by which this phenomenon occurs have not been elucidated, there has been speculation about the effect of changes in hepatic blood flow, exposure to insulin, and the release of glucose and lipoproteins from the hepatocyte on the reduction of fat in cirrhotic livers due to FLD31.
In several studies, a BMI > 30 kg/m2 is associated with fibrosis in diabetic patients15,18. Paradoxically, none of our patients with fibrosis exceeded this cut-off point. However, BMI was associated with liver injury, suggesting the possibility that liver damage in patients with ESRD begins at lower weight levels than those observed in other populations. It is also possible that the interventions that patients undergo in a structured dialysis program have improved weight control and that the highest degrees of obesity have occurred before their admission to renal replacement therapy, which confounds the observed relationship between overweight and fibrosis and that the latter was already present at the time the patients joined the program19,32.
A recent study in a cohort of diabetic patients whose objective was to identify common risk factors for FLD and CKD, as well as possible pathways through which these two pathologies could be interrelated, found that BMI and uric acid seem to act as mediators of the increased risk of CKD in diabetic patients with FLD, which again points out the role of overweight as a risk factor for the progression of both diseases6.
Established cardiovascular disease and, among these, cerebrovascular disease and peripheral vascular disease were significantly associated with advanced liver fibrosis19,33. However, their presence has not been described in other studies. Still, it is plausible to speculate that this association reflects a more severe metabolic disease with a greater probability of target organ damage and a higher risk of liver disease progression.
In our study, AST levels were associated with liver fibrosis and higher levels of AST were found compared to patients without fibrosis, with a mean difference of 8.5 IU/L. AST has been recurrently associated with fibrosis in this type of patient and is part of most non-invasive predictive models of fibrosis, such as NAFLD, APRI, Fibrometer, Lok index, and BARD scores20,21,34-36. Still, despite finding an association between fibrosis and AST in our patients, neither the NAFLD nor APRI scores adequately classified the subjects based on fibrosis. A possible explanation may be that ESRD has a modifying effect on the factors that have traditionally been associated with chronic liver injury in this population37-40.
The dilutional hyponatremia characteristic of patients with cirrhosis has been described as a predictor of mortality in patients with decompensated disease27,33. However, although patients with fibrosis did not present with hyponatremia, they had lower sodium levels when compared to their counterparts (136 mEq/L vs. 139 mEq/L; p = 0.001), suggesting an early marker of more advanced liver disease in this group of patients.
The elastographic values used to determine liver fibrosis and cirrhosis were 8.2 kPa (sensitivity: 71%, specificity: 70%) and 13.6 kPa (sensitivity: 85%, specificity: 79%), respectively, were validated in a multicenter study that included 383 patients with suspected FLD in the United Kingdom11. However, in our study, 10 of the 11 patients with fibrosis had elastographic values ≥10.3 kPa; the American FLD guideline indicates that values ≥9.9 kPa have a sensitivity of 95% and a specificity of 77%3, which, added to the quality criteria established by the manufacturer and normal transaminase levels in the vast majority of patients, reduces the risk of false positives occurring in our study.
Technical failure was observed in 14% (n = 7) of the patients, and the manufacturer’s quality criteria were not met in 10.9% (n = 9) of the cases, which is very similar to what is described in the literature reporting approximately 15% of patients for whom adequate measurements are not achieved12-14. Technical failure is similar to other studies in which its frequency ranges between 1% and 41.7%14. The most important factors associated with technical failure are a BMI >30 kg/m2, operator experience of fewer than 500 examinations, Hispanic race, age over 52 years, hip diameter, and T2DM41-43. It is possible that including only diabetic patients, among whom more than 50% were overweight or obese, with 96% of patients having a hip diameter above the permitted values, has influenced these differences.
ESRD is a microvascular complication of DM. In our study, 72% of patients with liver fibrosis have kidney damage due to diabetes, which supports the opinion that there is a synergistic relationship between these two diseases44,45. Furthermore, an epidemiological fact that supports the relationship between trinomial diabetes, chronic liver disease, and ESRD is that patients with FLD, which is considered the initial stage of liver disease due to diabetes, have a higher incidence of ESRD46,47.
Patients with liver cirrhosis have a higher risk of acute kidney injury and progression of kidney disease, so its timely diagnosis can have important prognostic implications48,49. In our study, 63% of the patients with liver fibrosis were in the cirrhotic stage, and in no case had this disease been previously identified. The lack of familiarity of dialysis units with the liver complications of diabetes may be causing an underdiagnosis of the disease; an active search is required in these patients to try to reduce the morbidity and mortality associated with the synergy of these two complications.
Chronic liver disease could increase the need for combined kidney and liver transplantation, and this procedure currently represents 10% of all transplants performed in the United States50.
The use of non-invasive markers in recent years has displaced the use of liver biopsy to determine advanced fibrosis. Positive predictive values (PPV) have been reported for the NAFLD score of 90% to detect cases of advanced fibrosis20,51,52. However, in this study, the positive and negative predictive value of the NAFLD score was 33% and 66%, respectively, which could suggest that these patients may possess unique characteristics that require validation of the scores in this subgroup before recommending its widespread use in this population. Besides, the APRI score in this study showed a PPV of 41% and NPV of 87% and misclassified more than 50% of patients.
To our knowledge, this is the first study that estimates liver fibrosis in diabetic patients with ESRD on dialysis. Liver fibrosis is an independent predictor of mortality, so its determination in this group of patients is essential18; its active search in this population could result in strategies that slow the progression of both diseases and improve the quality of life of patients, reduce the number of complications and increase their survival. However, prospective studies are needed to understand better the natural history of patients with ESRD and advanced liver fibrosis.
Conclusion
The prevalence of significant liver fibrosis in patients with diabetes and ESRD is similar to that reported in other populations of patients with diabetes. However, some factors, such as being overweight, could behave differently, which favors the appearance of liver injury with lower degrees of obesity than those previously reported in the literature.

